Ethereum faces a $46M sell-off as demand weakens – What’s next?

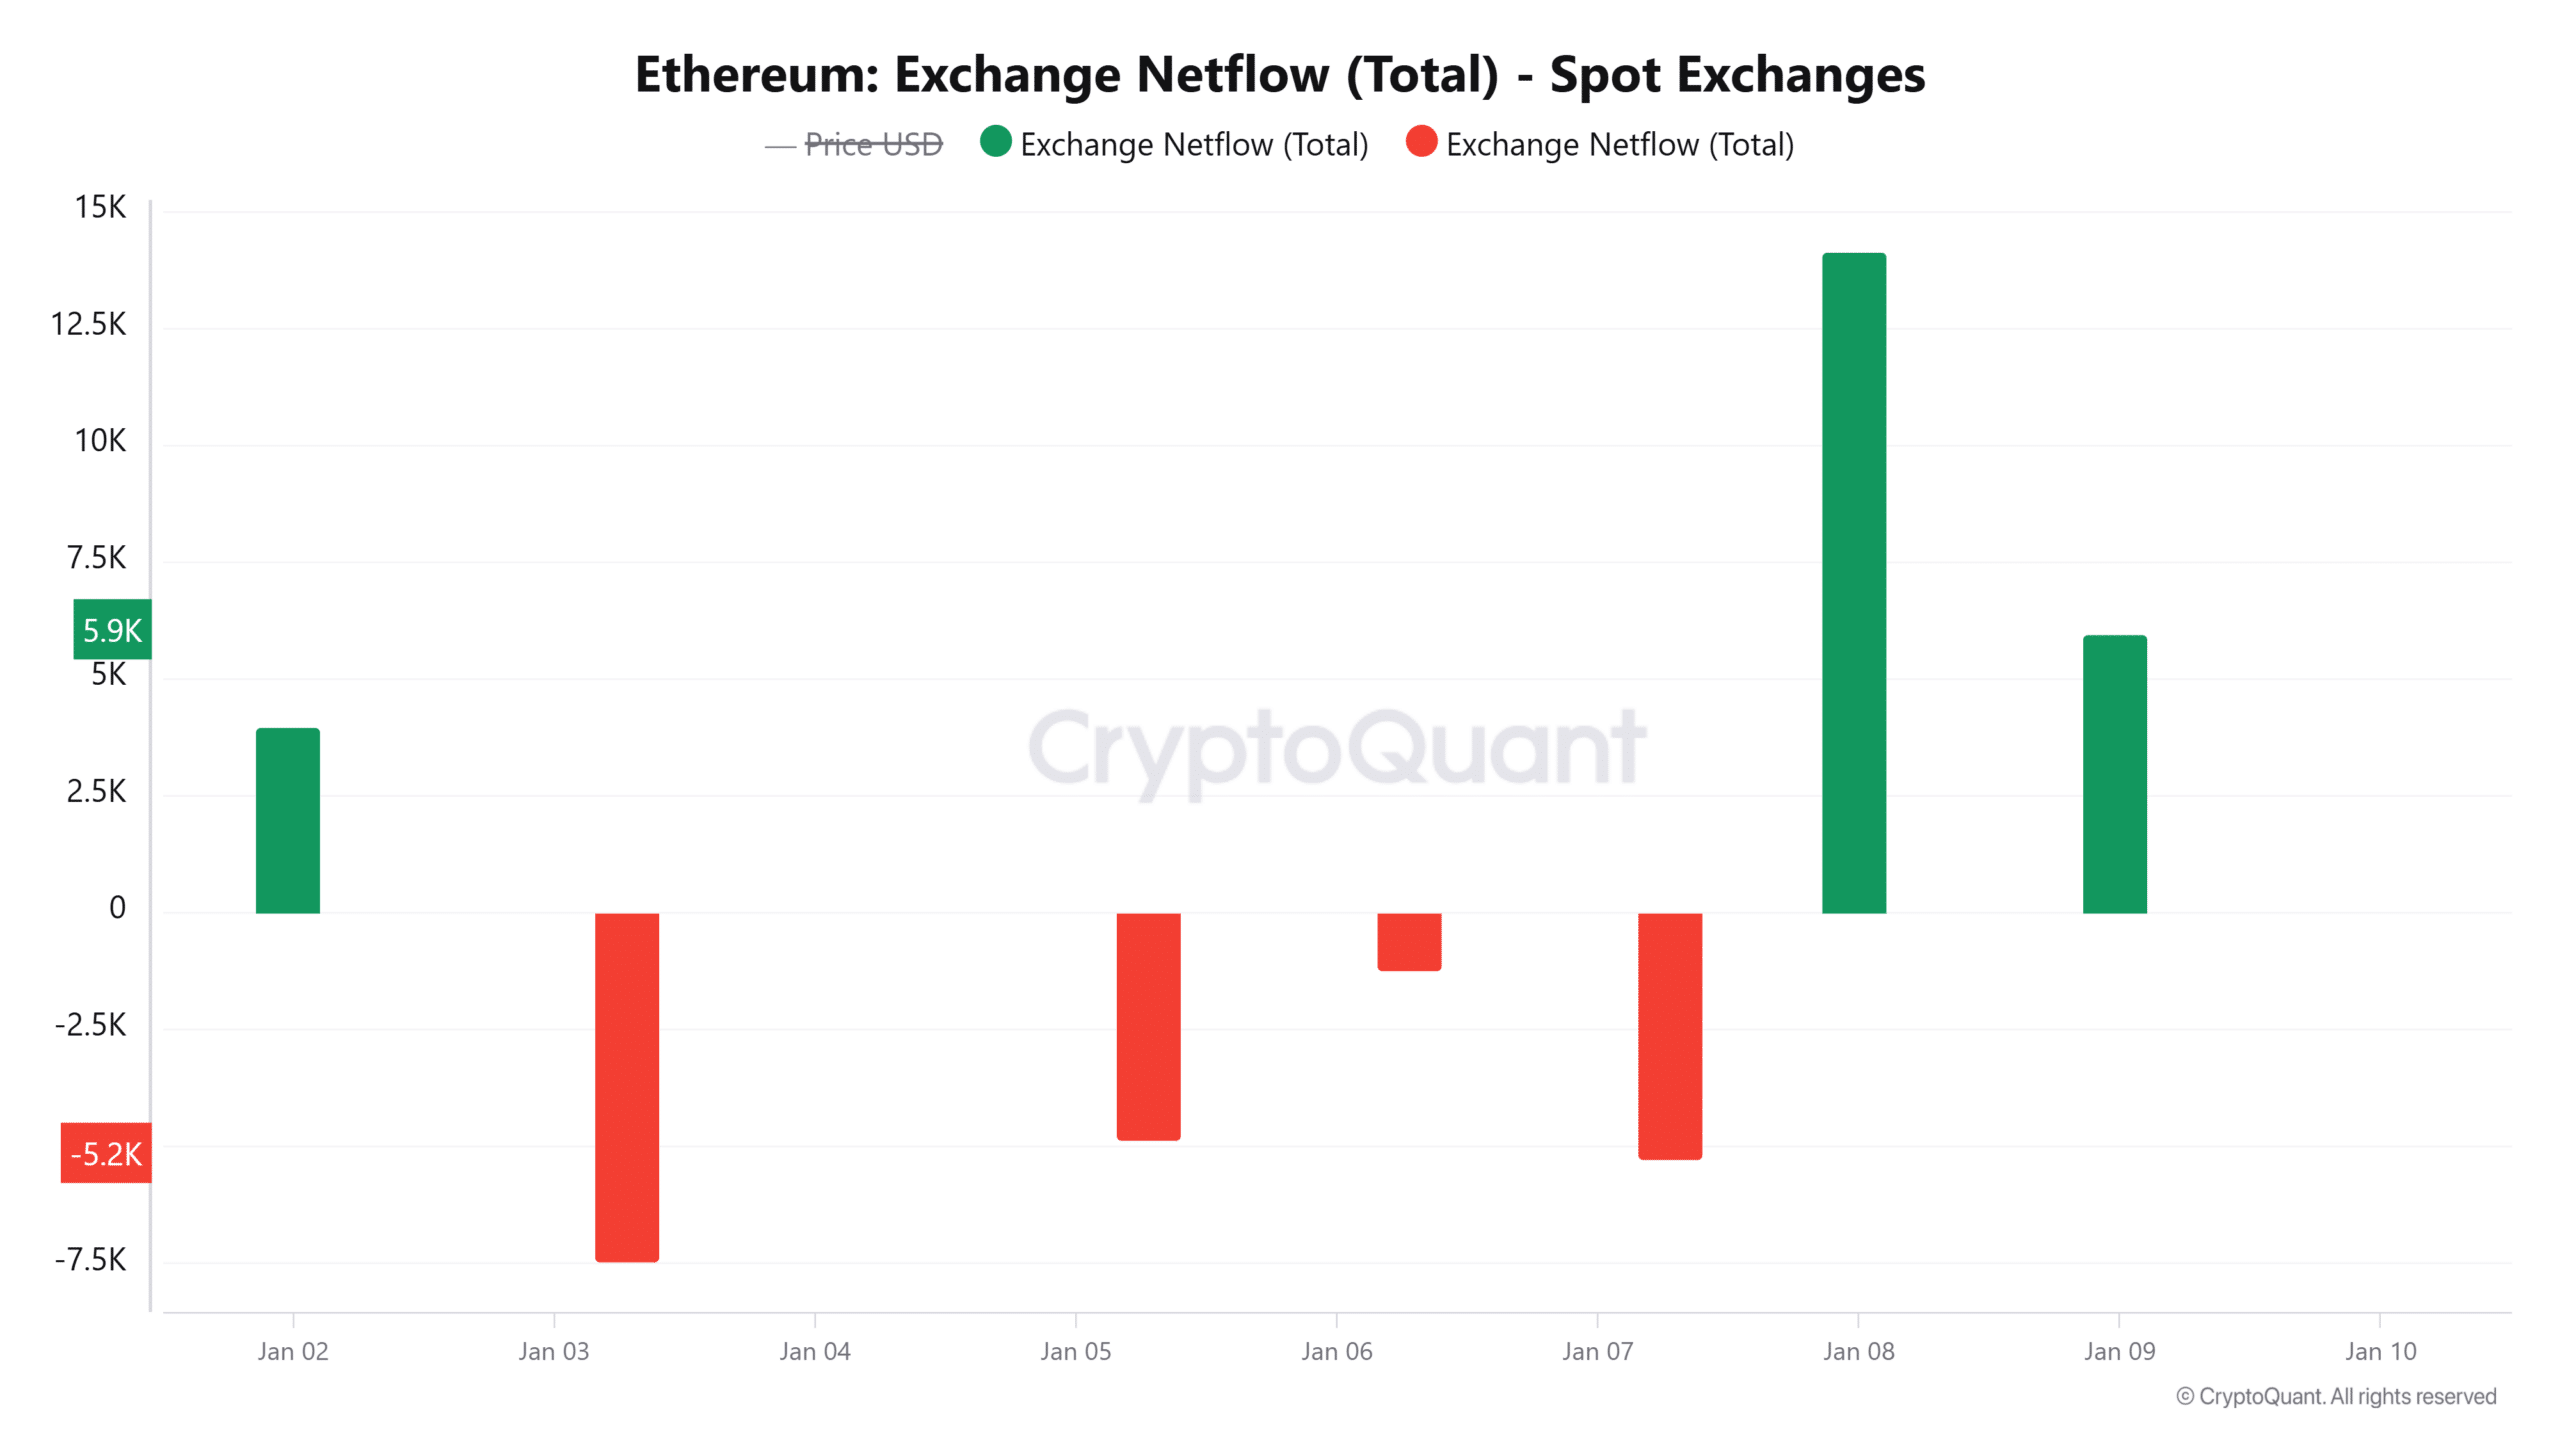
- More than $46M worth of ETH was moved to exchanges on the 8th of January, marking the highest net inflows in nearly three weeks.
- The sell-off comes amid weak demand after spot ETH ETFs posted the second-highest outflows since launch.
Ethereum [ETH] has yet to record any significant gains in 2025. In the last two days, the largest altcoin has dropped from around $3,700 to trade at $3,324 at press time.
One of the factors behind Ethereum’s bearish trend is weakened demand. For instance, on the 8th of January, the outflows from spot Ethereum exchange-traded funds (ETFs) reached $159M per SoSoValue.
This was the second-highest level of outflows since the products launched in July last year.
Besides institutional investors, retail traders also seem to be in a distribution phase, causing a surge in selling activity.
ETH faces intense selling pressure
Data from CryptoQuant shows that on the 8th of January, the net inflows for ETH to spot exchanges hit 14,143, valued at more than $46M. This was the highest level of positive netflows in nearly three weeks.
These inflows led to a surge in exchange reserves to 8.06M ETH, which is also at its highest level in a week.
When more ETH tokens are transferred to exchanges, it shows an intent by traders to sell. This could result in bearish sentiment, and once these tokens are dumped into the market, it leads to a negative price momentum.
Will sellers push ETH below $3,000?
Ethereum’s weekly chart shows that a crucial support level lies at $2,870. Going by past trends, a breach below this support has coincided with significant price declines.
If selling activity continues amid a lack of demand to absorb these sold coins, ETH could drop further towards this support level. However, selling activity has yet to overpower buying pressure.
This was seen in the Relative Strength Index (RSI) indicator that stood at 52 at press time, which was a near-neutral level.
If neither buyers nor sellers have the upper hand, ETH could enter into a consolidation range. However, traders should watch out for the bearish pressure depicted by the red Awesome Oscillator (AO) histogram bars.
Ethereum’s leverage ratio hits record highs
Ethereum’s estimated leverage ratio, which measures the risk appetite among traders, has surged to 0.605, setting a new record high.
This rising ratio indicates that derivative traders are keen on opening new positions. It could also indicate that these traders are looking to capitalize on the short-term price movements as speculative interest grows.
Read Ethereum’s [ETH] Price Prediction 2025–2026
Rising leverage could also stir volatile price movements if there are forced liquidations due to unexpected price movements.
However, despite the rising speculative interest, the demand for long positions has decreased as seen in funding rates. This indicates that the bullish sentiment has cooled.


