How macro trends are shaping BNB’s price movements today

- Binance Coin saw significant retracement in its recent price action, coinciding with Bitcoin’s ongoing market correction
- As BNB approached the $733.42 resistance, volume spikes indicated heightened selling pressure
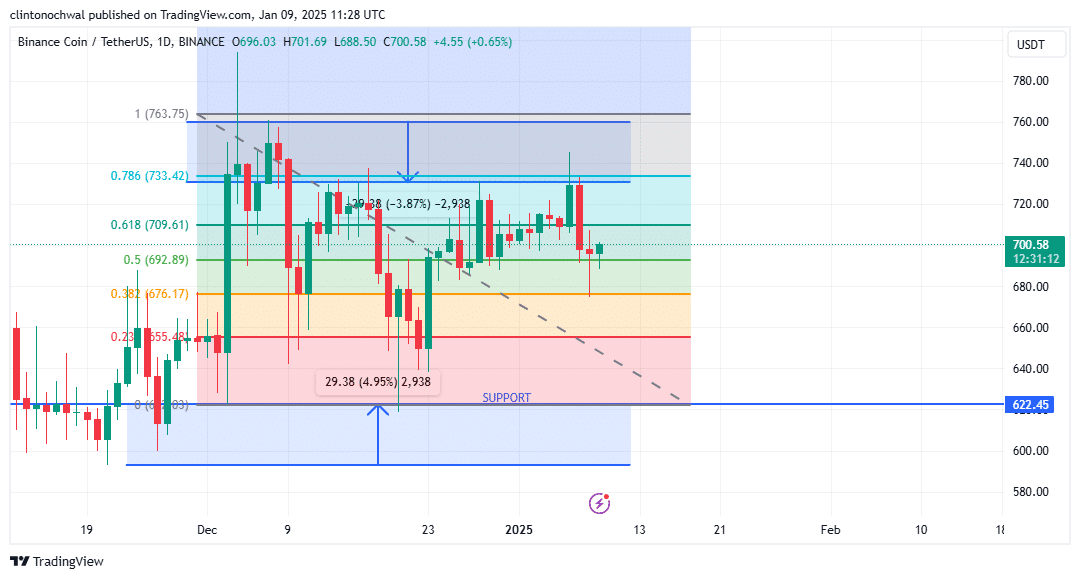
Binance Coin (BNB) has seen significant retracement in its recent price action, with the same coinciding with Bitcoin’s ongoing market correction. Traders have been closely monitoring key levels on the daily timeframe, as BNB’s rejection at the Fibonacci Twice Area hinted at potential opportunities for strategic entries.
Fibonacci retracement levels
Fibonacci retracement levels give us vital insights into BNB’s price movements, acting as benchmarks for potential reversals and continuations. According to BNB’s price chart, for instance, the 0.618-level at $709.61, the 0.5-level at $692.89, and the 0.382-level at $676.17 have emerged as pivotal support zones.
BNB recently failed to maintain momentum above the 0.786-level at $733.42, highlighting waning bullish pressure. This rejection triggered a retracement towards the 0.5-level, where consolidation pointed to a temporary pause in bearish momentum.
Historically, the 0.618-level has acted as a strong support in bullish setups. If BNB retraces to $709.61 and forms a bounce, it may signal renewed buying interest.
The 0.5-level at $692.89 is particularly significant due to its proximity to the press time price. Holding above this level could indicate consolidation before a potential upward breakout.
Conversely, a breach below the 0.382-level at $676.17 may pave the way for deeper corrections towards the critical support zone at $607.16.
Given the Fibonacci analysis, traders should watch for bullish candlestick patterns or volume spikes near these levels to confirm potential reversals. If BNB regains momentum and climbs back towards the 0.786-level at $733.42, it could target the $763.75 resistance, aligning with the 1.0 Fibonacci extension.
Support and resistance zones
Support and resistance zones remain essential metrics for assessing BNB’s potential price trajectory. At the time of writing, the $607.16 support zone stood out as a crucial level for potential accumulation. Historically, BNB has seen strong buying interest in this area, making it a focal point for traders anticipating a rebound.
In addition to the $607.16-level, the $572.85 zone seemed to offer further downside protection. A drop to this level may attract long-term buyers seeking to capitalize on discounted prices. On the upside, resistance at $733.42 aligned with the 0.786 Fibonacci level, serving as a barrier to further bullish progress. Beyond this, the $763.75 target seemed to represent a significant milestone, offering traders a potential profit-taking opportunity.
BNB’s price movement within these zones will largely depend on external factors, such as Bitcoin’s performance and macroeconomic developments..
Volume metrics
Recent price movements in BNB have been accompanied by fluctuating volume levels, revealing valuable insights into market sentiment.
As BNB approached the $733.42 resistance, volume spikes indicated heightened selling pressure, ultimately resulting in a rejection. Conversely, as the price retraced towards $692.89, volume levels began to stabilize – A sign of reduced selling intensity.
Therefore, a surge in volume at trends $607.16 support zone may indicate accumulation by long-term investors, signaling a potential price reversal.
Additionally, a lack of volume near critical support zones could suggest weak buying interest, increasing the risk of further declines. On the upside, a breakout above $733.42 with accompanying volume spikes would confirm bullish momentum, paving the way for a rally towards $763.75.
Combining Fibonacci retracement levels, support and resistance zones, and volume metrics, can help develop a comprehensive strategy for navigating BNB’s evolving market landscape. As always, external factors and market sentiment should be factored into decision-making to maximize trading success.


