Shiba Inu traders can eye THIS key level as the NEXT buying opportunity!
Liquidation heatmap and the 4-hour chart revealed that SHIB is likely to consolidate within a range in the near-term.

- Shiba Inu enjoyed a bearish structure on the daily timeframe
- Lack of buying pressure and the build-up of liquidation levels meant memecoin could stay within the range this week
Shiba Inu [SHIB] appeared to make a bullish structure break on the 4-hour chart ten days ago. However, this break has faltered since, and the price has retested its local lows twice. In its place, a lower timeframe range formation has materialized, mirroring Bitcoin’s [BTC] lack of direction on the charts.
Shiba Inu set to consolidate within range
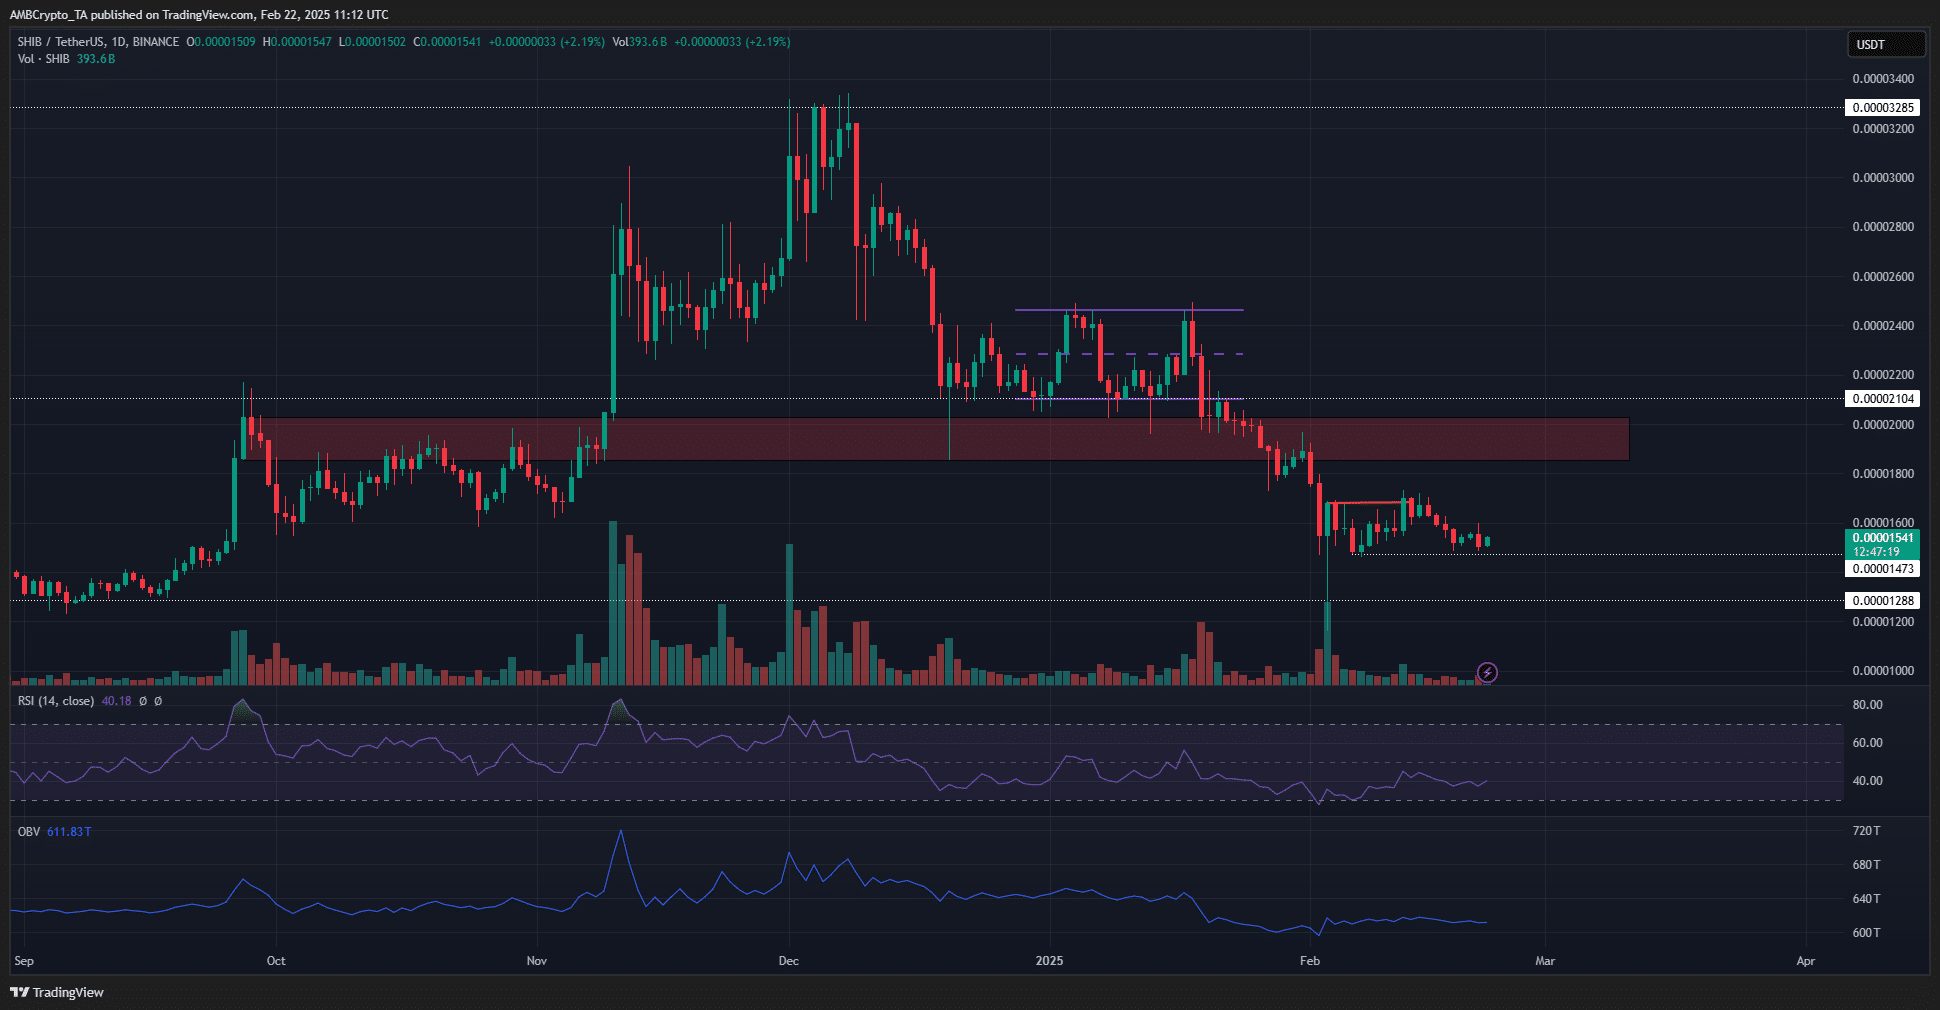
The 1-day chart revealed that the swing structure was firmly bearish. A price move beyond the recent lower high at $0.0000196 would be needed to shift the structure. As things stand, there seemed to be no evidence that such a move would soon appear.
A local support zone was established at $0.0000147 too. Further south, the $0.0000128-level has been a significant support level from September 2024.
At press time, the daily RSI remained bearish with a reading of 40. The OBV climbed higher after its early February losses, signaling some buying pressure. And yet, this was not enough to force the memecoin to register new highs.
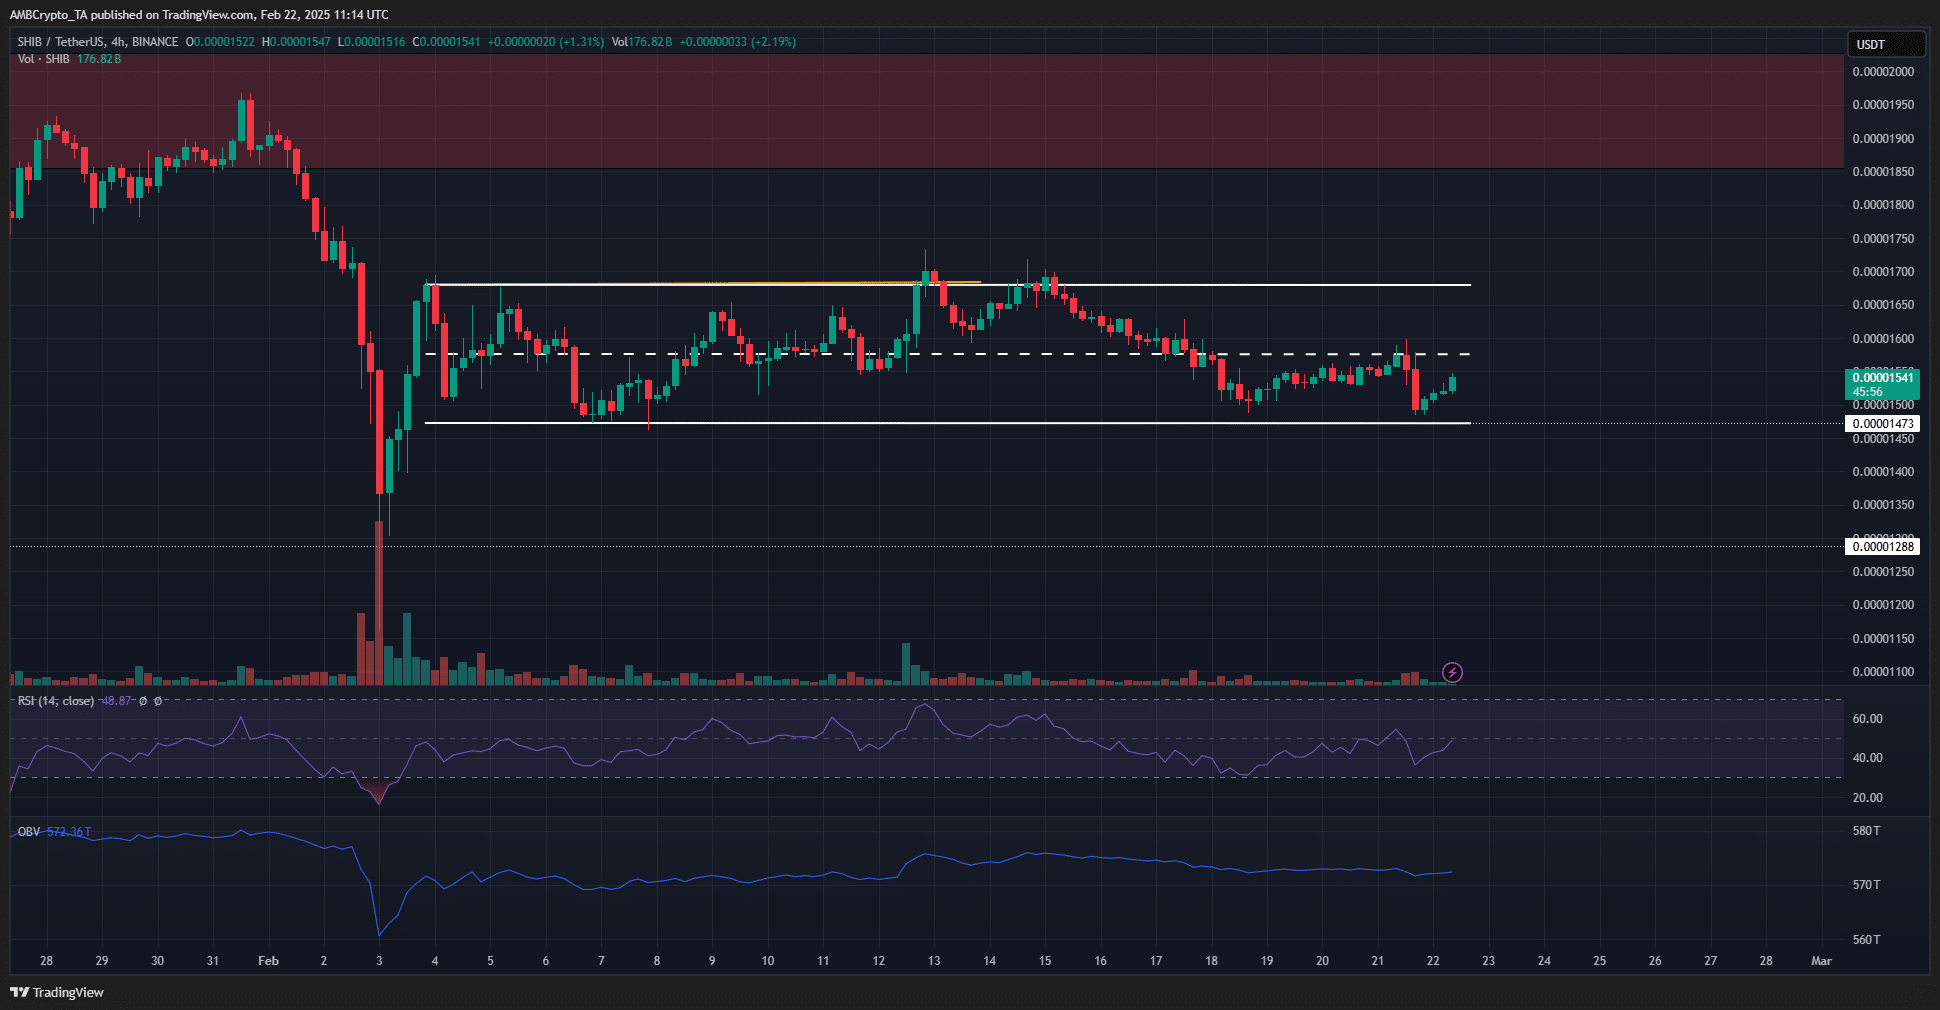
The range formation was evident on the 4-hour timeframe. What appeared to be a structure break (orange) on the H4 turned out to mark the local highs at $0.000017. The mid-range level at $0.0000157 seemed to emerge as a key short-term resistance too.
Also, the RSI was bearish on the 4-hour chart. In fact, it has remained below 50 over the past week. A move above 50, alongside a flip of the mid-range resistance to support, could allow traders to go long – Targeting the $0.0000168 local resistance.
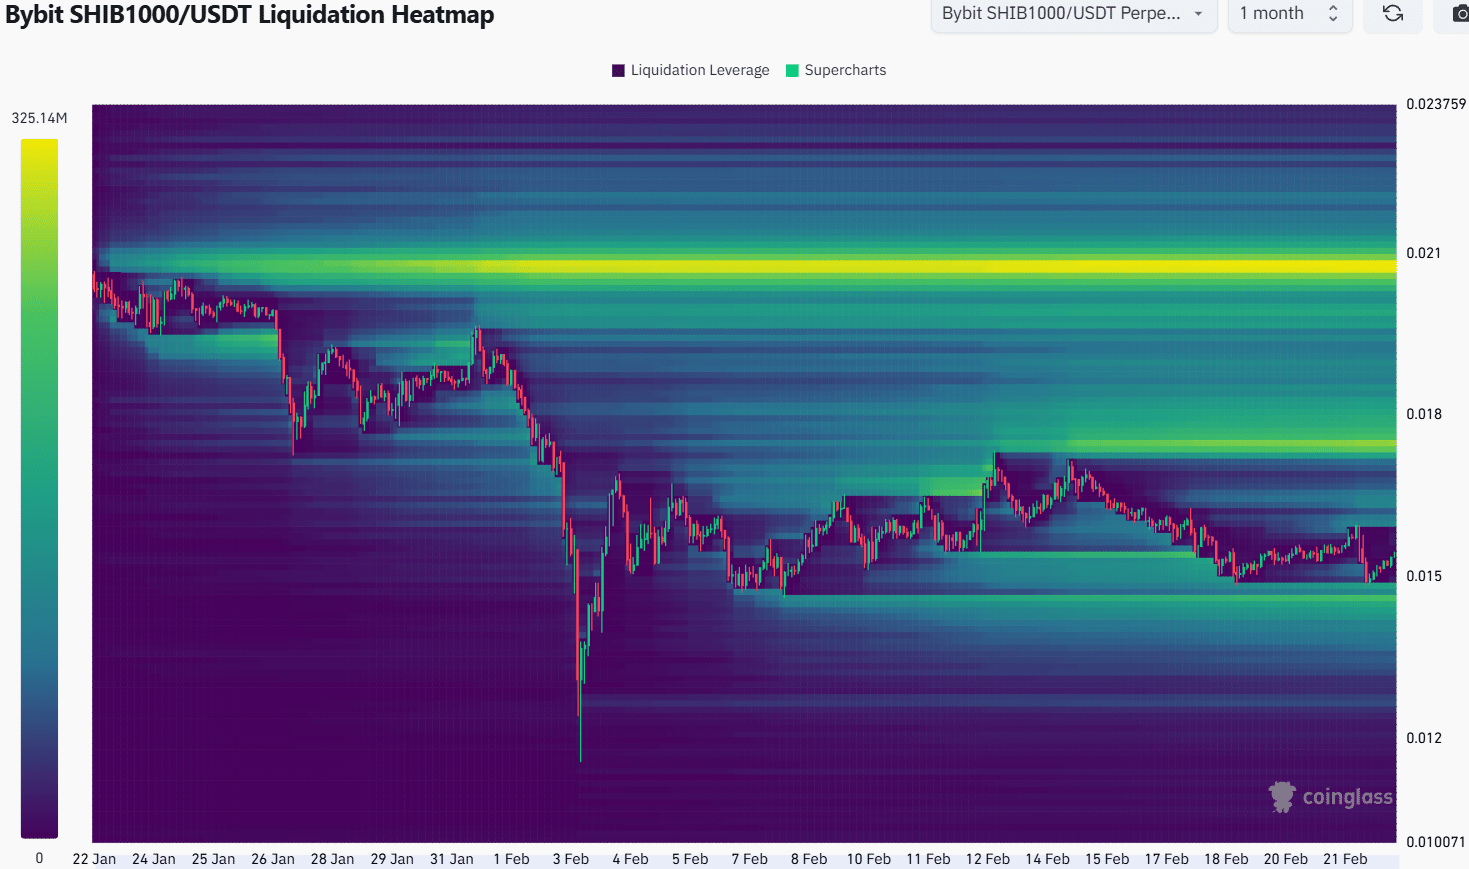
The liquidation heatmap of the past month underlined the range formation. It revealed two liquidity clusters around $0.0000145 and $0.0000176, levels just beyond the range extremes marked on the 4-hour chart.
The build-up of liquidation levels around these prices implied that the price is likely to gravitate towards one, then the other, over the coming days. Hence, a retest of $0.0000145 would be a buying opportunity, and the $0.0000175-level a take-profit target.
Disclaimer: The information presented does not constitute financial, investment, trading, or other types of advice and is solely the writer’s opinion


