Why Sonic can see more gains despite a dip below $0.8
The trading volume has been high in recent days as Sonic prices jumped beyond the $0.6 resistance level.

- Sonic saw a 46% volume drop on the day as prices retraced from $0.99.
- The retest of $0.8 and $0.73 as support should likely be followed by another price move higher.
Sonic [S] (prev. FTM) has shown bullish strength over the past two weeks. It has reversed its early February losses and was pushing toward $1.
At press time, the $0.8 level was being retested as support. It was likely that the bulls would defend this level. The momentum and the volume signaled it was a buyer’s market.
Sonic is set to continue the uptrend
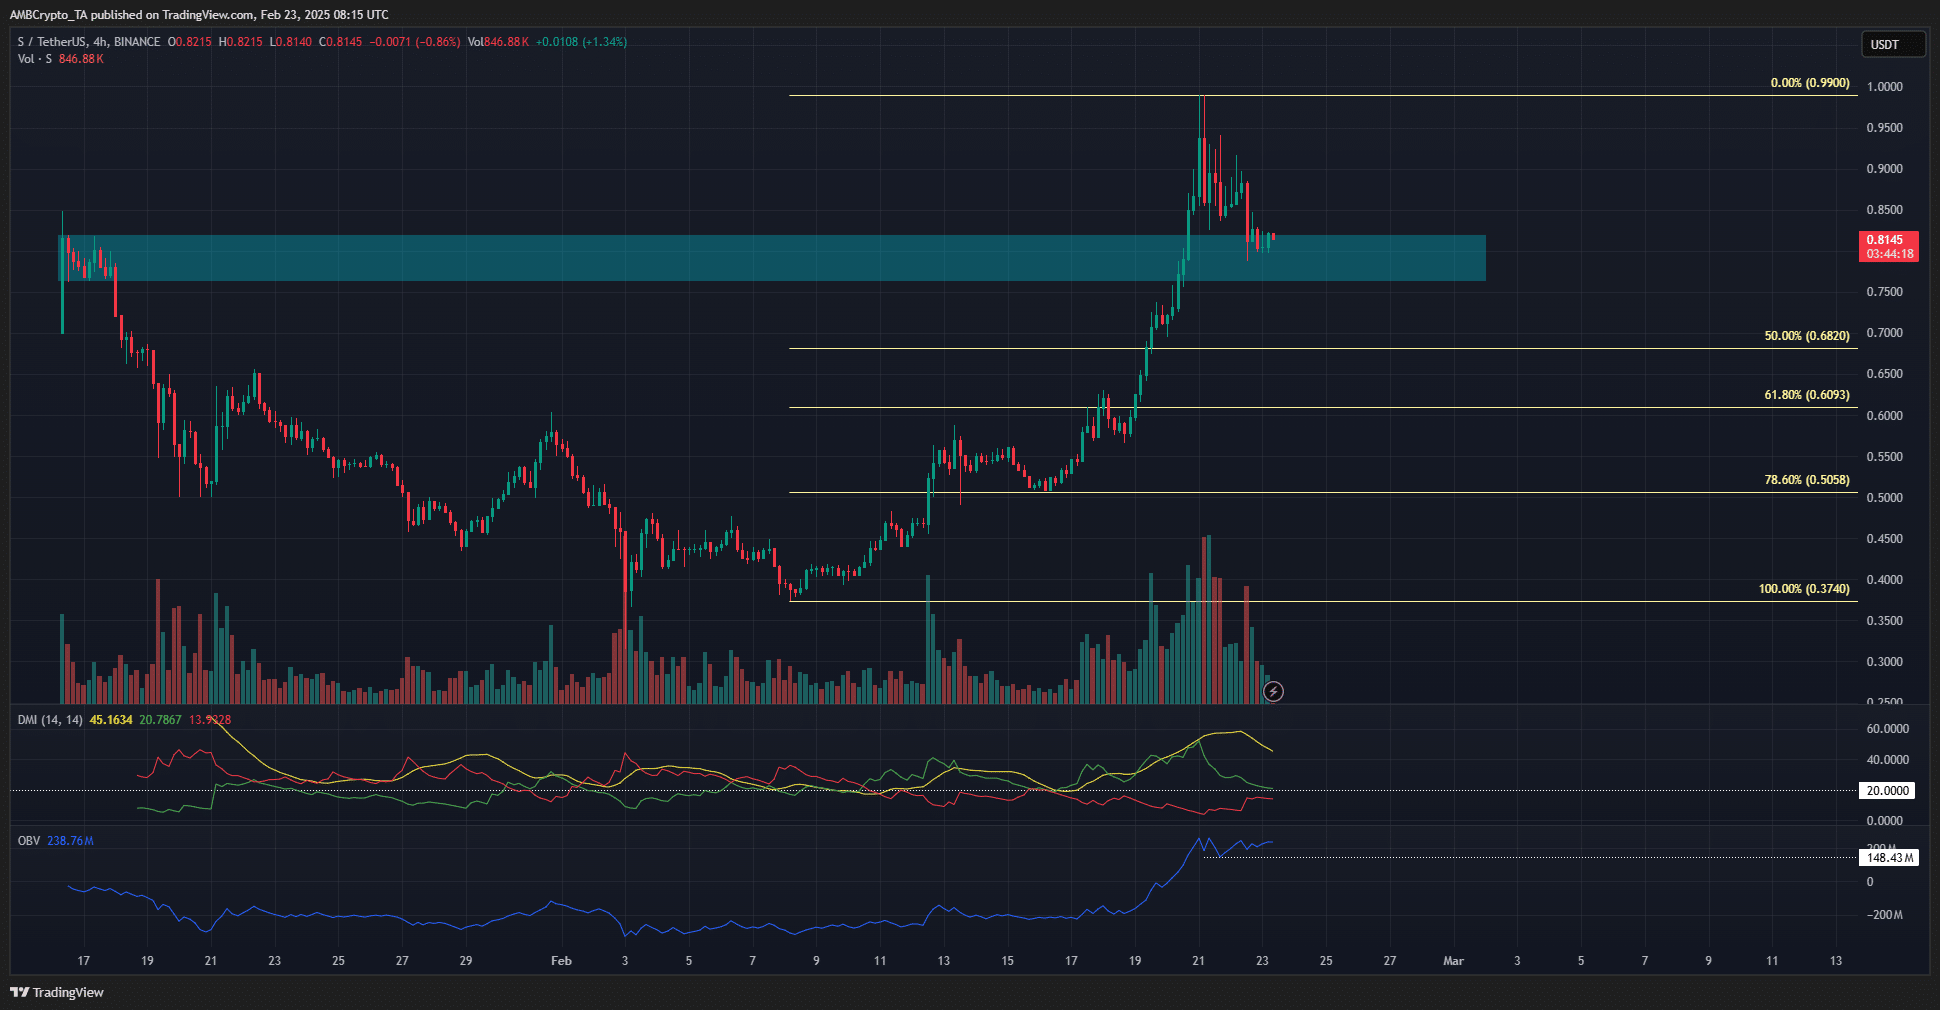
The 4-hour chart of S showed that the uptrend was going strong. The price has formed a series of higher highs and higher lows since breaking above the $0.6 resistance level.
This resistance had been the lower high that saw the price plummet to the $0.315 low during the early February sell-off.
The upward price move over the past three weeks has been borne by strong buying pressure. The volume bars showed exceptional buying volume, especially over the past week.
This came alongside an S breakout beyond the $0.8 resistance.
The DMI of Sonic agreed with the finding from the price action. The +DI and ADX lines were both above 20, showing a significant uptrend in progress.
The OBV made strong gains as the volume soared in recent days, and was well above the local low marked in white.
A move below $0.75 would not flip the bullish market structure, but it could weaken the momentum. This could open the path for a deeper retracement toward $0.609 or $0.505.
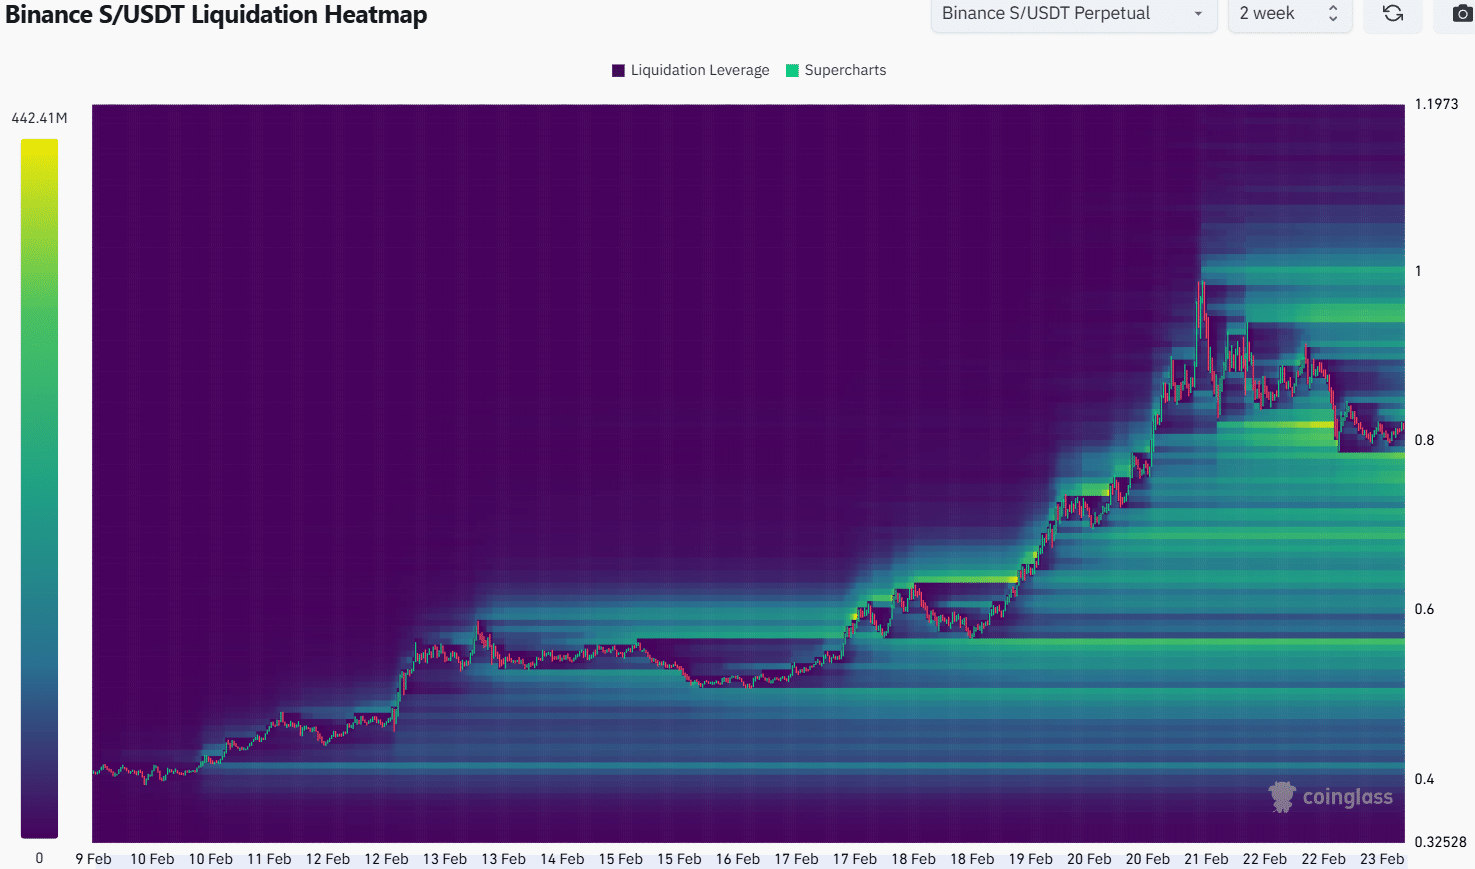
The liquidation heatmap showed sizeable liquidity below $0.8 and around $$0.95-$1. These are the price targets over the coming days. A move to $0.739 would sweep the liquidity to the south.
The forced long liquidations could be quickly reversed, as the bulls retain control of the market in the near term.
Hence, S traders should be wary of a price drop below $0.8, but it would not be a signal to go short. The $0.71-$073 is expected to serve as a lower timeframe demand zone.
Above $1, the $1.4 level is expected to be the next notable resistance level.
Disclaimer: The information presented does not constitute financial, investment, trading, or other types of advice and is solely the writer’s opinion