Shiba Inu: Assessing if SHIB bulls can defend $0.00001288
The 6-hour chart illuminated that SHIB was trading under a local resistance at $0.0000138, a level that rebuffed the bulls on the 16th of March.

- The Shiba Inu weekly price action laid out a strongly bearish bias.
- The lower timeframe chart highlighted two key Fibonacci retracement levels to watch.
Shiba Inu [SHIB] had fallen below a key long-term level last week but was trying to find its way back above. However, the price action in recent months meant the higher timeframe bias remained bearish.
The Bitcoin [BTC] range formation in December began the SHIB movement downward. Other events saw the bullish conviction in memecoins eroded, a trend that has not yet halted.
Shiba Inu bulls likely to have a hard time
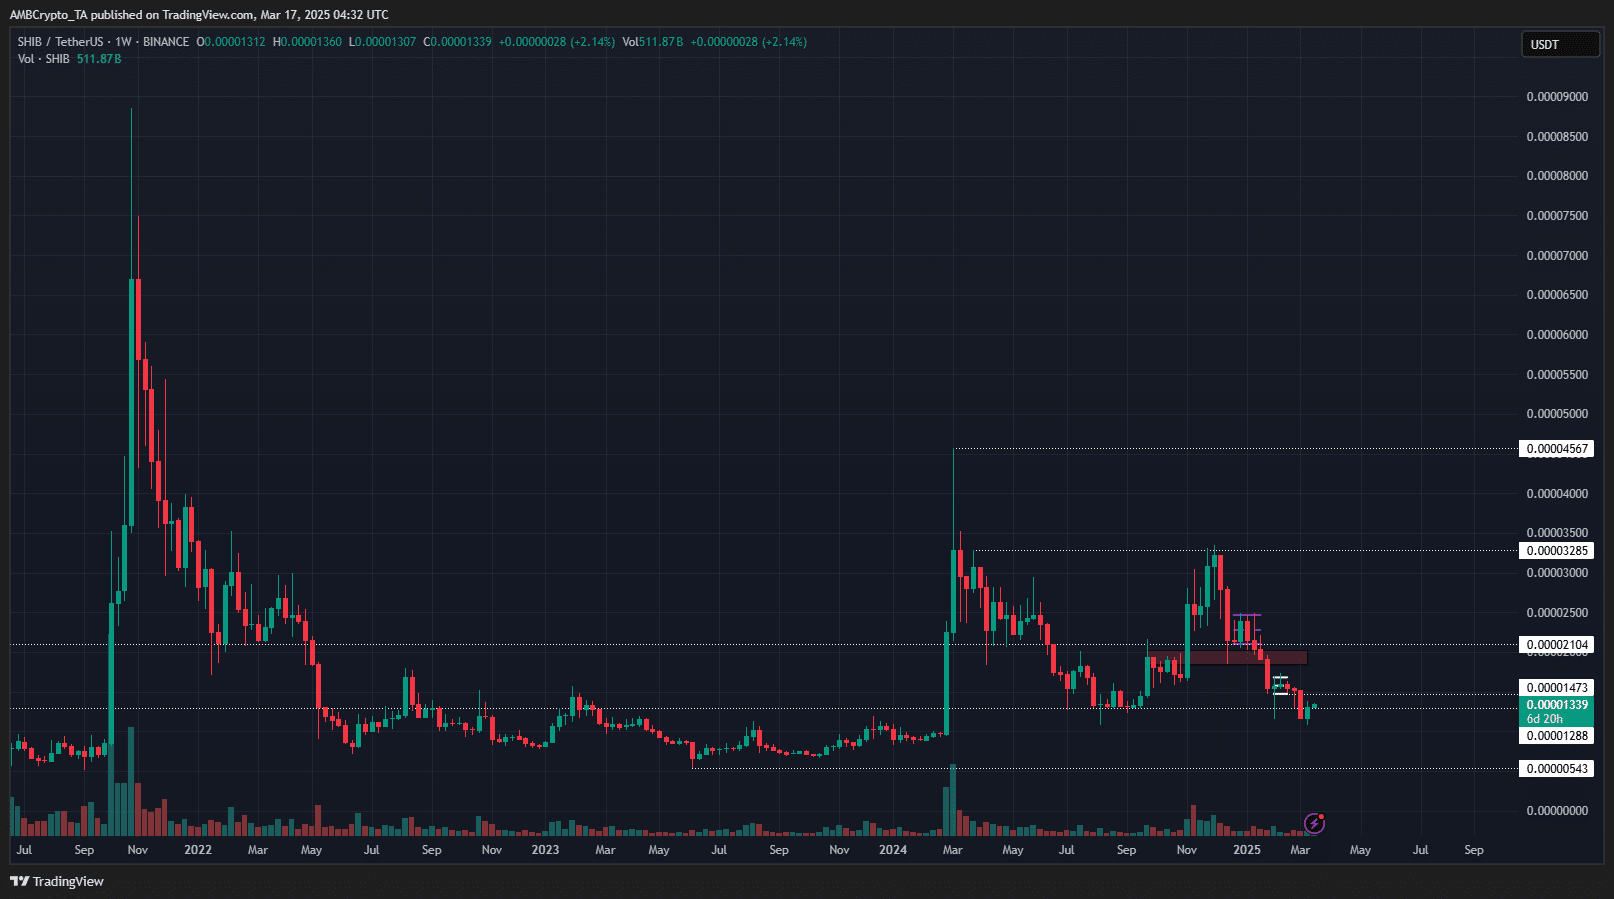
On the weekly chart, Shiba Inu has a bearish structure. It broke below the $0.0000164 level, the lower high from November, and at press time was floating just above the $0.00001288 support. It closed the first weekly session in March below this level, reinforcing the bearish outlook.
The rallies in early 2024 and November 2024 were unable to challenge the highs from late 2022. This was disappointing, as Bitcoin had a lot more capital inflow over the past year than in 2022. Hopes of capital rotation into the memecoin might have been misplaced.
A bounce from the outlined weekly support is expected. However, it wouldn’t be immediate. Like the summer of 2024, there could be a few weeks of consolidation before the next move.
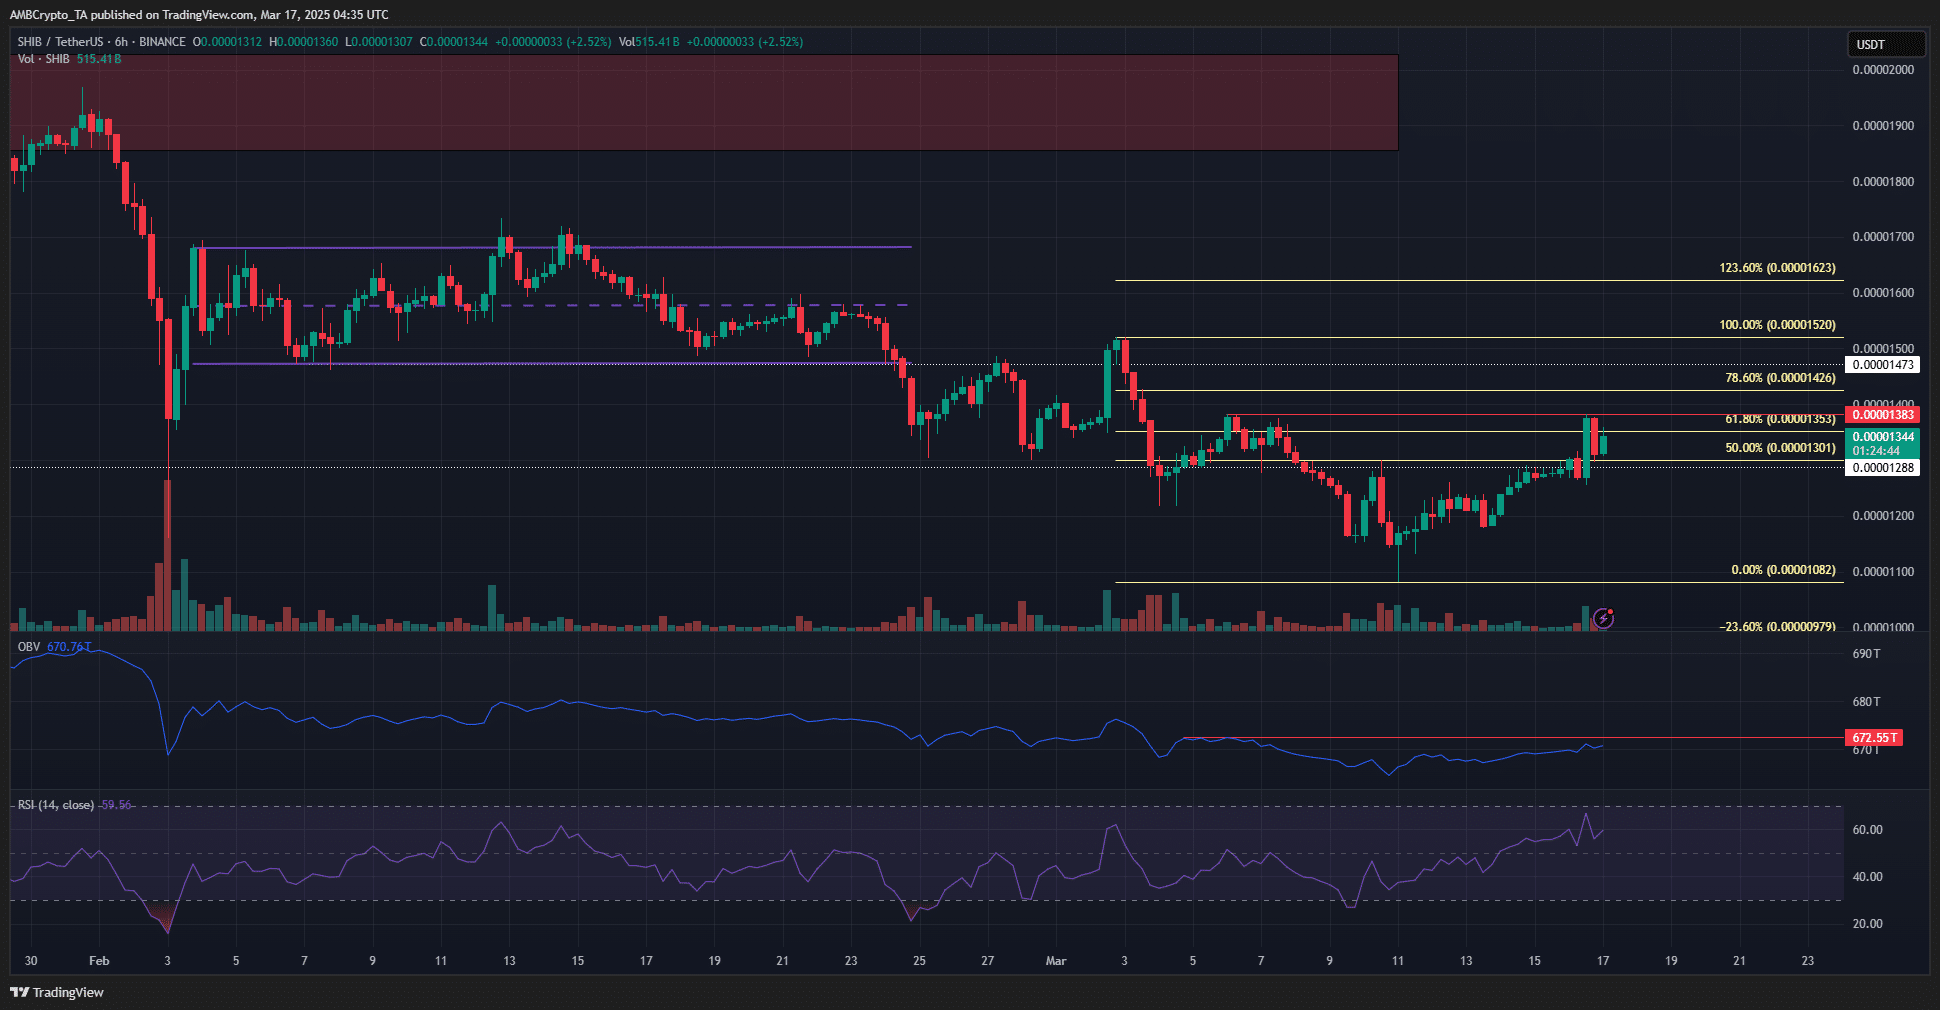
The 6-hour chart showed SHIB trading near a local resistance at $0.0000138 (red). The OBV failed to set a higher high compared to earlier this month.
Additionally, Fibonacci retracement levels identified $0.0000135 and $0.0000142 as key short-term resistance zones.
This suggests SHIB is unlikely to rise more than 6% from its current price. The RSI reflected bullish momentum following last week’s gains, but the swing structure on the 6-hour chart remained bearish.
A breakout above $0.0000127 and its retest as support fueled recent gains. Similarly, a move above $0.0000152 could drive the next leg higher. However, the weekly chart does not indicate such a breakout is imminent.
Disclaimer: The information presented does not constitute financial, investment, trading, or other types of advice and is solely the writer’s opinion