Bitcoin holds $84K, but will THIS trigger a wave of liquidations?
Bitcoin teeters above a pressure point. Could $84K be the trapdoor no one sees coming?

- Falling Bitcoin Net Delta suggests buyer momentum weakened despite aggressive long exposure above $88,000.
- Realized Price continues rising, but MVRV Z-Score suggests market is cooling, not capitulating.
Bitcoin’s [BTC] recent market activity highlighted a growing risk for traders holding long positions as price action tightened near a critical level.
The $84,000 zone has become the focal point for institutional positioning and derivative buildup. If breached, it may trigger a rapid sell-off.
Warning signs on the horizon
Data from Alphractal show rising Open Interest and increasing inflows into exchanges, pointing to elevated liquidation risk.
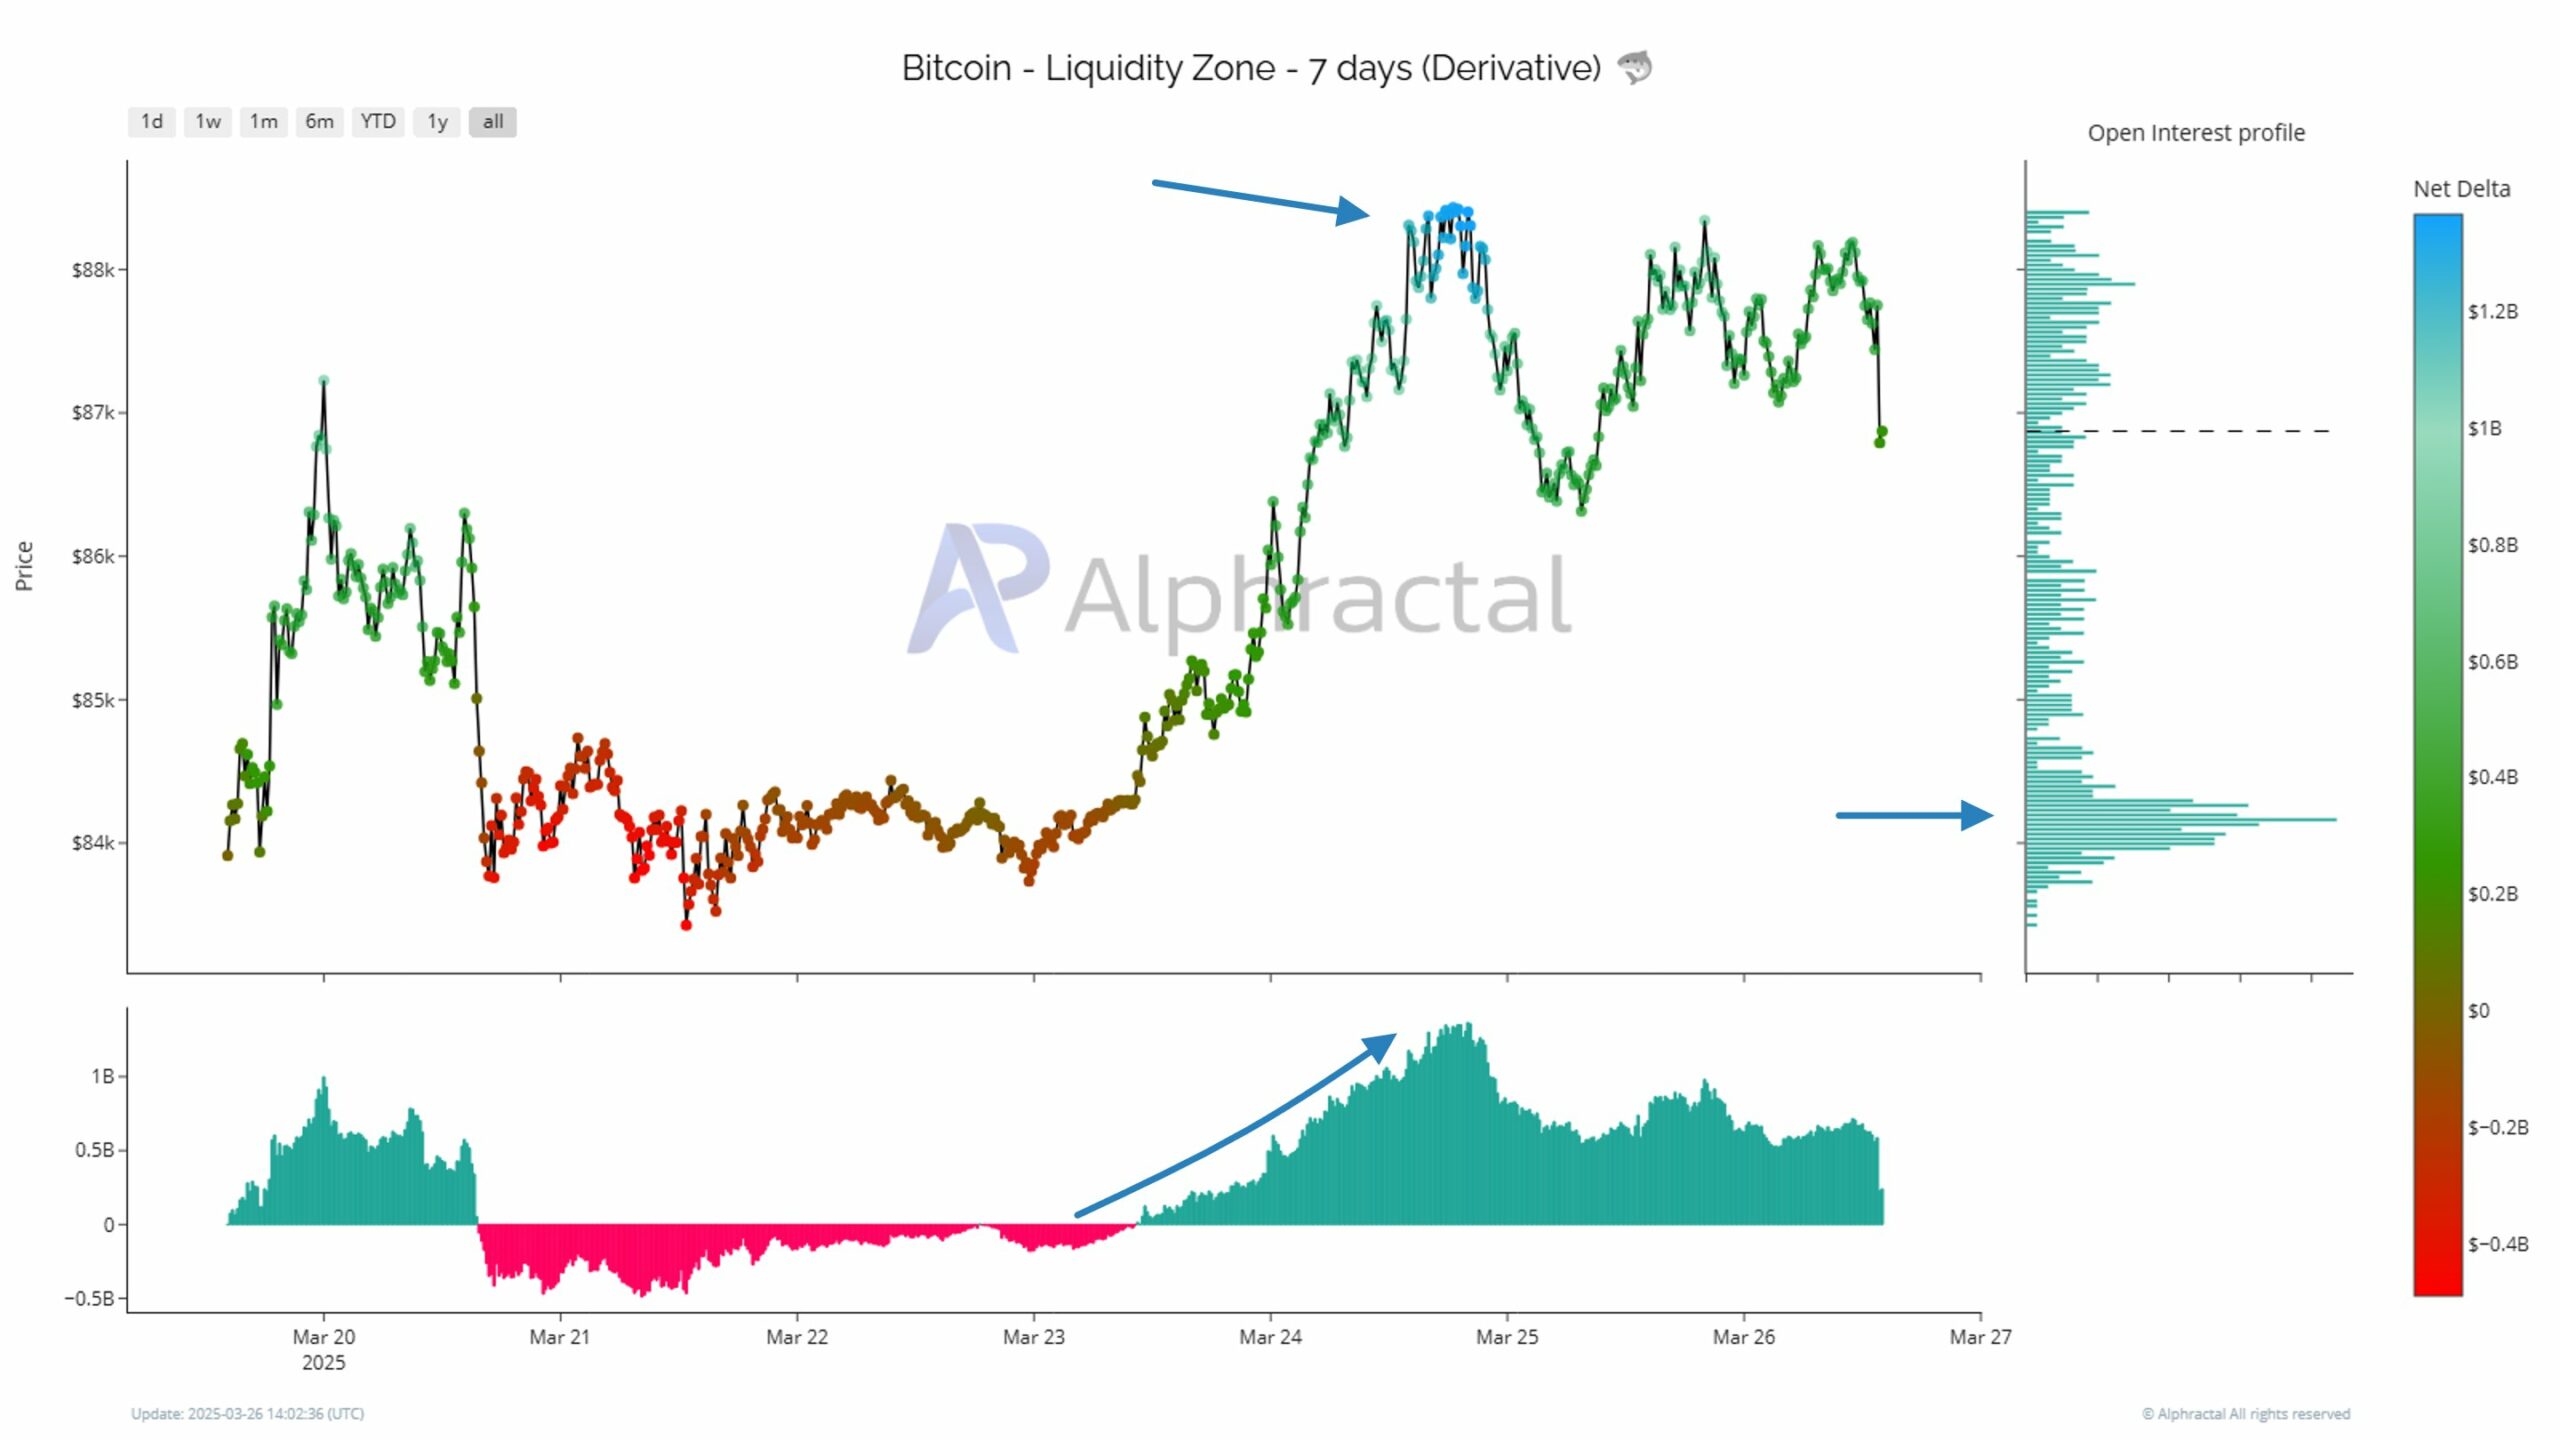
As illustrated in the chart, we can see how Bitcoin’s price rose above $88,000 before stalling.
Many traders entered long positions during this move, expecting continuation. The Open Interest profile shows a buildup of leveraged positions near that price.
Buyers showed up—but then backed off
As prices slowed above $88K, Net Delta began falling. This hints at buyers losing control despite continued long exposure.
If price reverses sharply, the $84,000 zone will become a battlefield. Traders who entered longs above $88K could face liquidation if prices fall below this level.
The $84K level holds the highest concentration of contracts, making it a prime liquidity zone.
This zone functions as both a technical support and a potential liquidation trigger. If prices dip below it, market makers may accelerate the move by exploiting trapped longs.
That breakdown could result in a wave of forced selling.
These events happen when leveraged long positions hit stop losses or liquidation thresholds. Such activity often benefits traders holding short positions, especially if entered at higher levels.
Selling signals are creeping in
Complementing the structural risk is data from CryptoQuant, which shows a rise in Bitcoin transferred to exchanges in March. These inflows historically signal intent to sell.
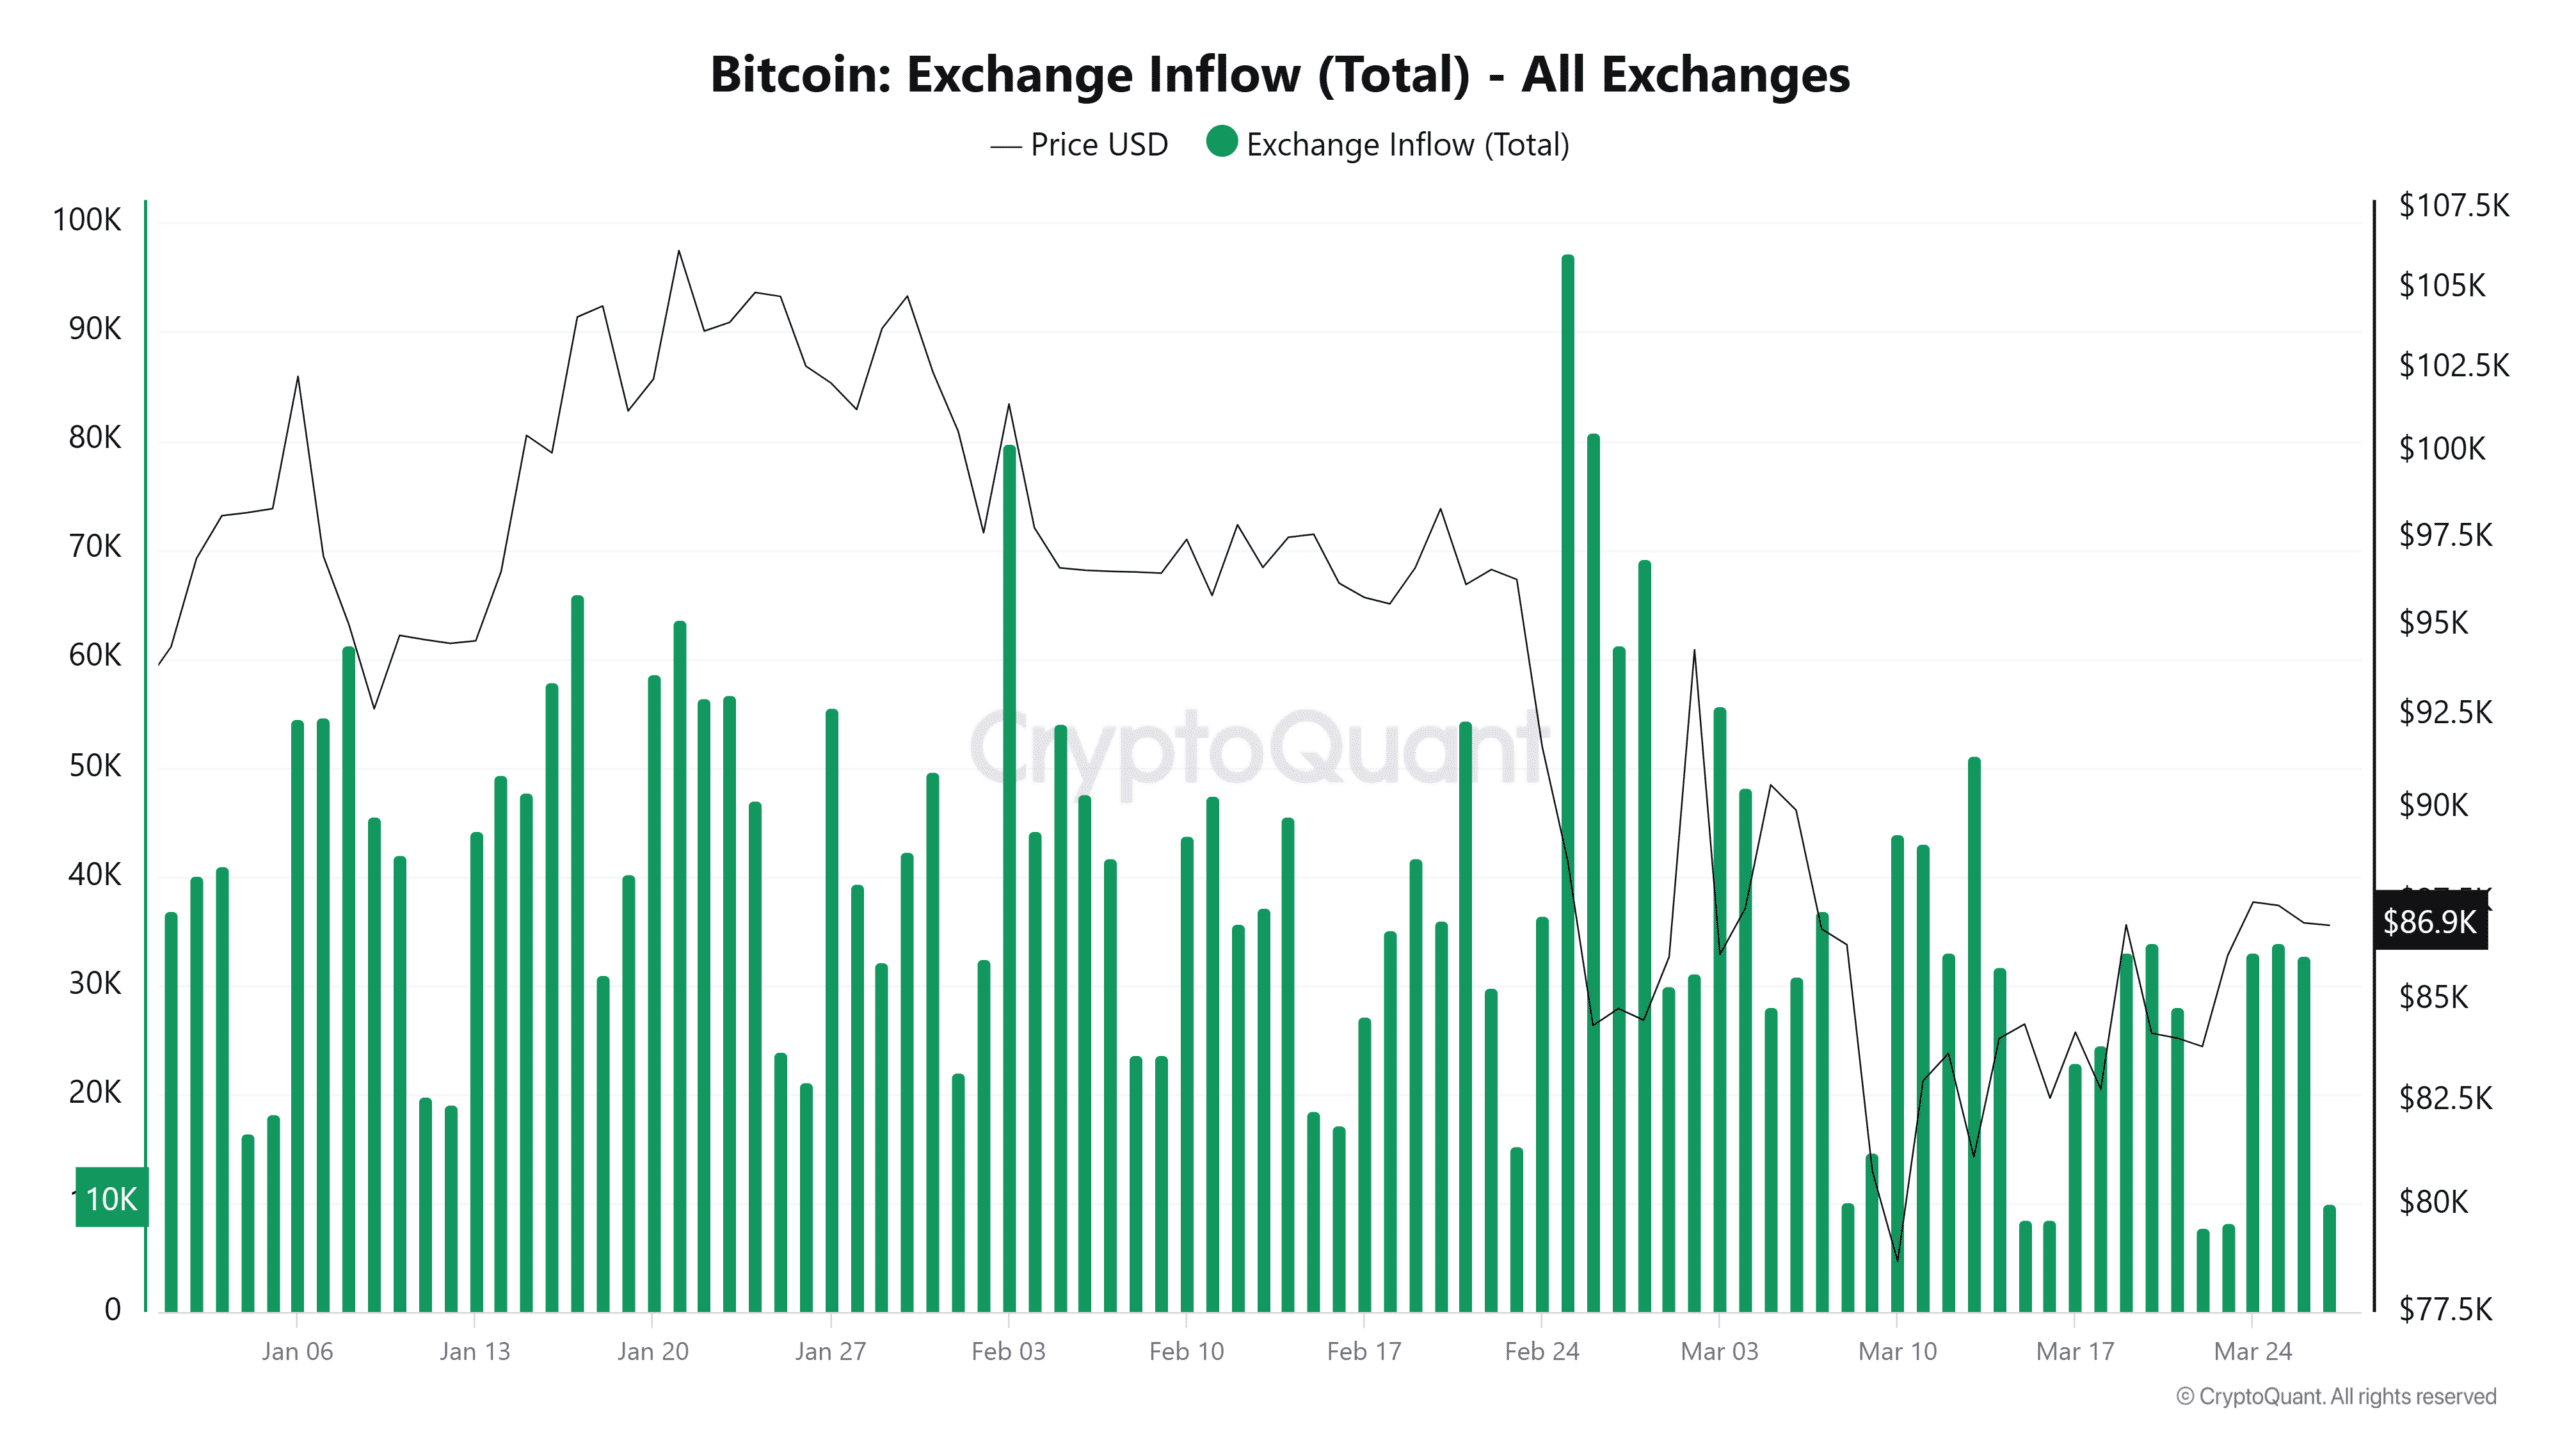
Between January and March 2025, price moved from a high of $105,000 to $86,911. In that time, major inflow spikes occurred on days with increased volatility.
For example, the 3rd of March saw 31,152 BTC transferred to exchanges when Bitcoin was priced at $84,311. This reinforces the significance of the $84K zone.
By the 27th of March, inflows dropped to 10,053 BTC. While lower, this signals hesitation rather than renewed optimism. A failure to break higher could trigger fresh inflows.
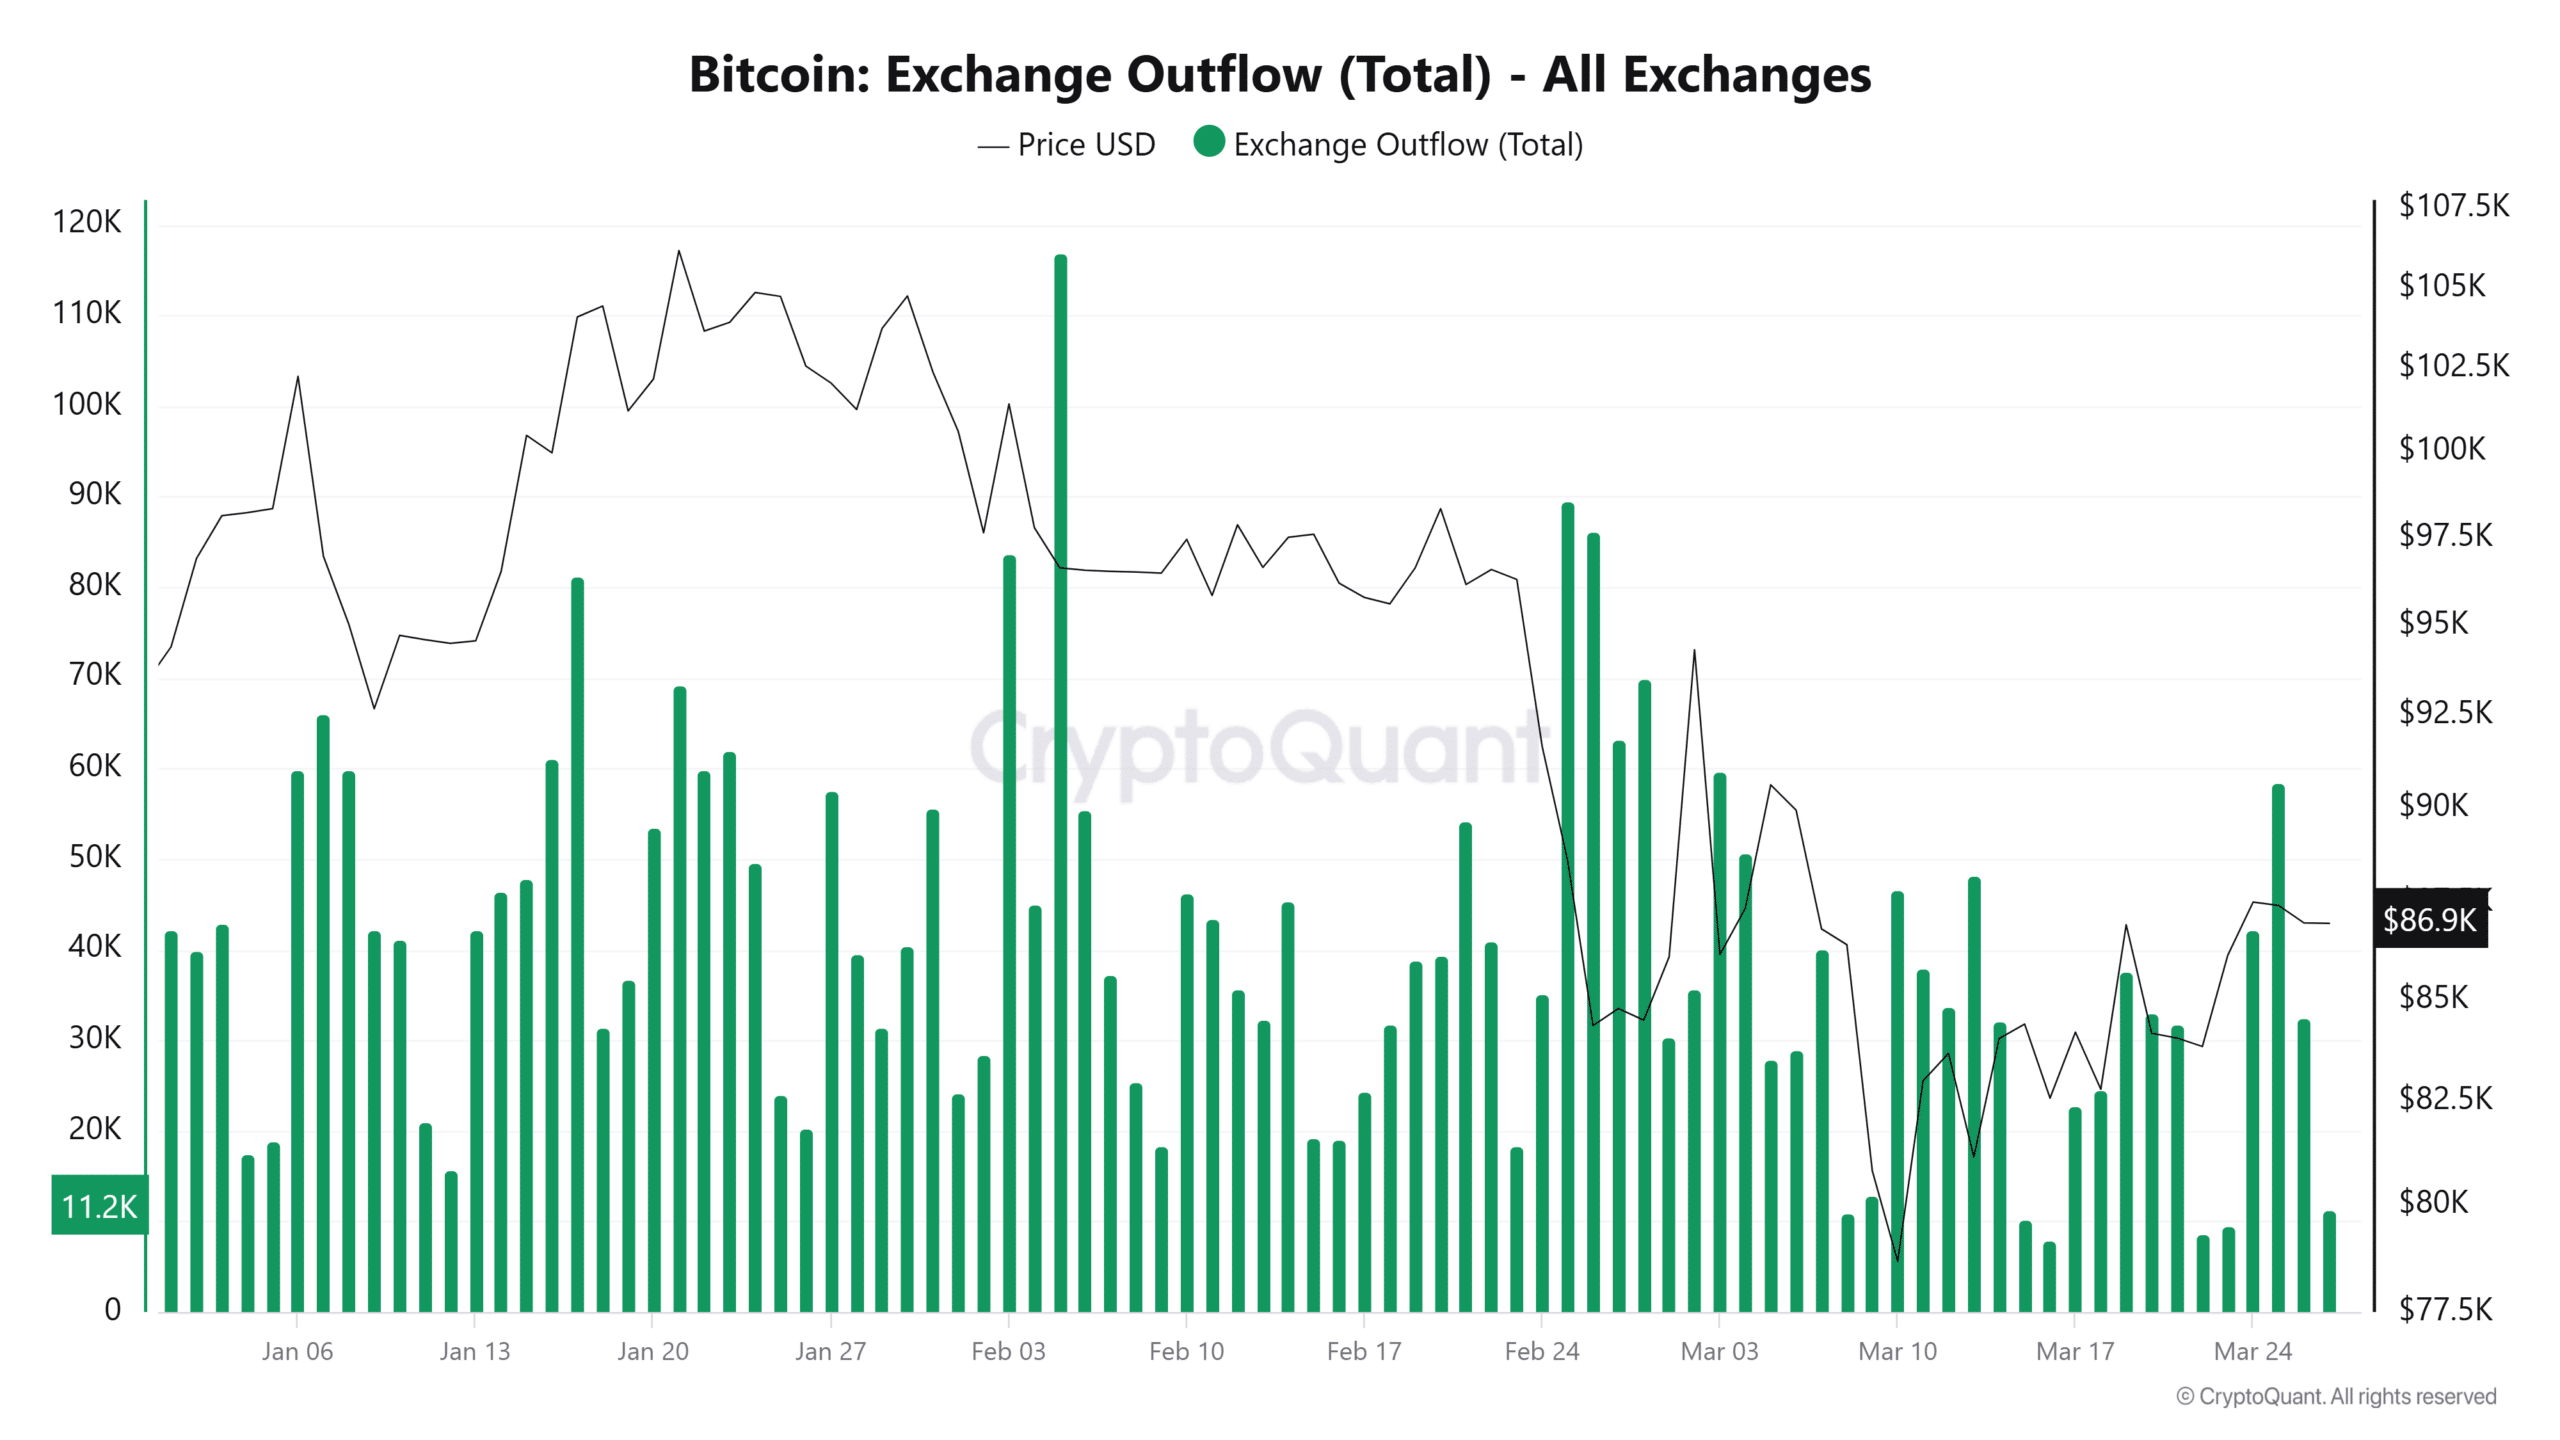
Meanwhile, outflows declined from 86,230 BTC in February to 10,186 BTC by the 27th of March. This suggests reduced accumulation and growing caution.
With long-term holders pulling back, bullish support may be weakening.
Bitcoin HODLers hit the brakes
Charts from Glassnode show Bitcoin’s Realized Price increased steadily from $33,149 in November 2024 to $43,696 in March 2025.
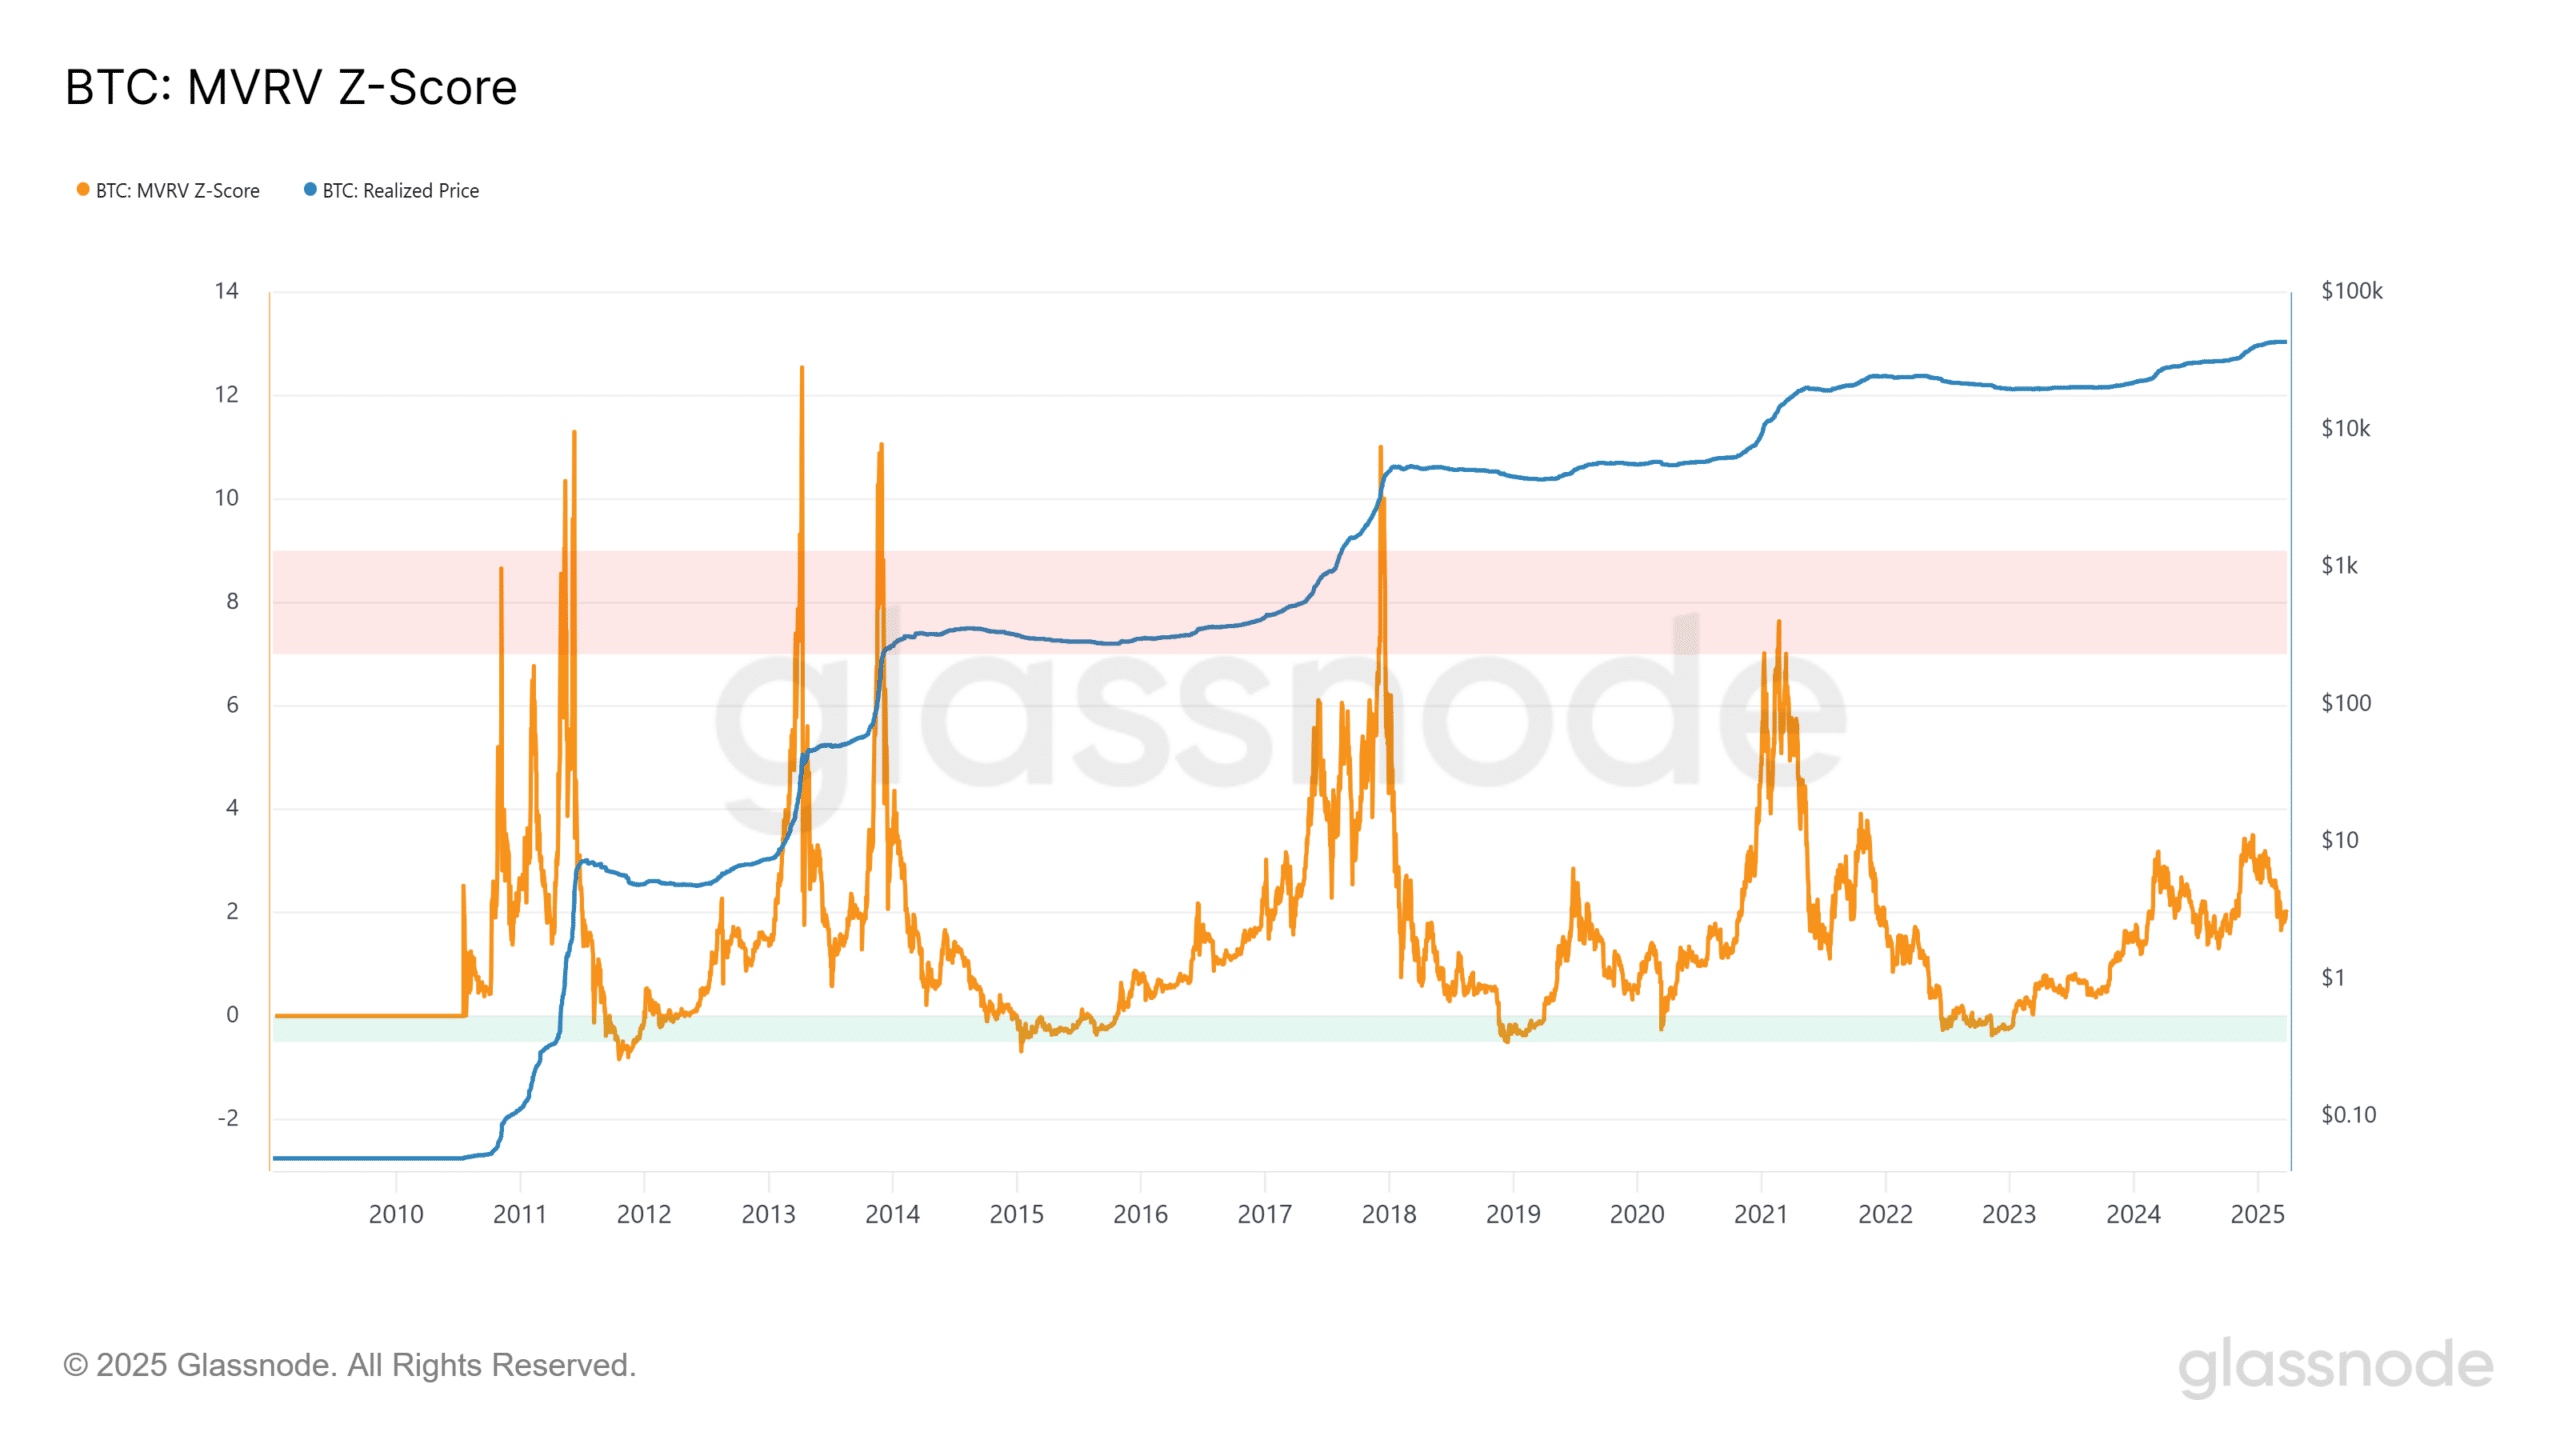
However, the MVRV Z-Score fell from 3.42 to 1.99 during the same period. The divergence suggests reduced speculative excess, not full capitulation. Historically, scores above 5 mark tops; 2 implies mild overvaluation.
This is the line—who blinks first?
Bitcoin trades near $86,000, holding above the $84,000 support. Exchange data shows cautious accumulation, while derivatives reflect heavy long exposure.
On-chain indicators point to weakening momentum. A break below $84,000 could trigger liquidations. Shorts above $88,000 may benefit.
But a strong defense could maintain the bullish structure of higher lows. Markets now eye this zone for the next major move.