Pudgy Penguins [PENGU] is one of the most recognizable NFT-native brands in the Web3 space, originally launched on Ethereum in 2021 before evolving into a broader ecosystem that bridges NFTs, physical products, and blockchain infrastructure.

In late 2024, the project transitioned to a new strategy with the launch of the PENGU token on the Solana blockchain, paving the way for the project to go beyond collectibles and evolve into a scalable ecosystem. This shift aligns with the overall evolution of NFT projects moving towards becoming fully-fledged platforms that integrate community participation with tokenized economies.

The PENGU token operates within a multi-chain framework, leveraging Solana for high-speed and low-cost transactions while maintaining compatibility with Ethereum-based ecosystems. The double functionality enables both Pudgy Penguins to get accessibility in retail and have access to already existing liquidity pools. 

The design of the token focuses on community distribution, with about 50% of the total circulating supply dedicated to community growth programs such as airdrops and incentives for the community. The project has a maximum supply of 88.88 billion tokens, with an estimated circulating supply of around 62.86 billion tokens, a relatively high float, a key factor affecting liquidity dynamics and price behavior.

About 26% of the tokens allocated have been given to NFT owners of collections like Pudgy Penguins, Lil Pudgys, and Pudgy Rods. This will create a stronger bond among NFT holders and incentivize participation in the token.

In addition, insider allocations (about 29% of supply) have a scheduled vesting period, consisting of one year cliff and a subsequent three-year linear unlock. This mechanism helps defuse the immediate selling pressure and adds some predictability of volume increases over time.

Pudgy Penguins has taken a bold step to diversify its growth by venturing into the mainstream consumer market, beyond the realm of digital assets. The brand’s relationships with big market players like Walmart and Target have given it access to physical markets, fostering a dynamic between real-world usage and on-chain interactions. 

The project’s ongoing goals to incorporate blockchain assets into daily financial transactions are further underlined by the launch of new products like the Visa Pudgy Card. The progress made by these developments puts PENGU in a new light, not only as a speculative token but as a utility layer in a larger consumer-centric ecosystem.

The token had a turbulent start after it went on sale in December 2024, peaking at its fully diluted valuation (FTV) of about $6 billion, only to correct following a period of sell pressure from airdrop activity and market conditions.

Interest reawakened by mid-2025, with emerging institutional narratives and greater visibility on major exchanges, particularly around the ETFs. However, subsequent corrections in late 2025 reflected the cyclical nature of speculative assets, particularly those tied to NFT ecosystems.

On-chain and ecosystem activity have remained strong, despite these fluctuations.

Significant achievements have been the mobile game Pudgy Party, which has been downloaded by over 50,000 users, and the increasing volume of derivatives trading, with futures open interest standing at billions of tokens in the height of trading. 

The ecosystem has now started to stabilize, with less volatility now and concentrations around long-term demand areas as of early 2026. This phase often serves as a foundation for future expansion, particularly when supported by consistent ecosystem growth and controlled token emissions.

VIEW MORE

Overview

Market Cap
$366.60M
-9.4%
Volume (24H)
$64.07M
Volume (7D)
$354.33M
-9.2%
Max Supply
88,888,888,888 PENGU
Circulating Supply
62,860,396,090 PENGU
All-Time High
$0.068447
-91.5%
All-Time Low
$0.003715
+57.2%
(above ATL)

Prediction Analysis

Current Price
$0.01
Sentiment
Bearish
50-Day SMA
$0.01
Price Prediction
$0.00
-35.20%
Fear & Greed Index
200-Day SMA
$0.01
Green Days
13 / last 30 (44.8%)
Volatility
3.18%
Moderate
14-Day RSI
50.37
Neutral

Profit Calculator

Select asset
%
%
Total Profit
$0
(0%)
Total Exit Amount
$0
Total Investment Fee
$0
Total Exit Fee
$0

Pudgy Penguins Price Prediction

Current Price
$0.01
2031
$0.00
2036
$0.00
2041
$0.00
2046
$0.00

Results are based solely on your predicted price change. They are not indicators of future performance and do not take into account different performance scenarios, historical data, or the effect of fees or other charges.

VIEW MORE

Short-Term Pudgy Penguins Price Targets

Date Prediction Change
Jul 29, 2026 $0.01 -3.87%
Jul 30, 2026 $0.01 -7.59%
Jul 31, 2026 $0.01 -11.16%
Aug 01, 2026 $0.00 -14.60%
Aug 02, 2026 $0.00 -17.90%
Aug 03, 2026 $0.00 -21.08%
Aug 04, 2026 $0.00 -24.13%

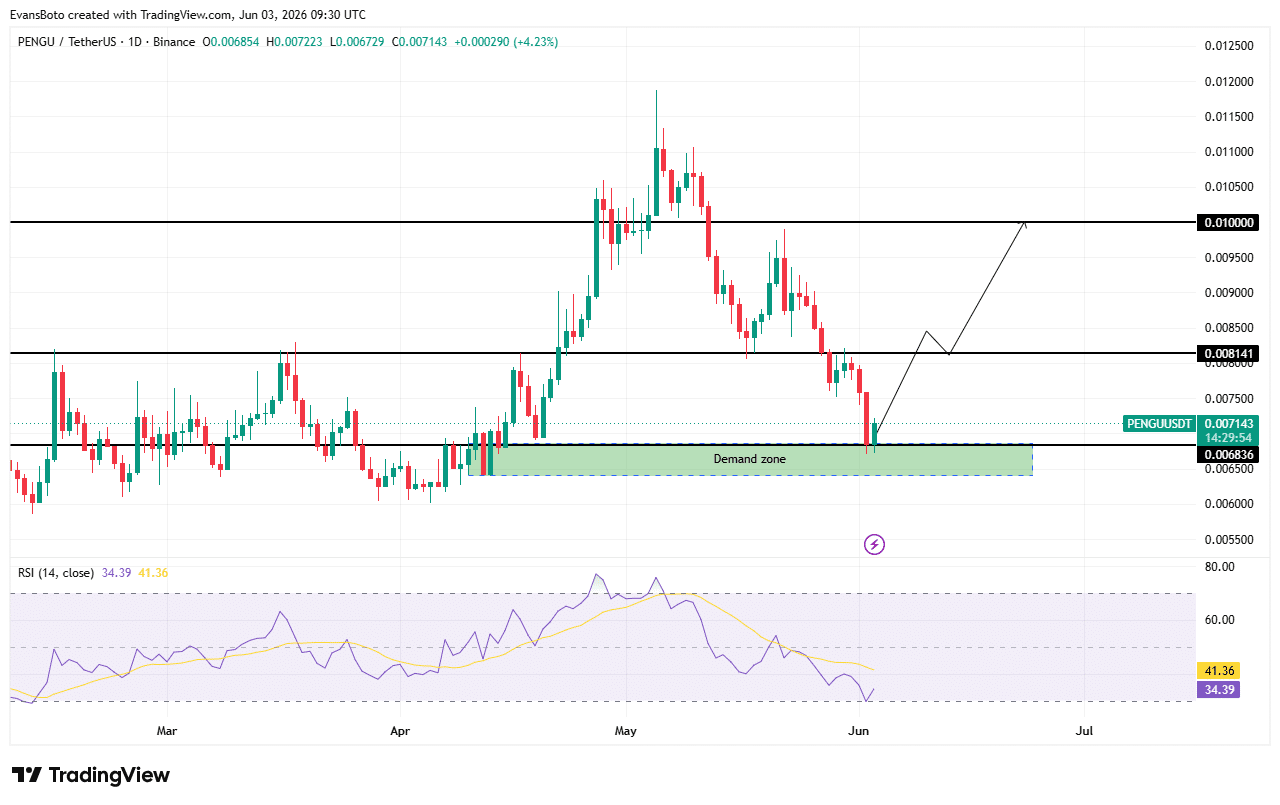
In the short term, PENGU is holding above a key demand zone near $0.007, where buyers have repeatedly stepped in to absorb selling pressure. The recent rebound, alongside an RSI recovery from oversold territory, suggests accumulation may be developing. If support continues to hold, PENGU could retest the $0.0081 resistance level. A breakout above that area may pave the way toward $0.01, the next major psychological level. On the downside, losing the current support zone would weaken the recovery structure and increase the risk of further declines. For now, the short-term outlook remains cautiously bullish, with price action favoring a recovery attempt as long as buyers maintain control of the current range.

VIEW MORE

Monthly Pudgy Penguins Price Prediction

Jun 30, 2026
$0.01
Jul 28, 2026
$0.01
Highest in Jul
$0.01
Lowest in Jul
$0.01
Overall Performance
Falling

Long-Term Pudgy Penguins Price Prediction

Month Price AVG Price Max Price Change
Jul $0.00 $0.01 $0.01 -100.00%
Aug $0.00 $0.00 $0.00 -100.00%
Sep $0.00 $0.00 $0.00 -100.00%
Oct $0.00 $0.00 $0.00 -100.00%
Nov $0.00 $0.00 $0.00 -100.00%
Dec $0.00 $0.00 $0.00 -100.00%
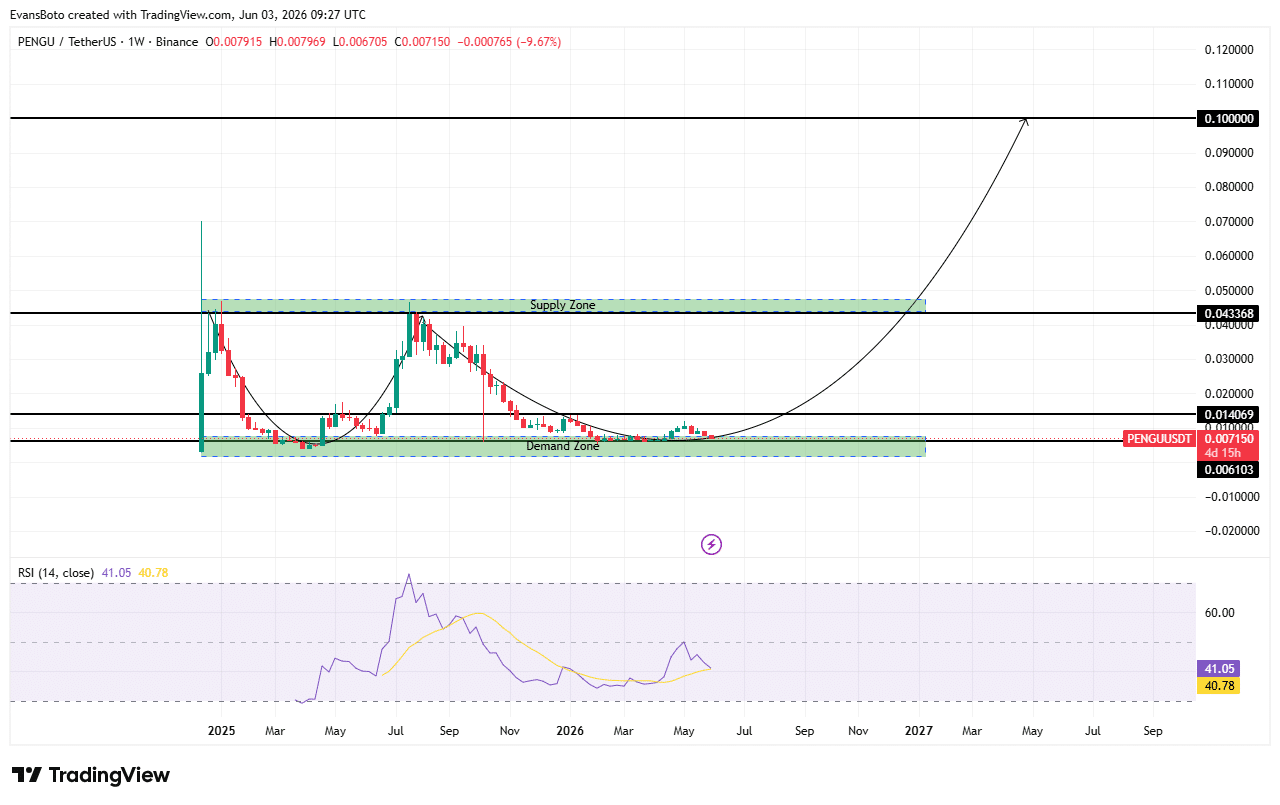
From a long-term perspective, PENGU appears to be building an accumulation base on the weekly chart. The rounding-bottom formation suggests selling pressure has eased, with buyers gradually returning to the market. The continued defense of the $0.006 to $0.007 support zone reinforces the importance of this area in the broader structure. The next major challenge lies near $0.043, where previous selling activity created a significant resistance zone. A sustained breakout above that level would strengthen the bullish outlook and signal a broader shift in market structure. If PENGU clears key resistance levels and ecosystem growth continues, the $0.10 region could emerge as a longer-term target. However, reaching that level would likely depend on wider market conditions, sustained demand, and continued expansion of the Pudgy Penguins ecosystem.
VIEW MORE

Historical Price Performance

Year Highest Price Lowest Price
2026 (to date) $0 $0
2025 $0 $0
2024 $0 $0

Since its launch in December 2024, PENGU has experienced significant volatility, initially reaching a high valuation driven by strong community demand and airdrop participation. This was followed by a sharp correction as early holders took profits, pushing the price into a prolonged downtrend throughout 2025. During this period, the token gradually formed lower highs and lower lows, reflecting declining speculative interest. However, by early 2026, price action began stabilizing within a defined demand zone, marking a shift from aggressive selling to consolidation. This phase indicates a potential transition point, where accumulation may precede the next major directional move.

VIEW MORE

Technical Analysis

On the daily chart, PENGU traded near $0.0071, holding within a demand zone between $0.0068 and $0.0071. This area has repeatedly attracted buyers, making it a key accumulation region. The latest bounce from support followed a rejection at $0.0081, which stood as the nearest resistance level.

Source: TradingView

If buyers continue defending the current range, PENGU could retest $0.0081. A break above that level may open the door toward $0.0100, a psychological and structural resistance area. Meanwhile, the daily RSI has recovered from the mid-30s, suggesting selling pressure has eased, although bullish momentum remains unconfirmed.

On the weekly timeframe, PENGU appears to be forming a rounding-bottom structure, often associated with accumulation after an extended decline. The $0.0061 to $0.0070 range continues to serve as a major support zone, while $0.0140 marks the next key resistance level.

Source: TradingView

Above that, the $0.043 supply zone remains the major hurdle for a broader trend reversal. The weekly RSI has stabilized in the low-40 range, indicating weakening bearish momentum and early signs of recovery. A sustained move above key resistance levels would strengthen the case for a longer-term advance toward the $0.10 region.

Guides

How to Read Pudgy Penguins Charts and Predict Price Movements?

Most traders use candlestick charts, as they provide more information than a simple line chart. Traders can view candlesticks that represent the price action of Pudgy Penguins with different granularity – for example, you could choose a 5-minute candlestick chart for extremely short-term price action or choose a weekly candlestick chart to identify long-term trends. 1-hour, 4-hour, and 1-day candlestick charts are among the most popular.

Let’s use a 1-hour candlestick chart as an example of how this type of price chart gives us information about opening and closing prices. The chart is divided into “candles” that give us information about Pudgy Penguins’s price action in 1-hour chunks. Each candlestick will display the asset’s opening price, closing price, as well as the highest and lowest prices reached within that period.

Pudgy Penguins Price Prediction Indicators

Moving averages are among the most popular Pudgy Penguins price prediction tools. As the name suggests, a moving average provides the average closing price over a selected time frame, which is divided into a number of periods of the same length. For example, a 12-day simple moving average is calculated by summing the closing prices over the last 12 days and dividing the result by 12.

In addition to the simple moving average (SMA), traders also use another type of moving average called the exponential moving average (EMA). The EMA gives more weight to recent prices, and therefore reacts more quickly to changes in market conditions.

What Affects the Price of Pudgy Penguins?

Just like with any other asset, the price action of Pudgy Penguins is driven by supply and demand. These dynamics can be influenced by fundamental events such as block reward halvings, hard forks, or new protocol updates. Regulations, adoption by companies and governments, cryptocurrency exchange hacks, and other real-world events can also affect market sentiment.

Technical indicators such as moving averages, RSI, and trading volume are also used by traders to anticipate price movements and identify potential trend reversals.

FAQs on Pudgy Penguins Price Predictions

As of today, Pudgy Penguins (PENGU) is trading at $0.005834. The current market sentiment is Bearish, with RSI at 50.37 (Neutral) and volatility classified as Moderate.
Based on our technical analysis and projected annual growth rate, Pudgy Penguins could reach $0.00378 by 2027. This estimate assumes continued market momentum and adoption trends.
According to our technical analysis indicators, the Pudgy Penguins price prediction is forecasted to reach $0.000667 within the next five years (by 2031). Over the last 30 days, Pudgy Penguins recorded green days 45% of the time.
Based on multiple technical indicators, the current outlook for Pudgy Penguins in 2026 is Bearish. RSI currently sits at 50.37, which indicates Neutral momentum. However, investors should evaluate both technical signals and fundamental developments before making any investment decisions.
Long-term forecasts indicate that Pudgy Penguins may continue to grow over the next decade if adoption, technology development, and global crypto demand continue to expand.
While Pudgy Penguins's future value depends on various factors, technical indicators suggest it could experience both bullish and bearish cycles over time. Long-term investors typically monitor RSI levels, moving averages, and broader market sentiment when evaluating PENGU's future trajectory.
Disclaimer

AMBCrypto's content is meant to be informational in nature and should not be interpreted as investment advice. Trading, buying or selling cryptocurrencies should be considered a high-risk investment and every reader is advised to do their own research before making any decisions.