Is your crypto data lying? The ETF-driven shift no one’s talking about
The cryptocurrency market still leaves traces on-chain, but they aren't as obvious as once before.

Since 2011, the cryptocurrency market has relied on on-chain metrics to assess investor behavior and market sentiment. The introduction of U.S. Spot Bitcoin ETFs, however, altered the way that investors can now be exposed to Bitcoin.
With ETFs, billions of dollars can now enter the market with minimal impact on on-chain data and without interacting with the blockchain.
As a result, conventional on-chain indicators have become less effective since strong demand and price movements might no longer be reflected in network activity.
This change begs an important question: in an era driven by ETFs, can traditional on-chain metrics still effectively reflect market sentiment?
The rise of the ETF market
Following the introduction of U.S. Spot Bitcoin ETFs in January 2024, dynamics have shifted.
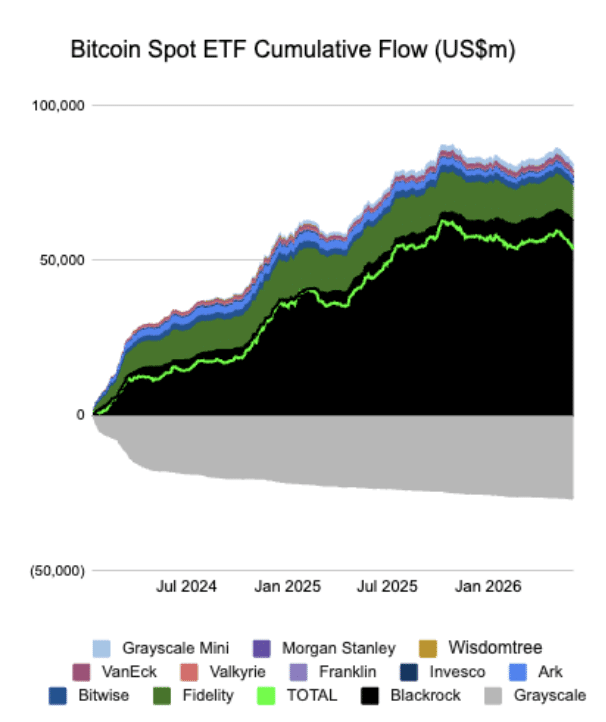
While institutional custodians held the underlying Bitcoin, investors could obtain exposure to the cryptocurrency through brokerage accounts without setting up wallets.
Strong inflows into ETFs could therefore raise the price of Bitcoin without causing an increase in on-chain activity. For example, in early 2024, Bitcoin surged above $70,000, even though active addresses were still far below their 2021 peak.
This led to a discrepancy between real investor demand and on-chain metrics. Needless to say, this has now become a common pattern across all cryptocurrencies that have ETFs.
The shift from Layer 1 to Layer 2
Before 2015, there used to be only one blockchain per ecosystem. Analysts had to track transactions, active addresses, and gas prices on just one blockchain to determine demand and adoption for the entire ecosystem.
However, as Layer 2s were introduced, a lot of activity shifted off the main chain, for example, Ethereum [ETH], to L2 networks like Arbitrum, Optimism, Base, and zkSync.
These networks aggregate thousands of transactions into a single transaction that is settled on the main chain. Consequently, the overall activity of the network is no longer reflected in L1 metrics.
Case in point, Ethereum’s L1 transaction count seems to have decreased since 2023. However, this does not imply that usage has decreased. Instead, a sizable portion of user activity has moved to L2s, where transaction volumes frequently surpass those on the main Ethereum chain.
Thus, analysts who solely concentrate on L1 data run the risk of underestimating the actual volume of activity occurring throughout the Ethereum ecosystem.
Are exchange inflows losing their steam?
Exchange inflows were thought to be a consistent bearish indicator for many years. The logic was straightforward: investors were frequently getting ready to sell when they transferred their coins from their personal wallets to exchanges.
In 2018 and 2021, large inflows often preceded significant market tops.
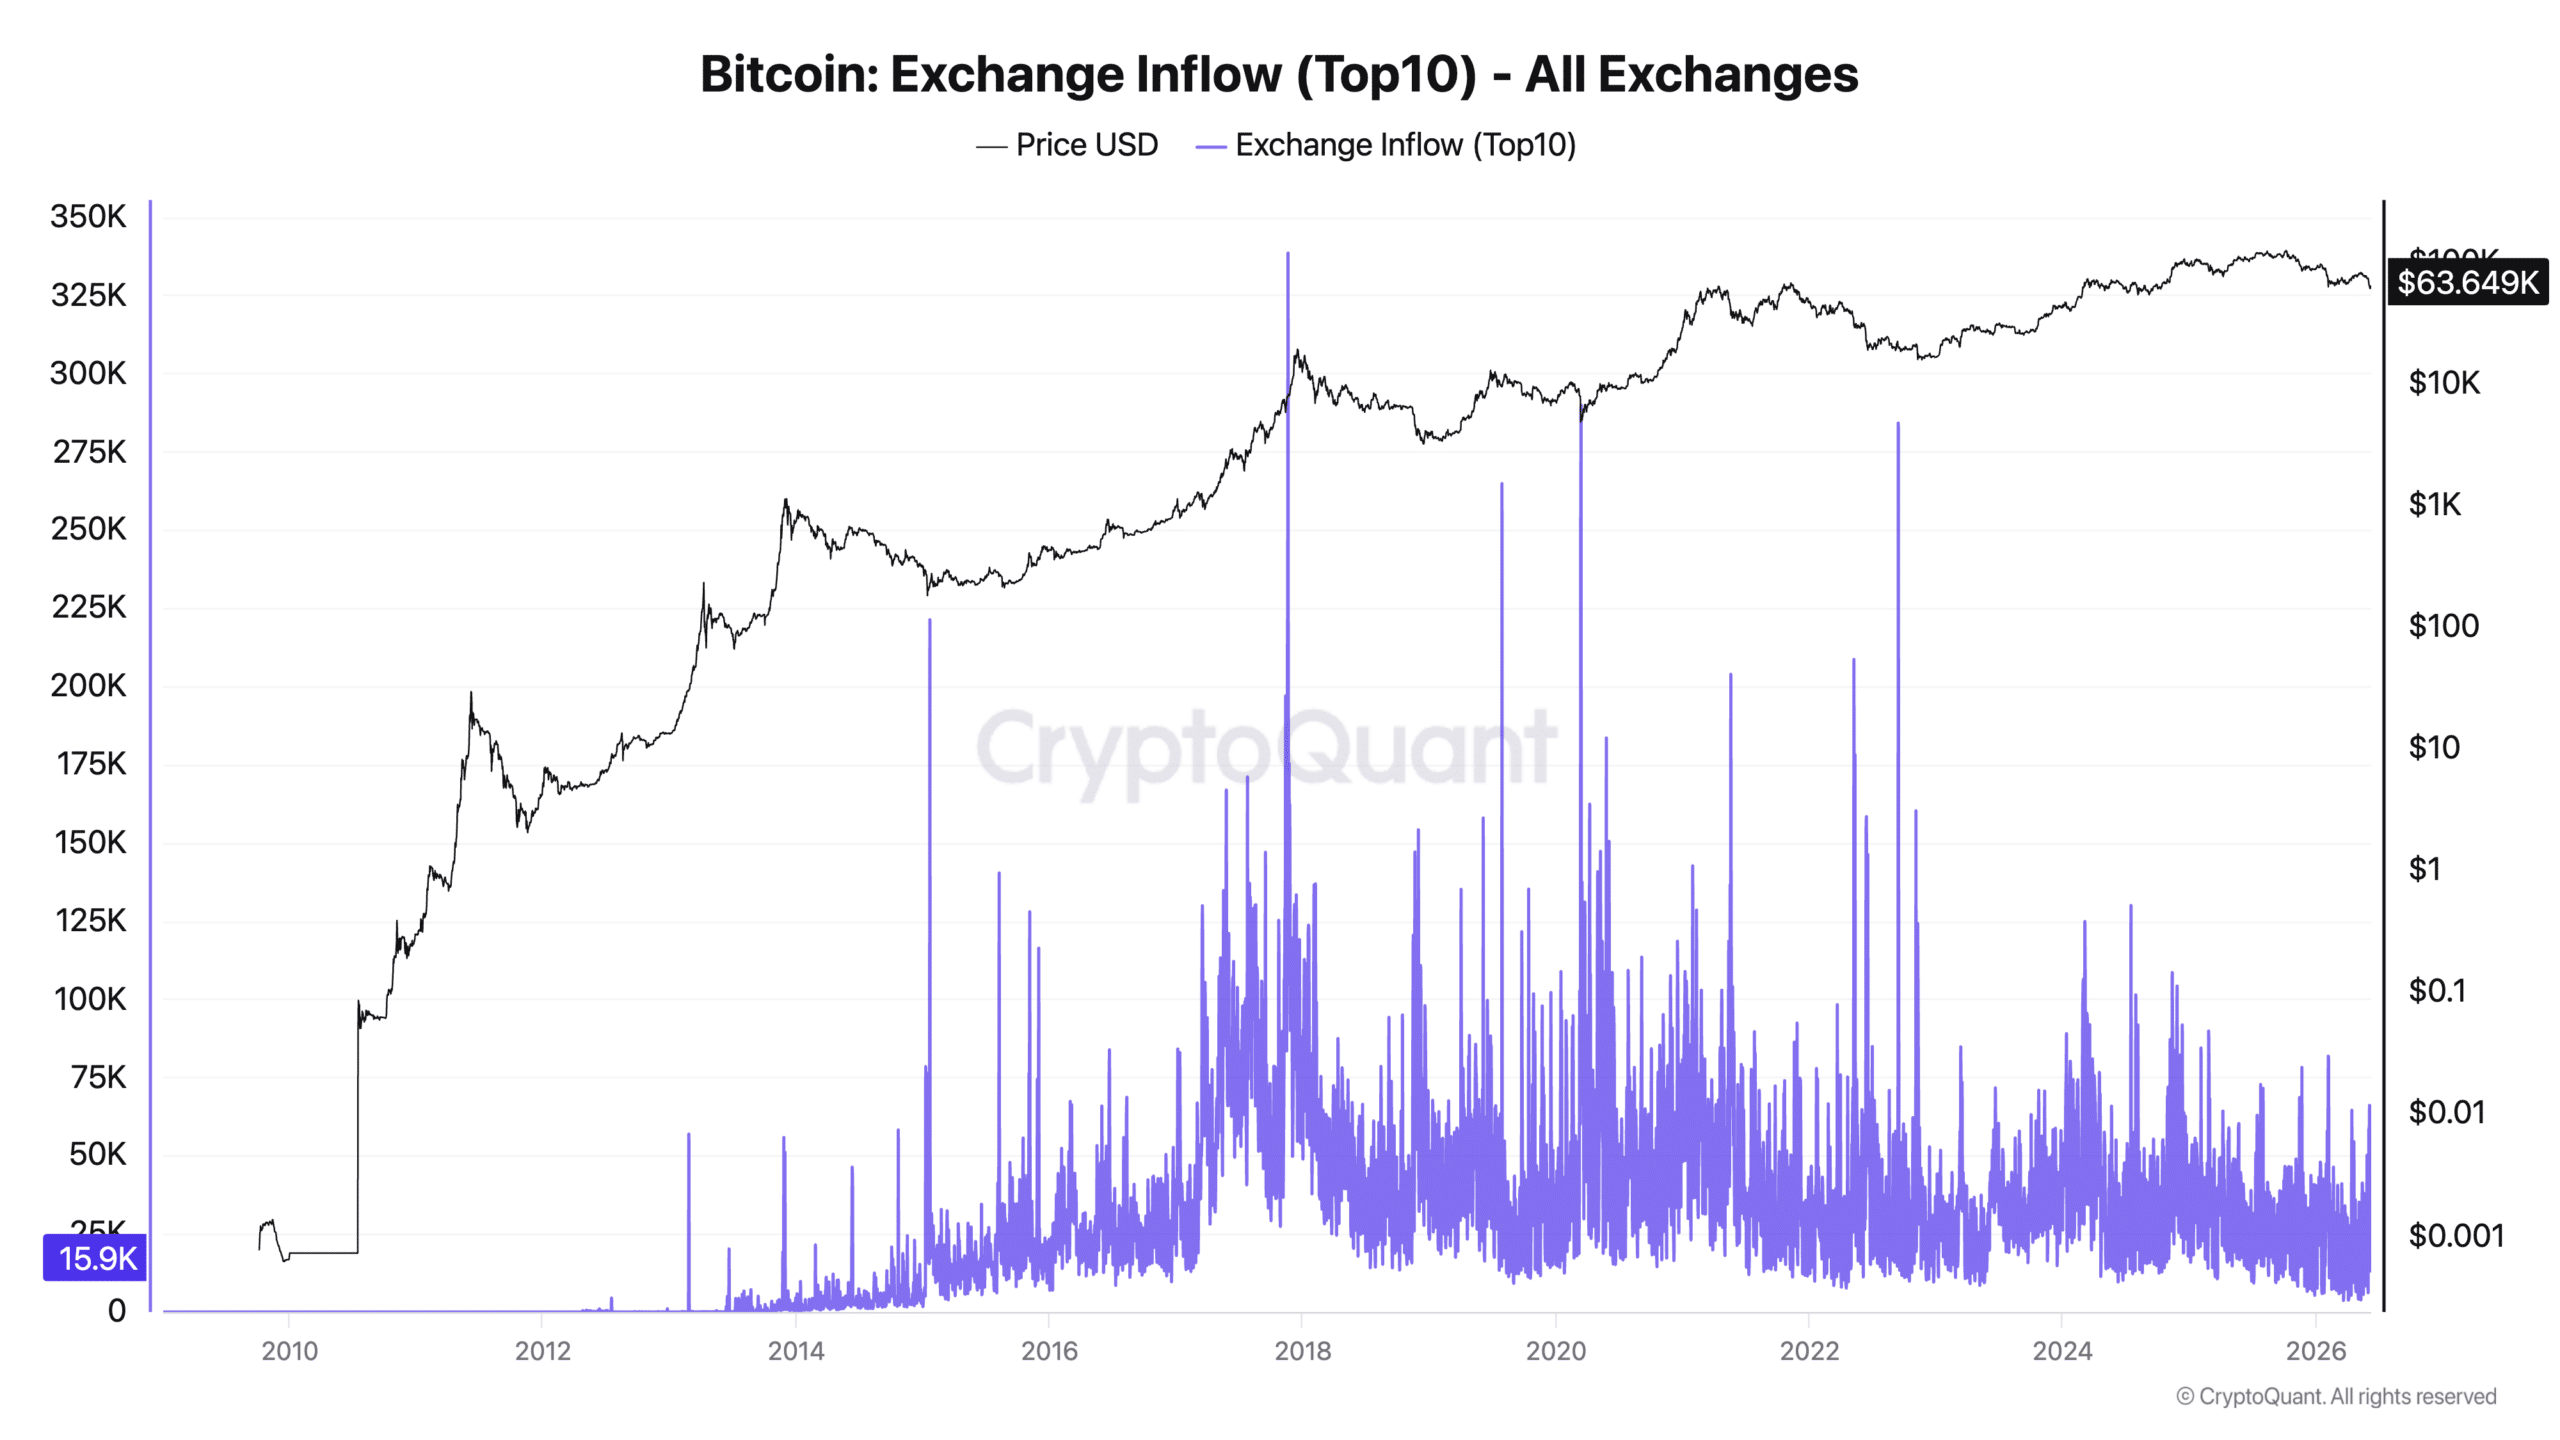
However, the way these movements should be interpreted has changed as institutional participation has increased. Exchanges now act as repositories and centers for collateral for trading firms, asset managers, and hedge funds.
Instead of being sold right away, coins may be moved to exchanges for custody management, portfolio rebalancing, or collateral for derivatives. As a result, exchange inflows no longer always indicate pressure to sell.
What changed?
It’s not that conventional indicators have become less accurate in and of themselves. It’s just that many of them were created for a market that was dominated by self-custody, direct blockchain activity, and retail investors.
These days, many other factors influence how activity appears on-chain, including institutional investors, ETFs, custodians, and L2 networks.
Therefore, many metrics are not necessarily incorrect, but they can be deceptive if they are interpreted based on outdated presumptions.
The new era of on-chain metrics
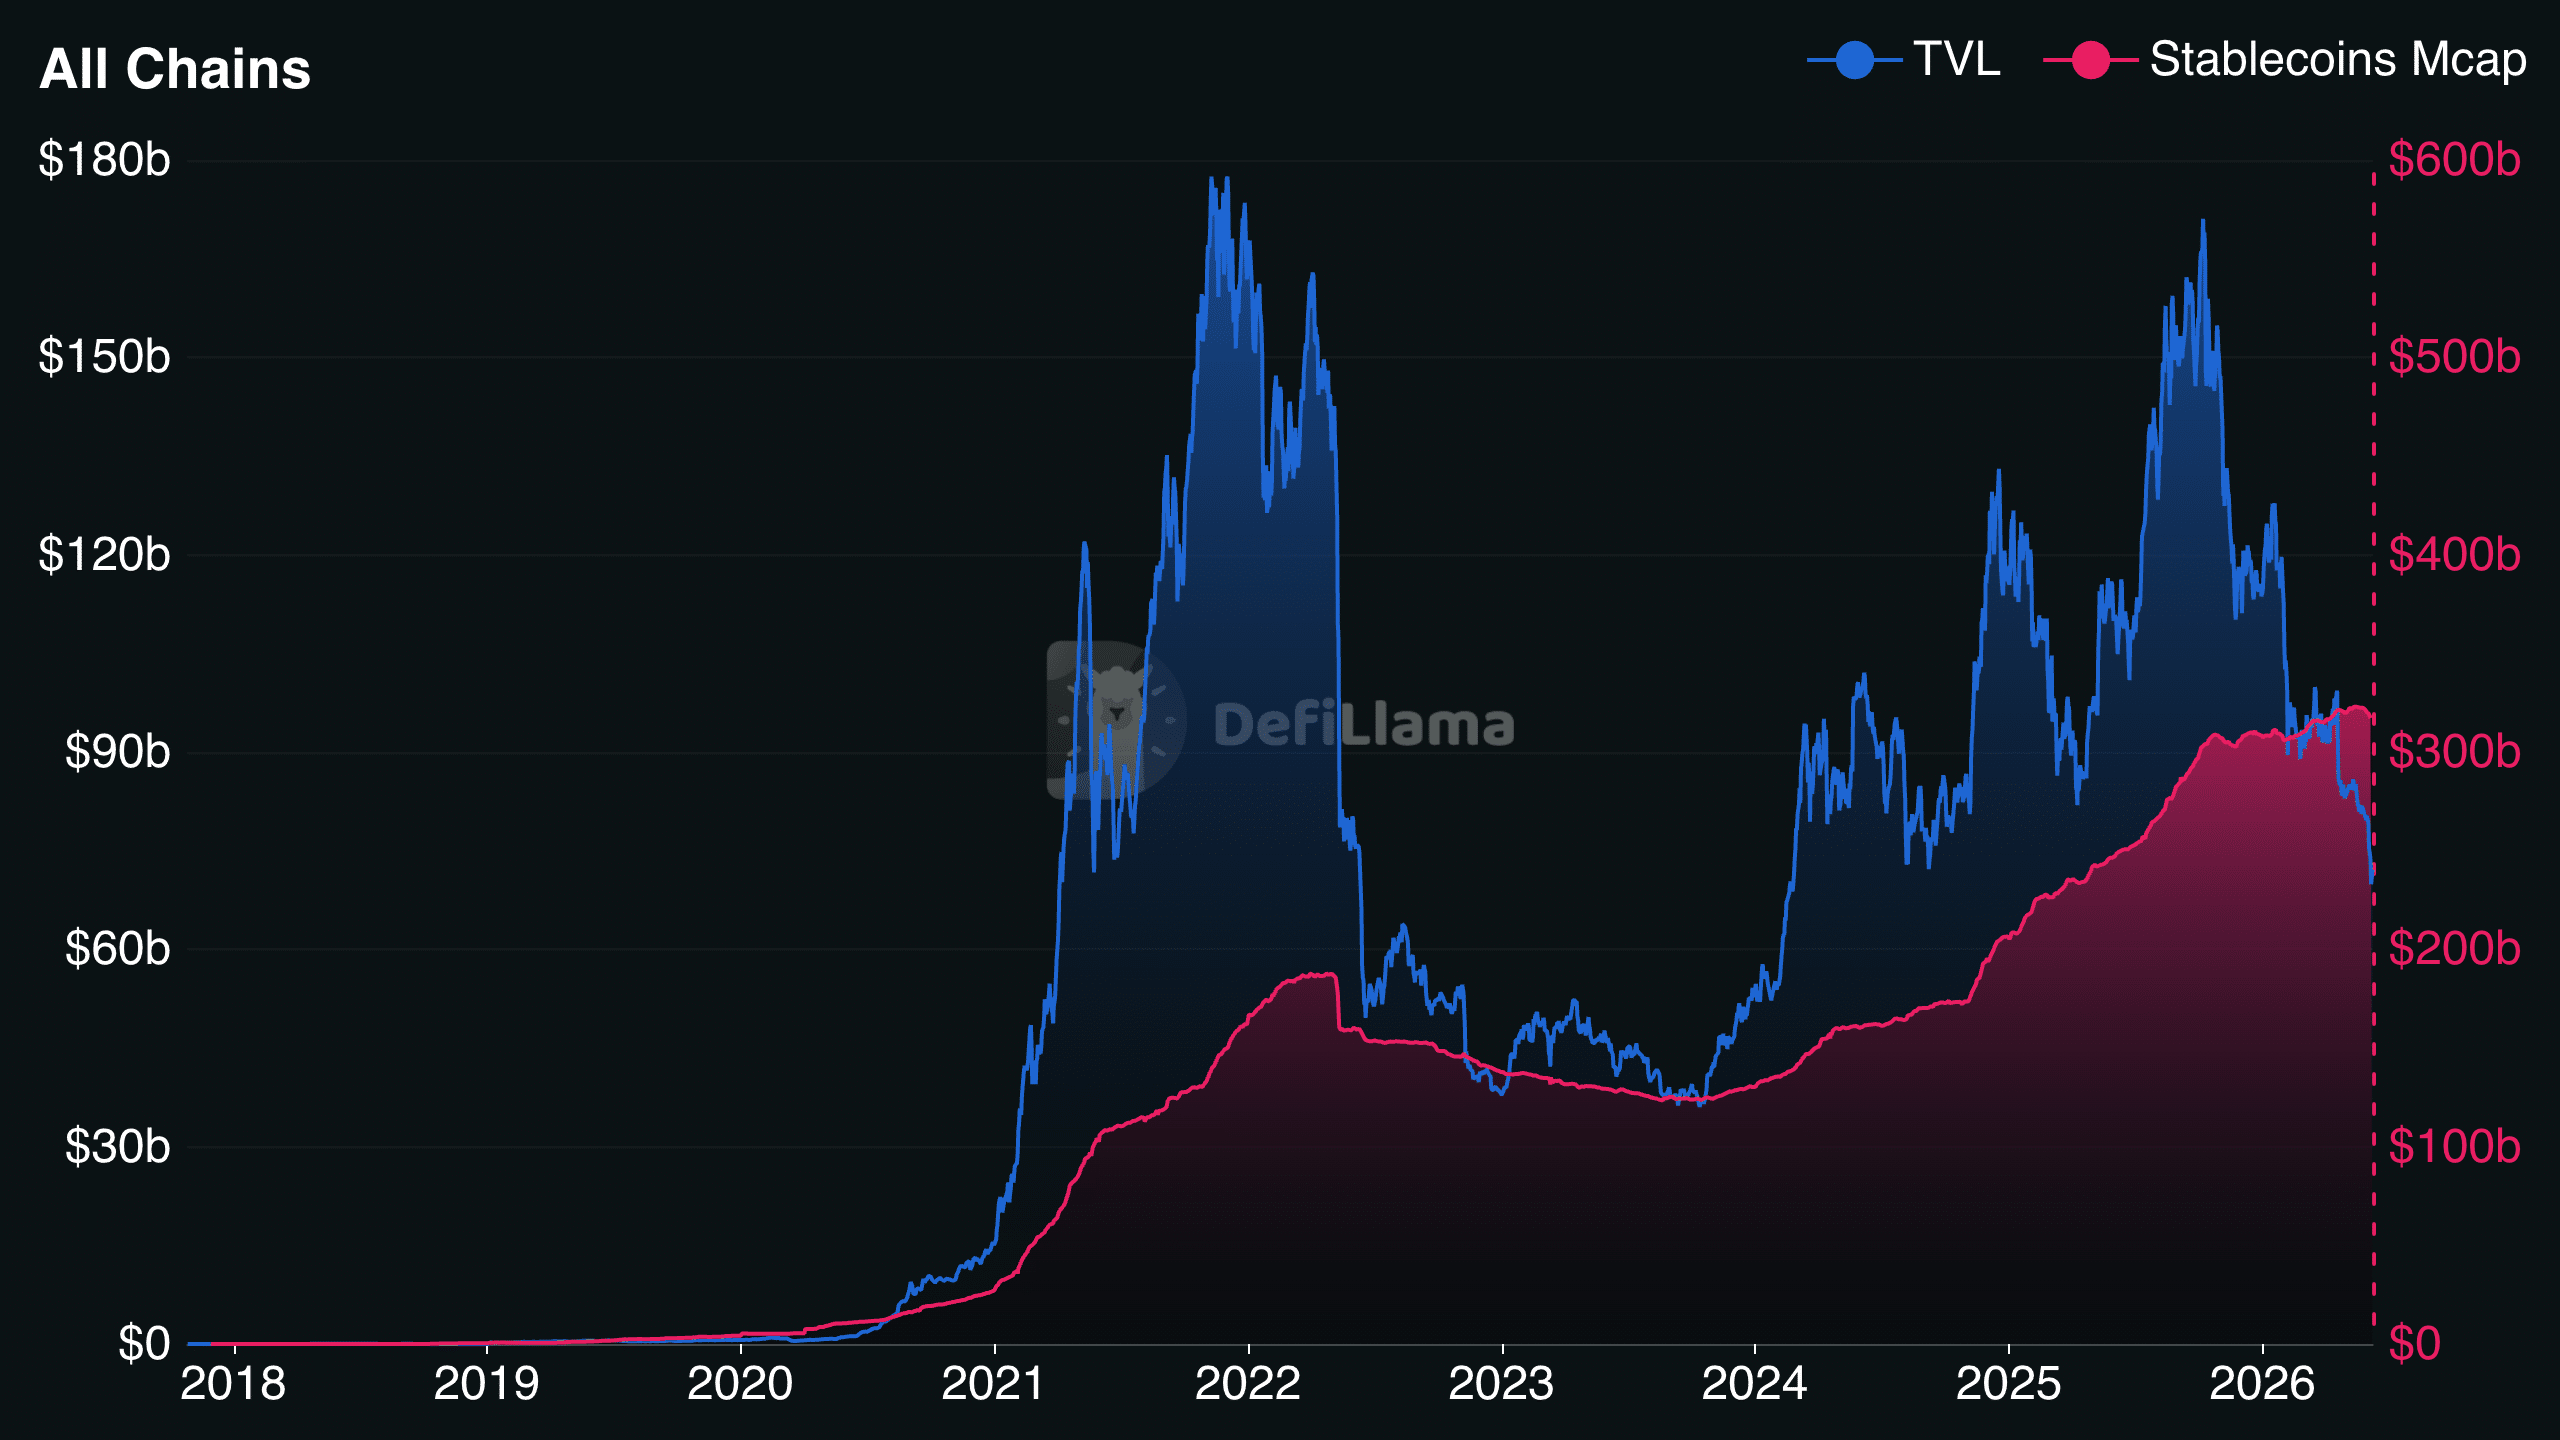
Total value locked (TVL), whale movement, and stablecoin analysis remain useful to get around the drawbacks of other conventional on-chain metrics.
For instance, increasing TVL typically indicates rising user engagement, liquidity, and trust in a blockchain ecosystem. It provides a better picture of whether capital is flowing into decentralized applications or just sitting on the blockchain.
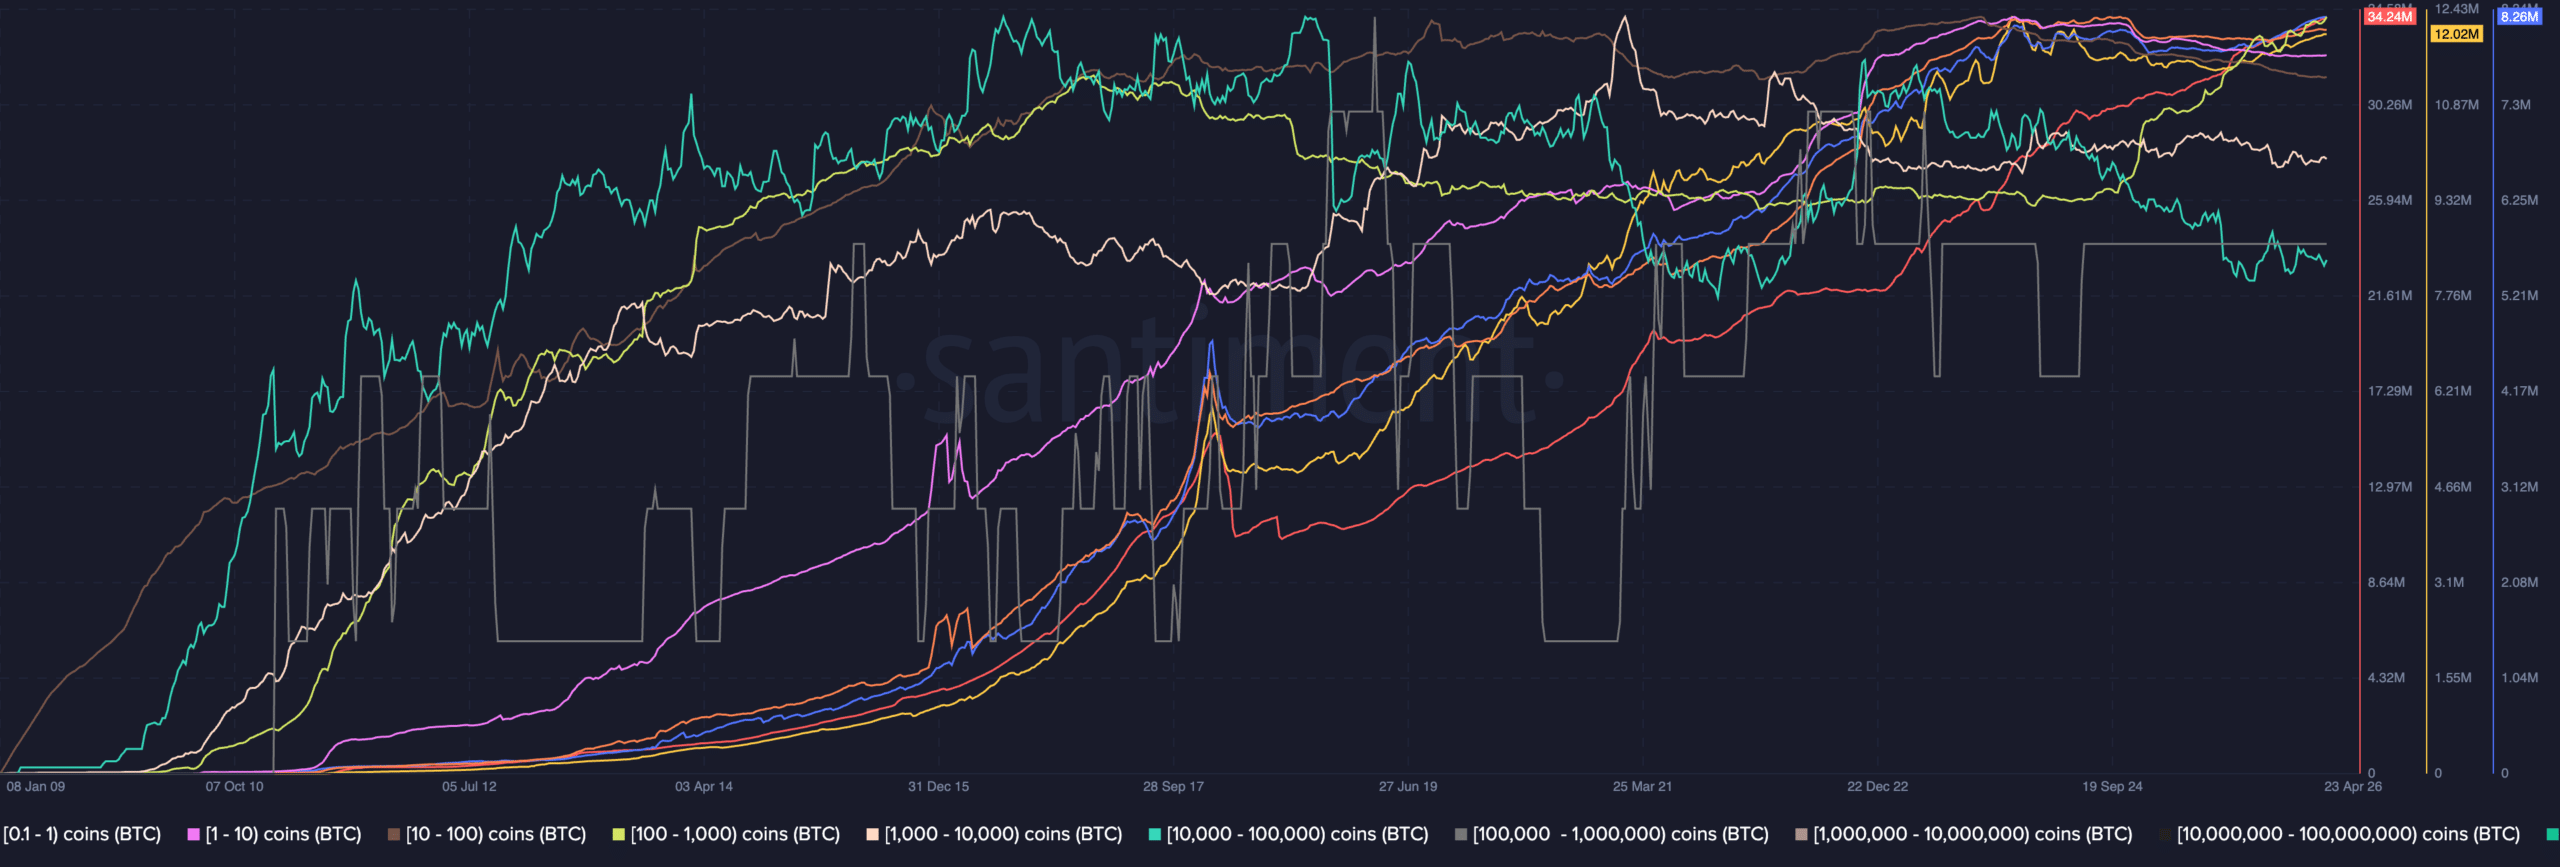
Whale activities can also have a big impact on market sentiment and liquidity because of the size of their holdings. Occasionally, whale activity can offer an early indication of new trends, as retail investors usually respond after significant market movements start.
Within cryptocurrency markets, stablecoins frequently act as liquidity reserves.
By monitoring their supply, exchange balances, and dominance, analysts can gain important insight into investor sentiment and liquidity conditions by determining whether capital is entering the market, staying out of it, or shifting into riskier assets.
Overall, in the current crypto environment, no single on-chain metric can adequately capture market sentiment in 2026.
Final Summary
- On-chain activity now looks different thanks to Layer-2 networks, custodians, institutional investors, and ETFs.
- Instead of depending just on one indicator, it is necessary to connect multiple data points to comprehend contemporary cryptocurrency markets.