DEXE falls 11% in a day – But THIS is why price looks bullish in the long-term
The crypto AI sector has slightly outperformed Bitcoin over the past week, and the relative strength was evident with DEXE too.

DeXe [DEXE] has flashed a bearish divergence between its RSI and price action, flagged DYOR, the crypto market scanner handle on X.
The overextended conditions for the crypto AI token were met with an 11.08% price drop in the past 24 hours, alongside a 27.9% slide in daily trading volume.
Glassnode data showed that the crypto AI sector was up 7.9% over the past week, compared to the 4.1% for Bitcoin [BTC].
It signaled relative strength in the sector, but can this spur DEXE bulls to drive the price to new highs?
Bearish divergence versus bullish structure
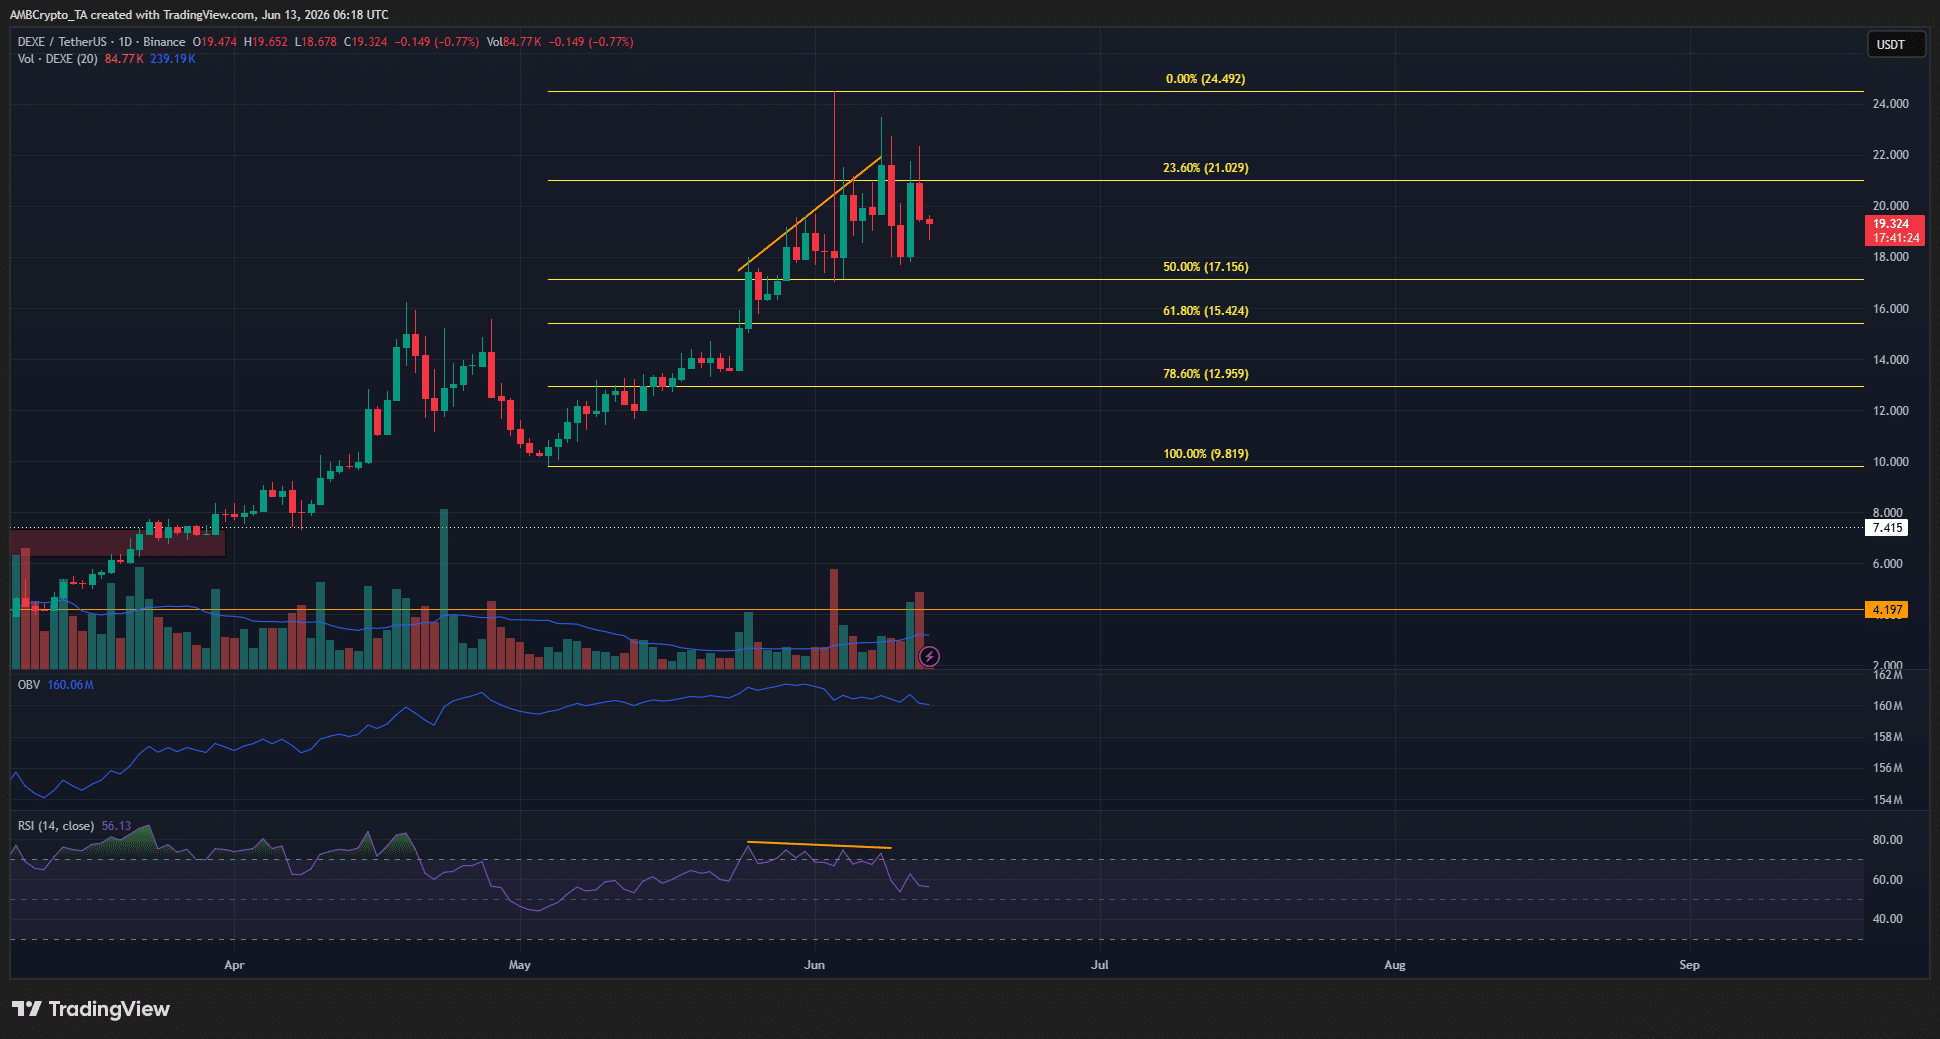
Over the past two weeks, the price has indeed made higher highs while the RSI made lower highs (orange). This was a classic bearish divergence signal. One drawback with this signal is that, like this time, it need not result in an immediate pullback.
In this example, the DEXE rally persisted for five days beyond the first clear divergence signal, showing how risky it can be to use just the signal to trade the asset.
The OBV was declining in recent days, but the slump was relatively minor compared to the upward advance since January.
The current higher timeframe uptrend was established in March, when the bulls overthrew the previous swing high that marked the downtrend.
Currently, despite the price drop in the past 24 hours and the bearish divergence, the trend remains bullish. Traders can prepare for a short-term pullback.
DEXE traders can use a pullback to buy
The current market sentiment was extremely pessimistic after the Bitcoin crash earlier this month. Capital outflows affect how much the altcoin market can rally, but individual tokens can catch a bid.
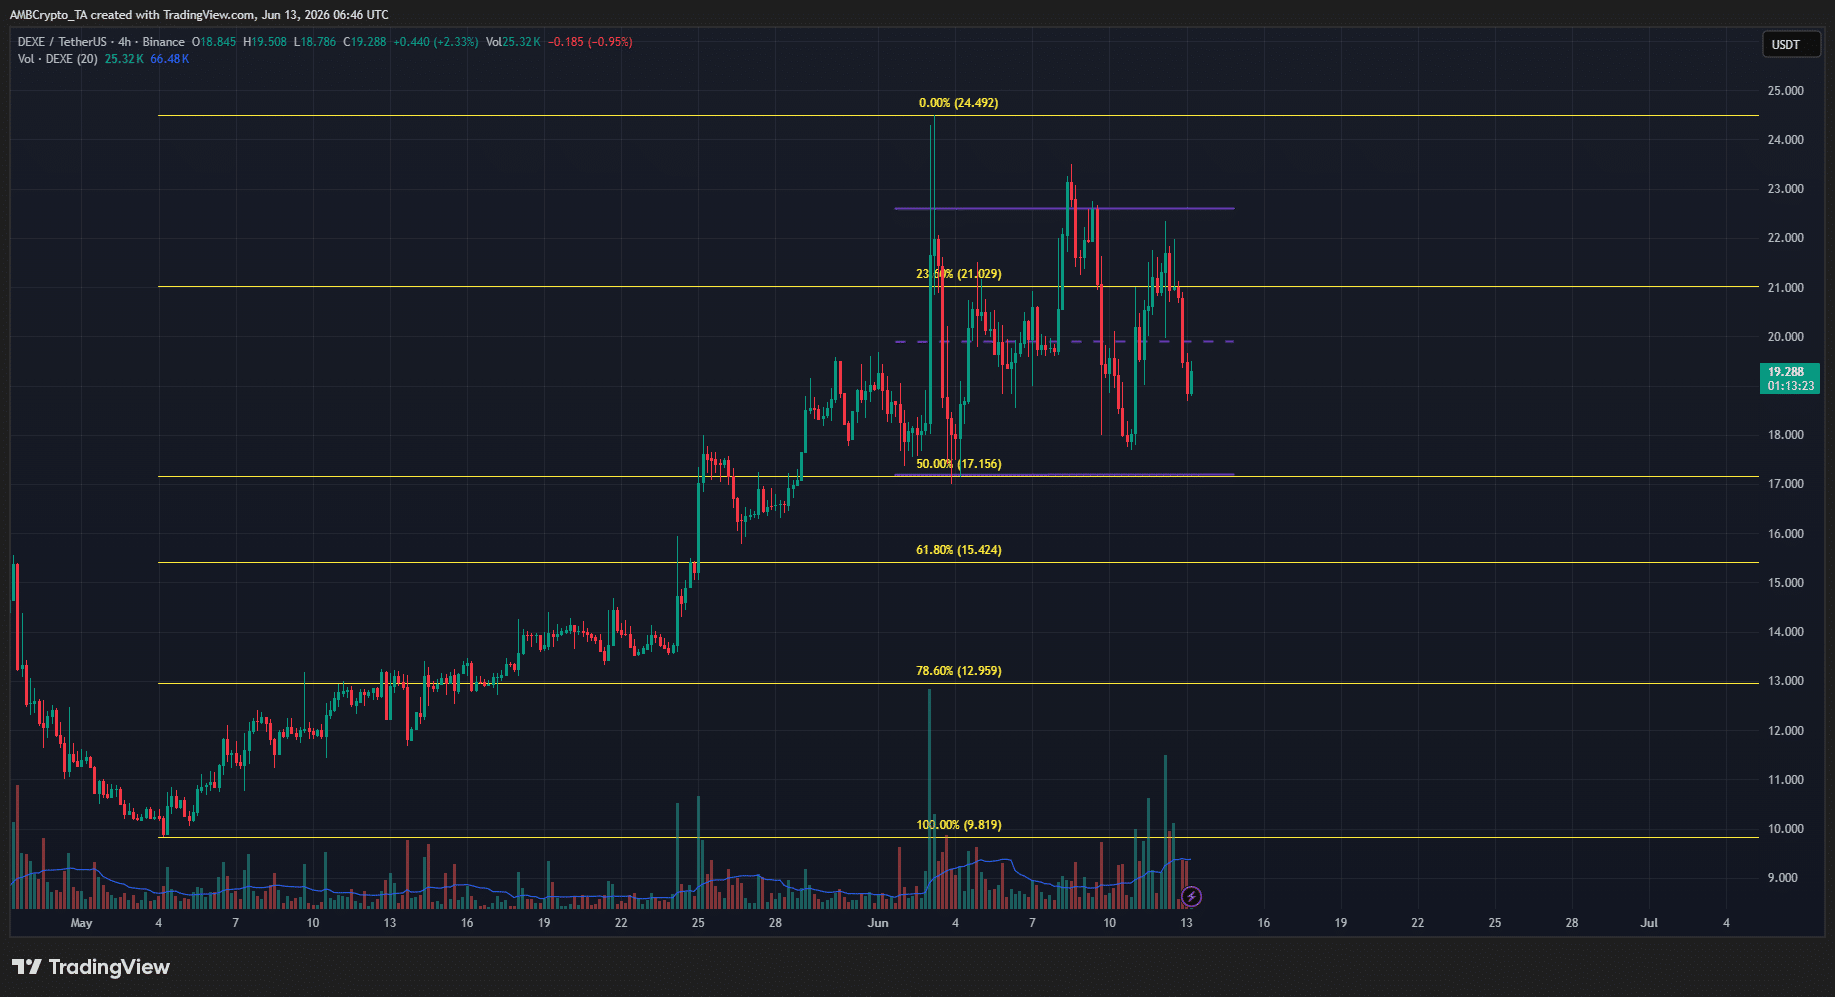
DEXE could be one of them in the coming weeks. It was consolidating between the $17.2-$22.6 area over the past two weeks. Likely, this consolidation would soon turn into a correction.
A price slide to the $12.95-$15.42 golden pocket would give investors a good buying opportunity.
At the same time, there is a pronounced risk of a crypto sell-off, led by Bitcoin, in the coming months. DEXE buyers should weigh their risk carefully before bidding.
Final Summary
- The crypto AI sector has slightly outperformed Bitcoin over the past week.
- This relative strength has helped DeXe token prices push higher, but a correction appeared due.