Has Bitcoin found a price bottom? – Historic signal hints at BTC’s rebound
There's a chance Bitcoin may have found its bottom.

Bitcoin [BTC] may have found a bottom after liquidity outflows that began in October 2025 wiped $1.04 trillion from the market at presstime.
The latest readings suggest the asset could be forming that bottom, with a rally possible off the structural base built over the past day.
CVDD signals a value floor
Cumulative Value Days Destroyed (CVDD) weighs destroyed coin days across BTC‘s history against the current market value. The metric estimates Bitcoin’s fair-value floor by accounting for the behavior of long-term holders.
At the time of writing, CryptoQuant data showed Bitcoin’s CVDD had dipped into an extremely low region, printing a reading of 0.3.
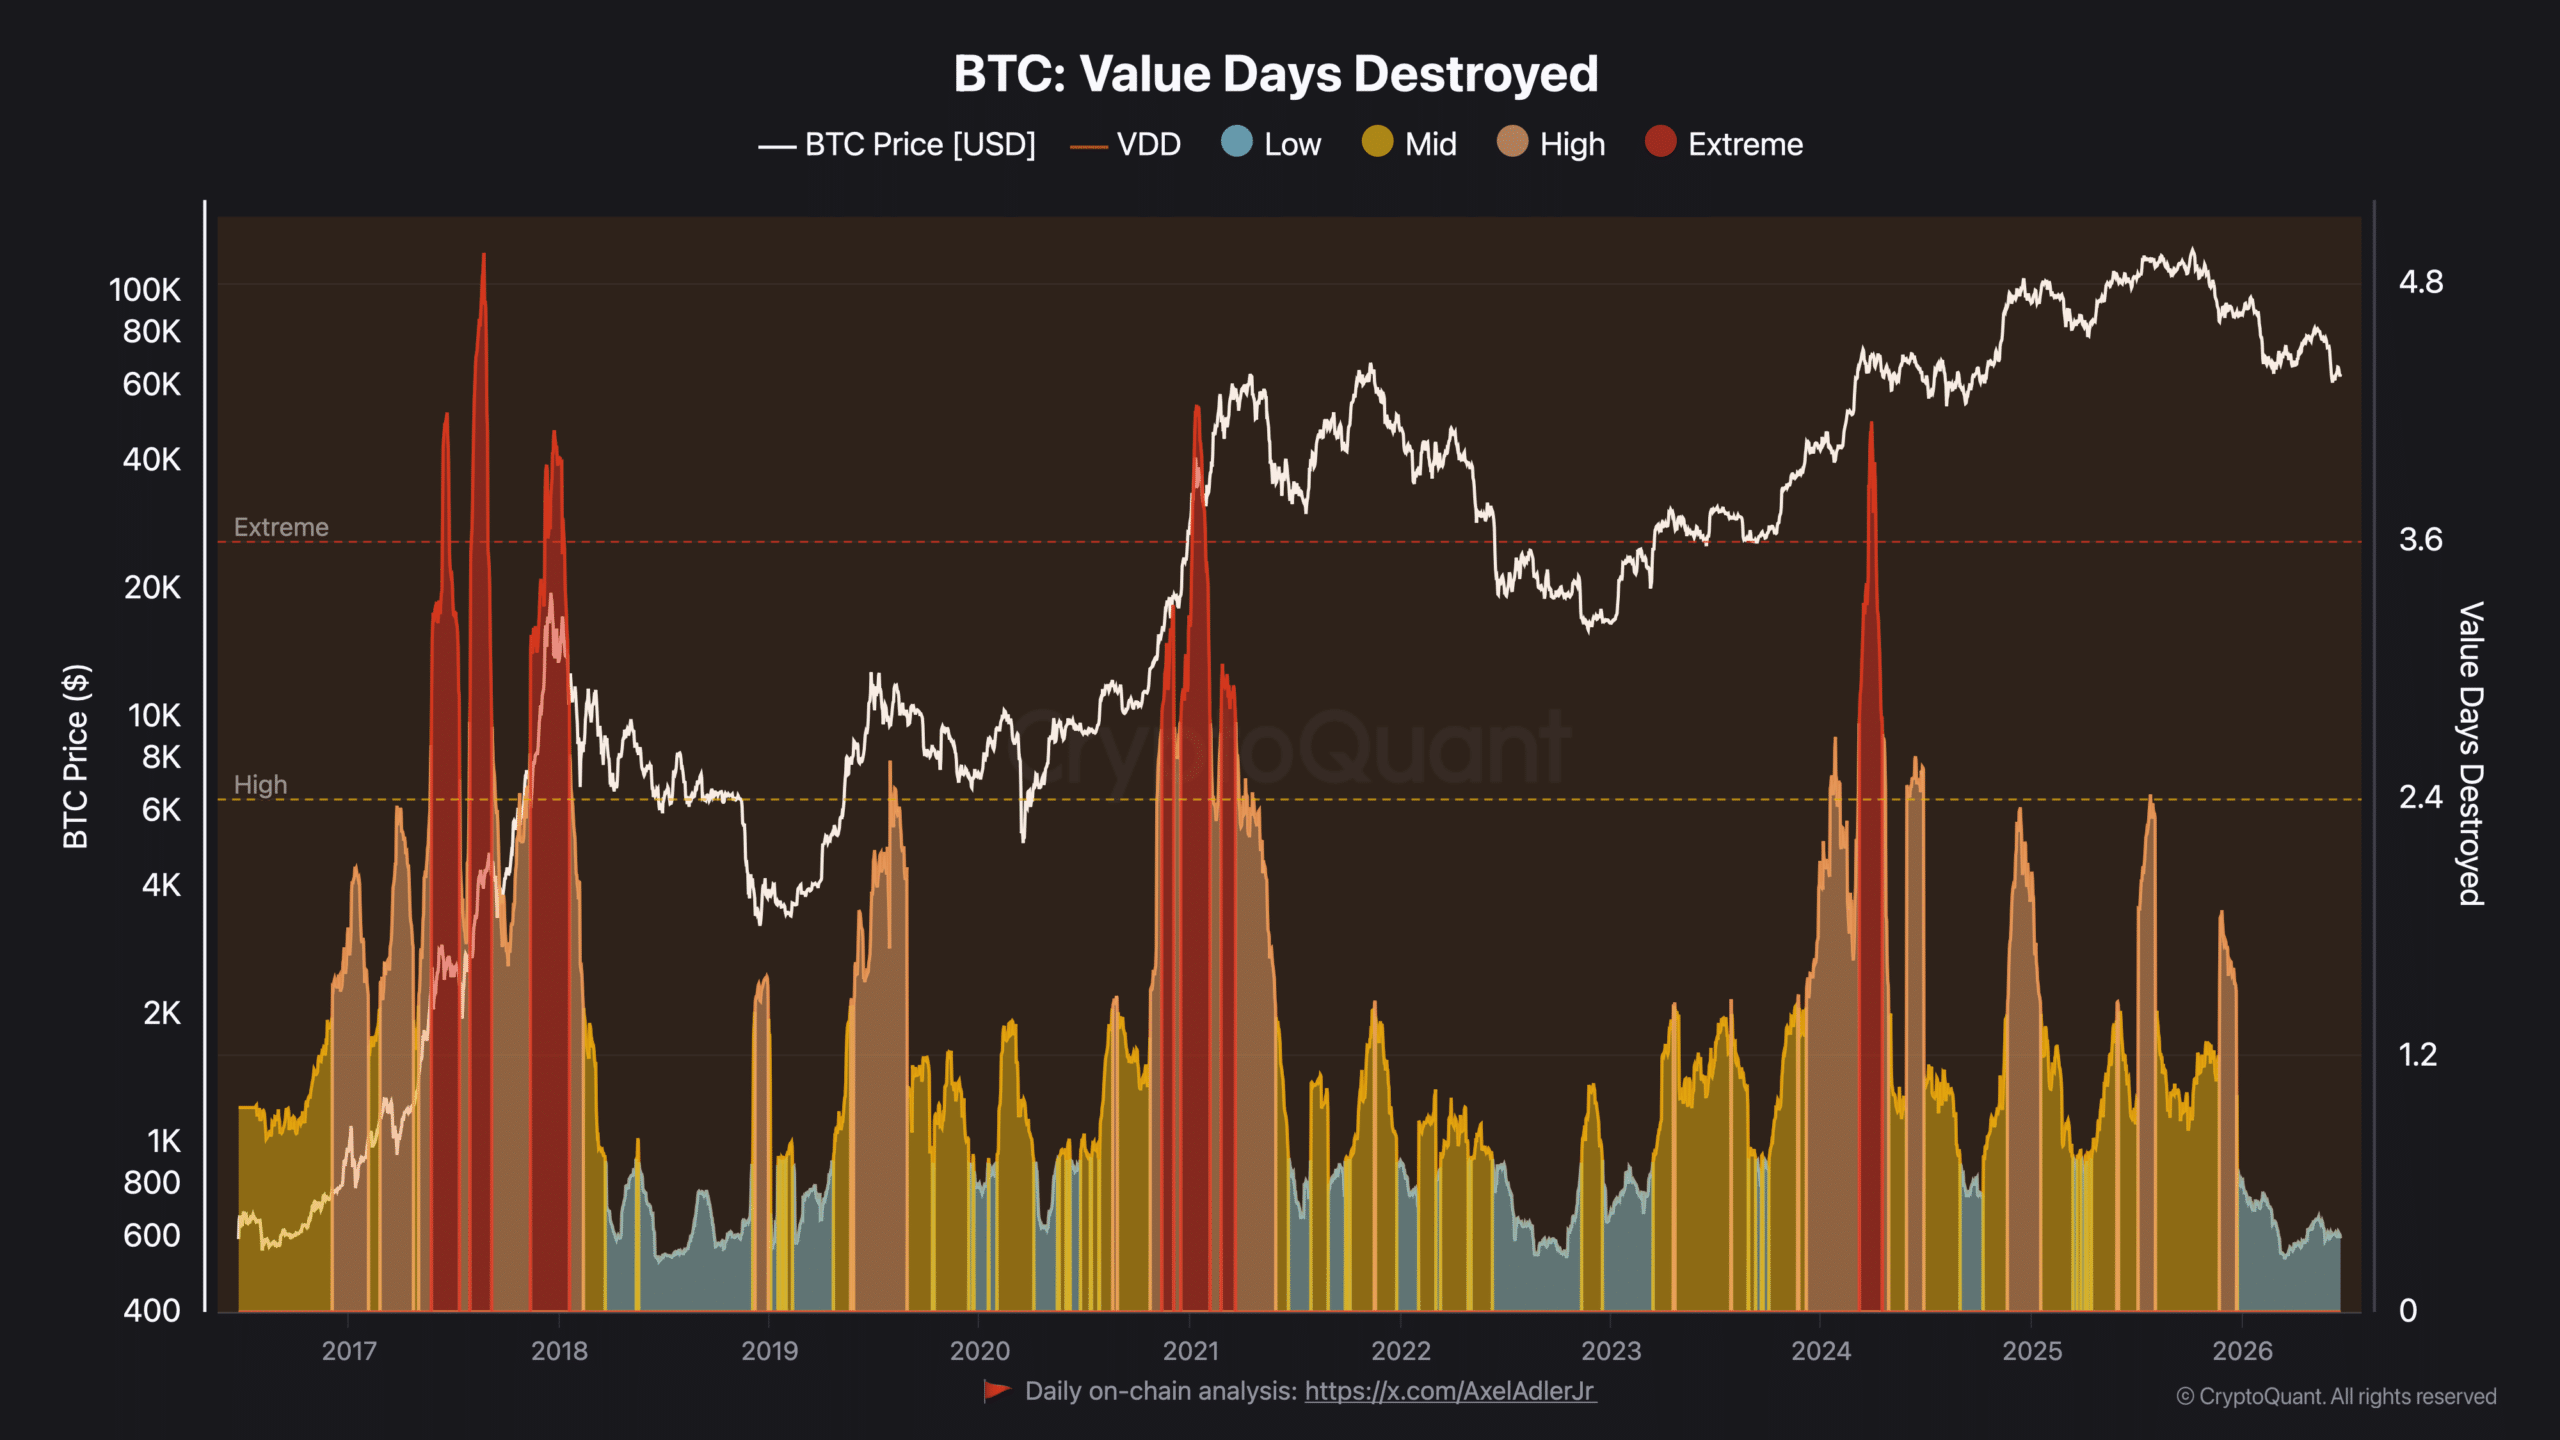
Levels like this have marked price tops and bottoms on several occasions, notably in 2019 and 2022.In each case, price plunged to this zone before a major rebound followed, carrying the asset toward a new high.
Should that pattern repeat, Bitcoin’s swing between $60,000 and $64,000 over the past weeks may mark the bottom.That base would stand as the floor the asset builds from for now.
Bitcoin holds its 200-week structural support
On the weekly timeframe, Bitcoin is trading on its 200-week SMA (simple moving average), a level that has acted as support in the past and powered earlier rallies. The last time Bitcoin dropped to this level, it consolidated along the line for months between July 2022 and October 2023.
That stretch was followed by a significant increase, which ranged from $27,112 to approximately $73,777. Notably, Bitcoin is trading in the same range as before, with no indication of which way it will break.
The path could result in a quick rebound or another extended consolidation.
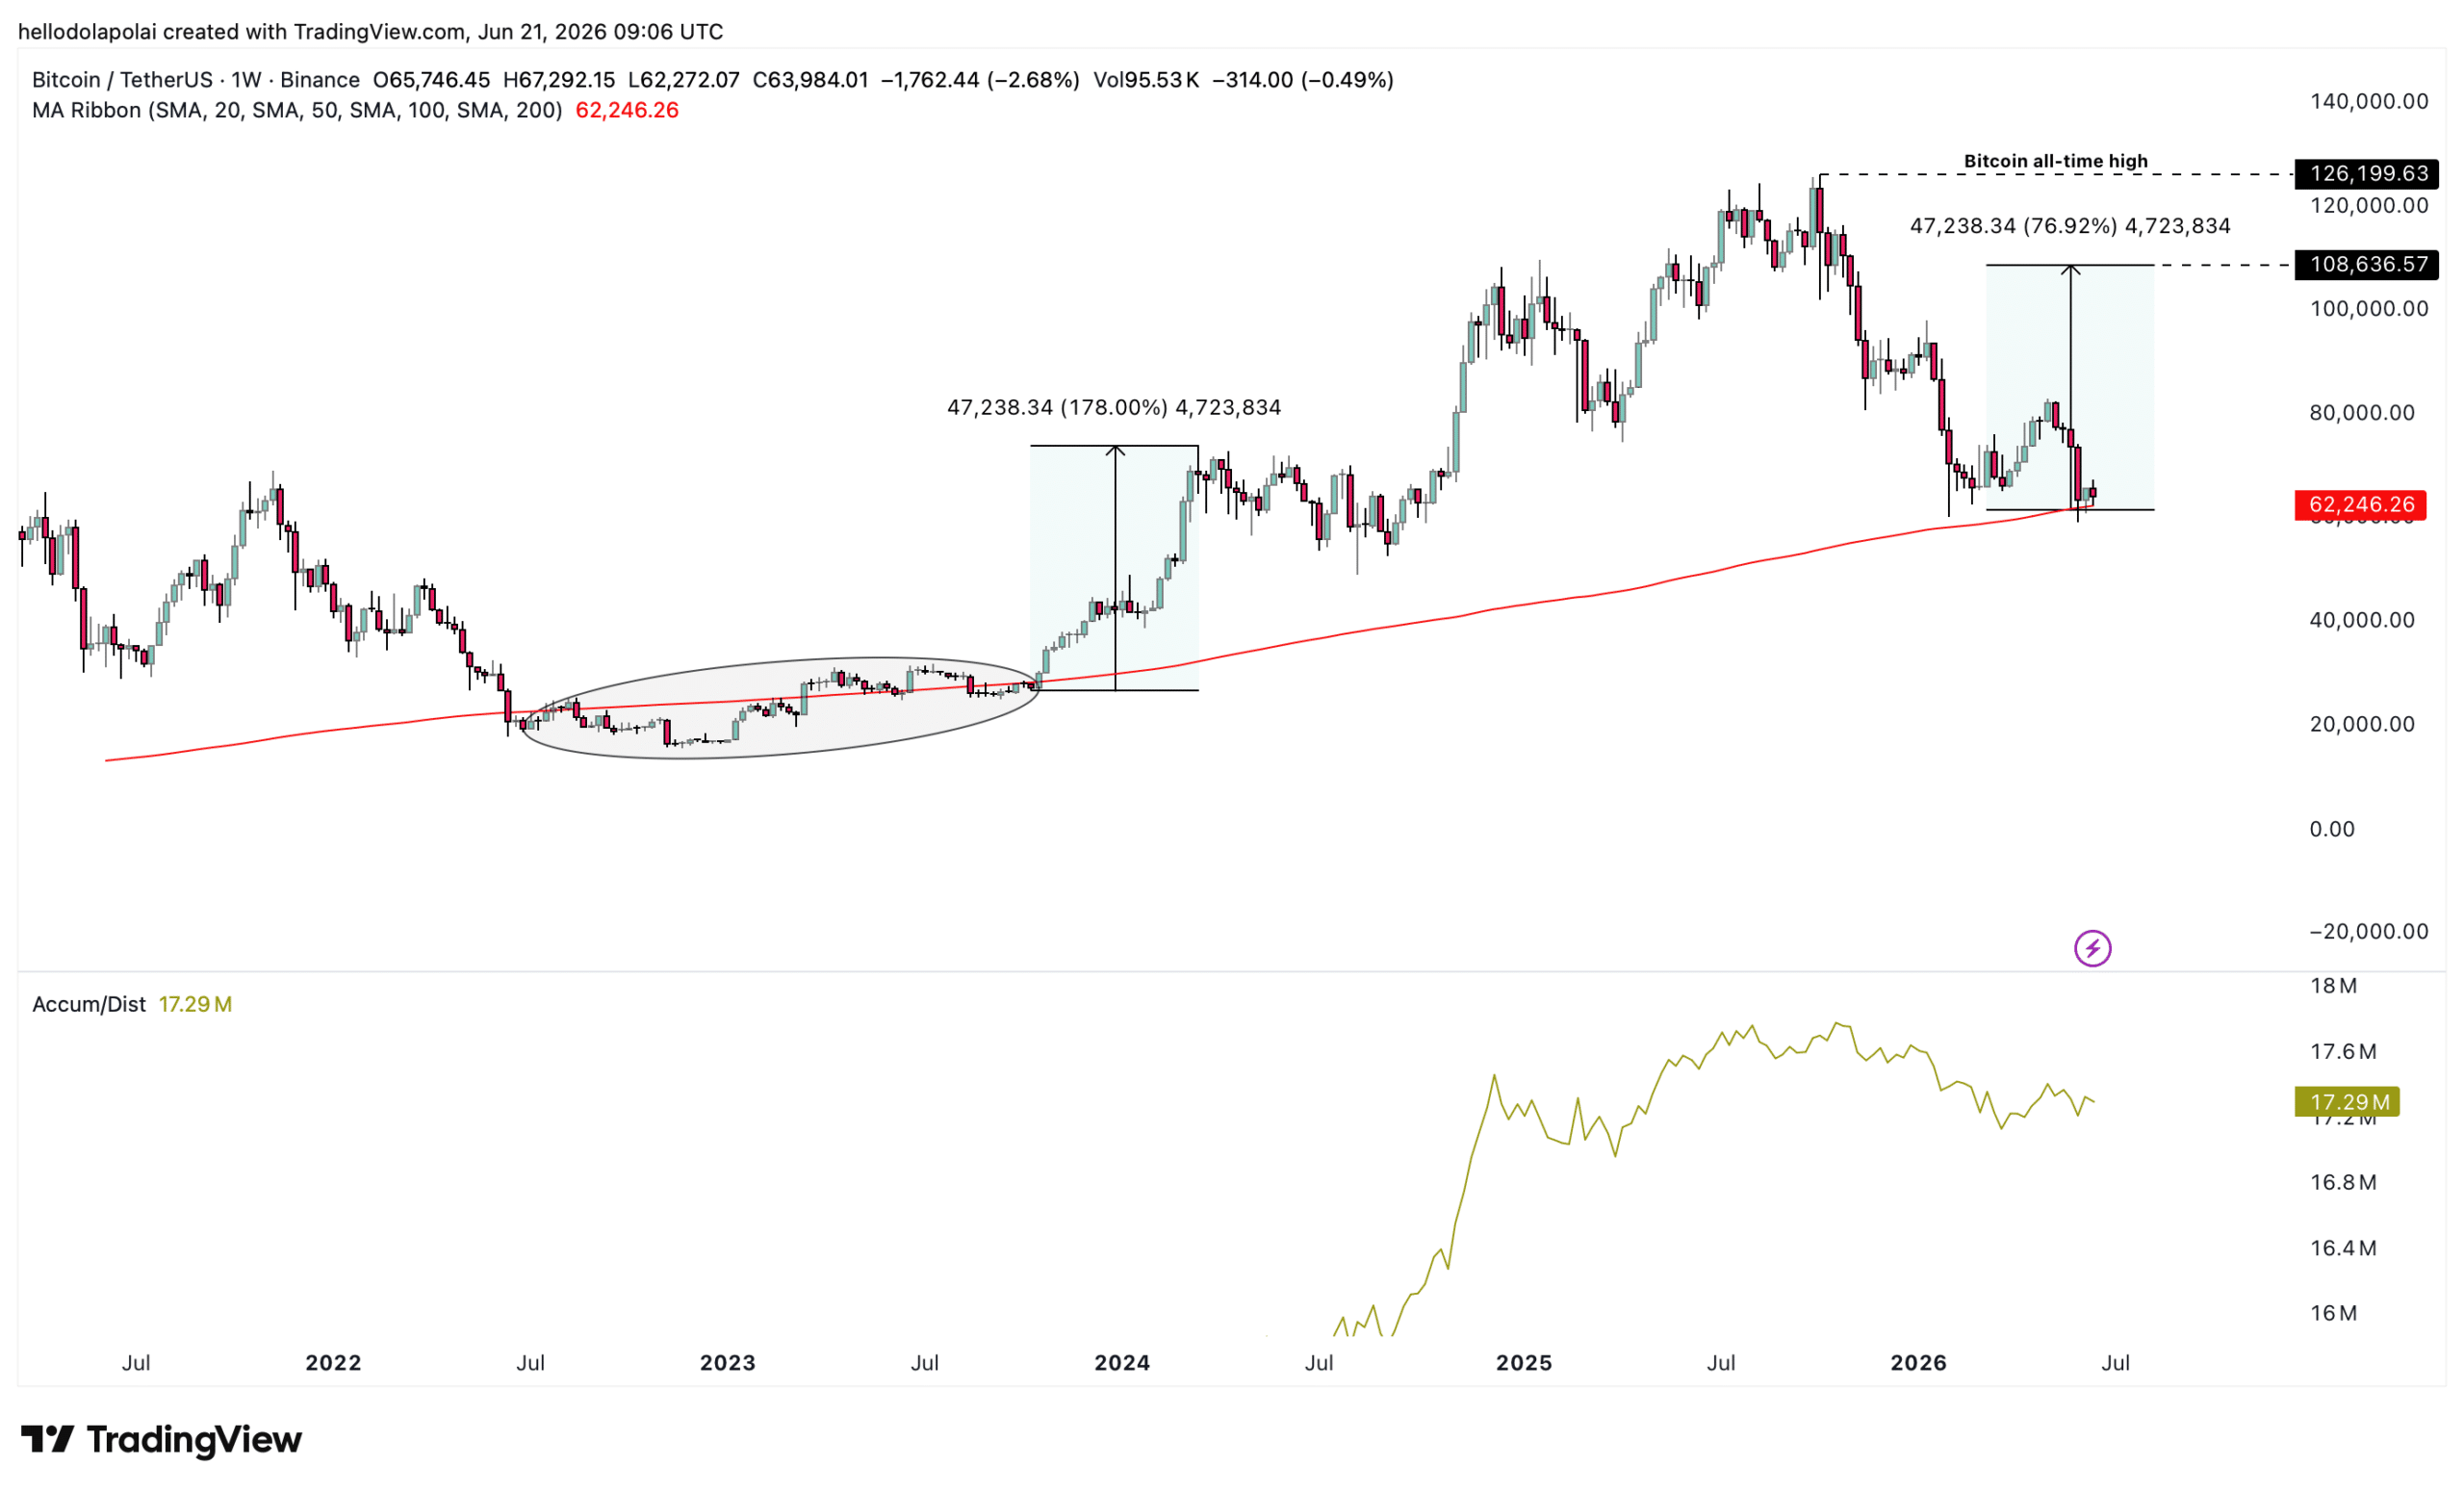
If a rally similar to 2023 unfolds, Bitcoin stands a strong chance of climbing 76% to a high of roughly $108,636 on the chart. The accumulation/distribution indicator reinforces the case, pointing to ongoing buying pressure with 17.11 million in Bitcoin volume.
Such a steady inflow is a net positive for the asset across the short to near term.
Bitcoin momentum hinges on exchange and ETF flows
Gauging whether momentum still holds means tracking the key venues where traders act. Spot exchange netflow alongside U.S. spot ETF flows stand out as two important proxies for that read.
Spot netflow across centralized exchanges over the past seven days shows a net buy, with around $234.75 million in buy netflow. That demand pushed total Bitcoin purchases over the same stretch to $9.36 billion.
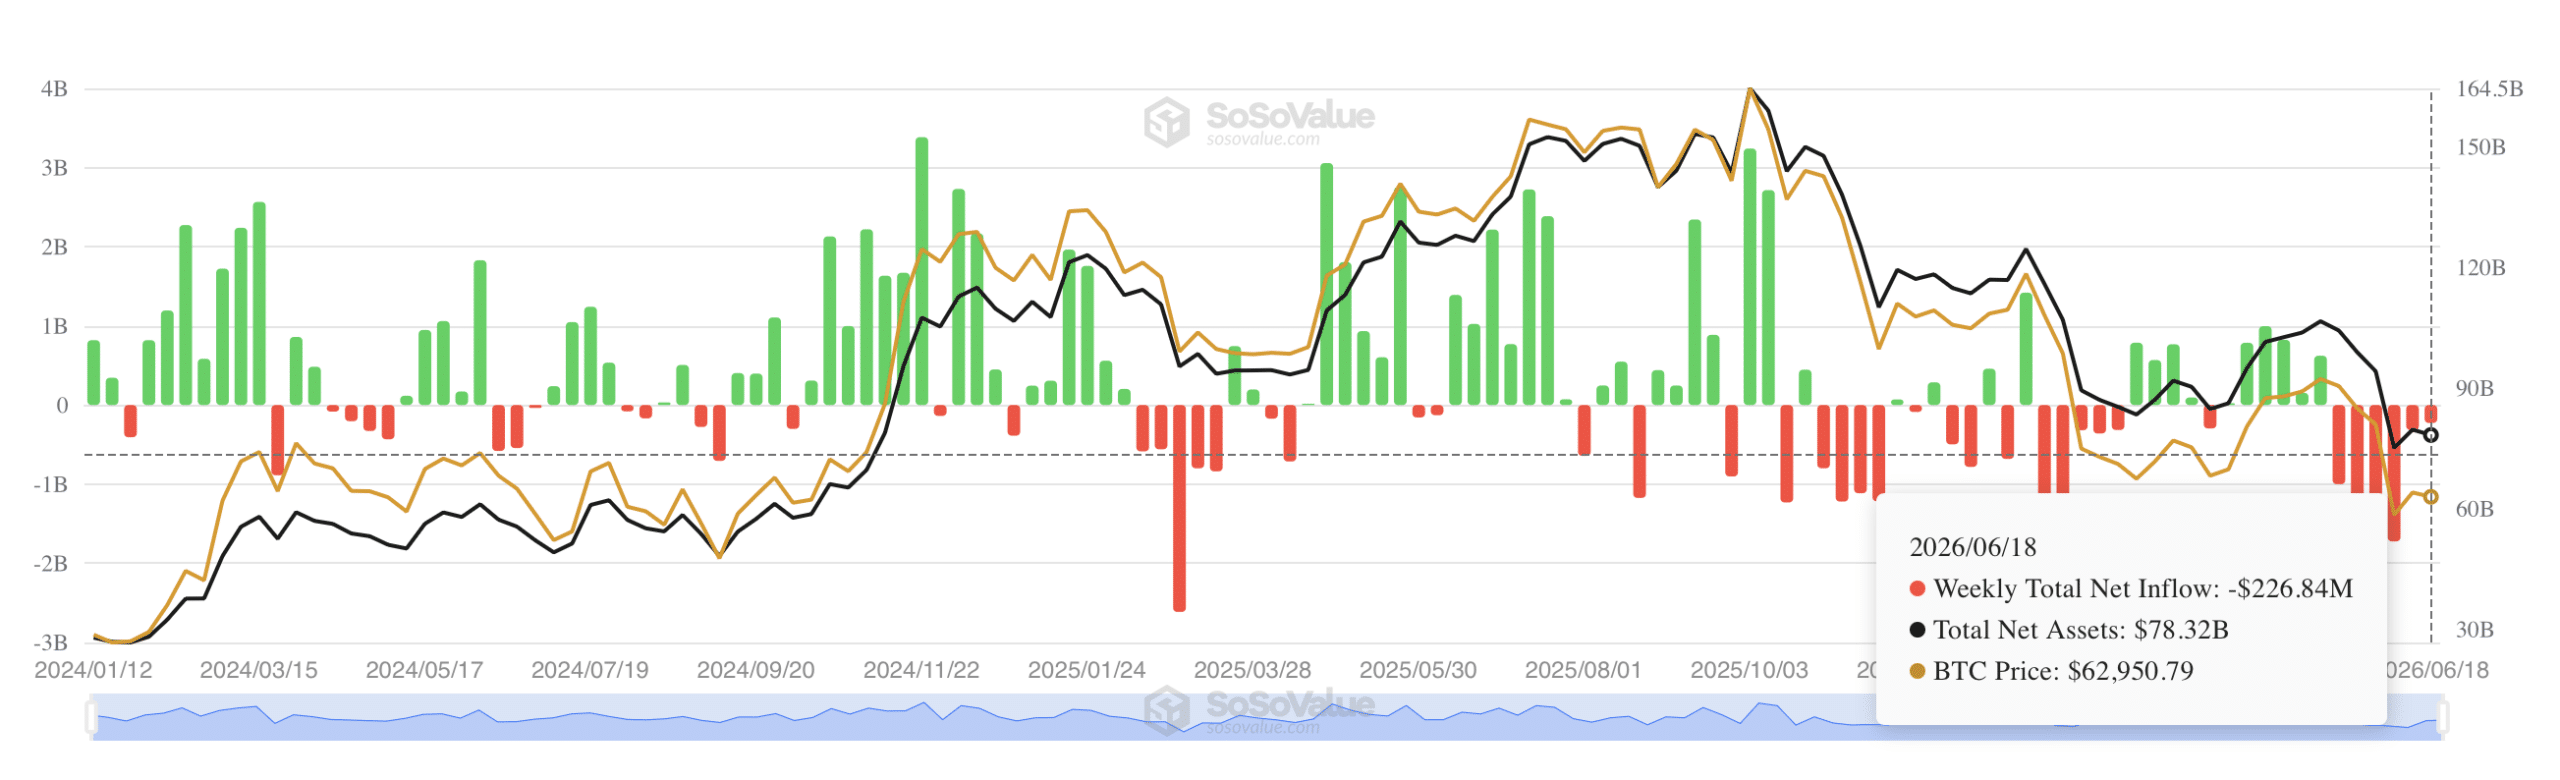
Source: Sosovalue
The U.S. market tells a more bearish story, where total netflow leaned toward selling. Investors there recorded a sell netflow of roughly $226.84 million, confirming that seller dominance persists.
Until clearer bullish demand emerges across multiple fronts, Bitcoin may stay subdued in the near term.
Final Summary
- Bitcoin may have already hit its low point for this cycle, with several long-term indicators flashing the same signal they did before past recoveries.
- If the pattern from 2023 plays out again, Bitcoin could climb around 76% from here, though heavy selling in the U.S. market is still holding it back for now.