Can Solana survive its latest slip under $70? These 2 metrics signal…
What happens when a $43 million whale short refuses to close?

Solana extended its decline for a fourth consecutive day after its recent recovery attempt lost momentum. SOL rallied from $63 to $76 last week before sellers regained control and triggered another pullback.
After facing rejection at $76, SOL lost the $70 support level and dropped to a low of $68.
At press time, Solana traded at $69, down 1.3% over the past 24 hours.
Meanwhile, Market Cap fell 1.4%, while Trading Volume rose 3%. The divergence suggested increased market activity as traders reduced exposure, pointing to stronger sell-side pressure.
What do Solana momentum indicators suggest?
Solana’s daily chart continued reflecting a bearish short-term structure. The altcoin fell below its 9-day Moving Average at $71.
Price also slipped beneath the MA Cross near $70. That move aligned with growing downside momentum.
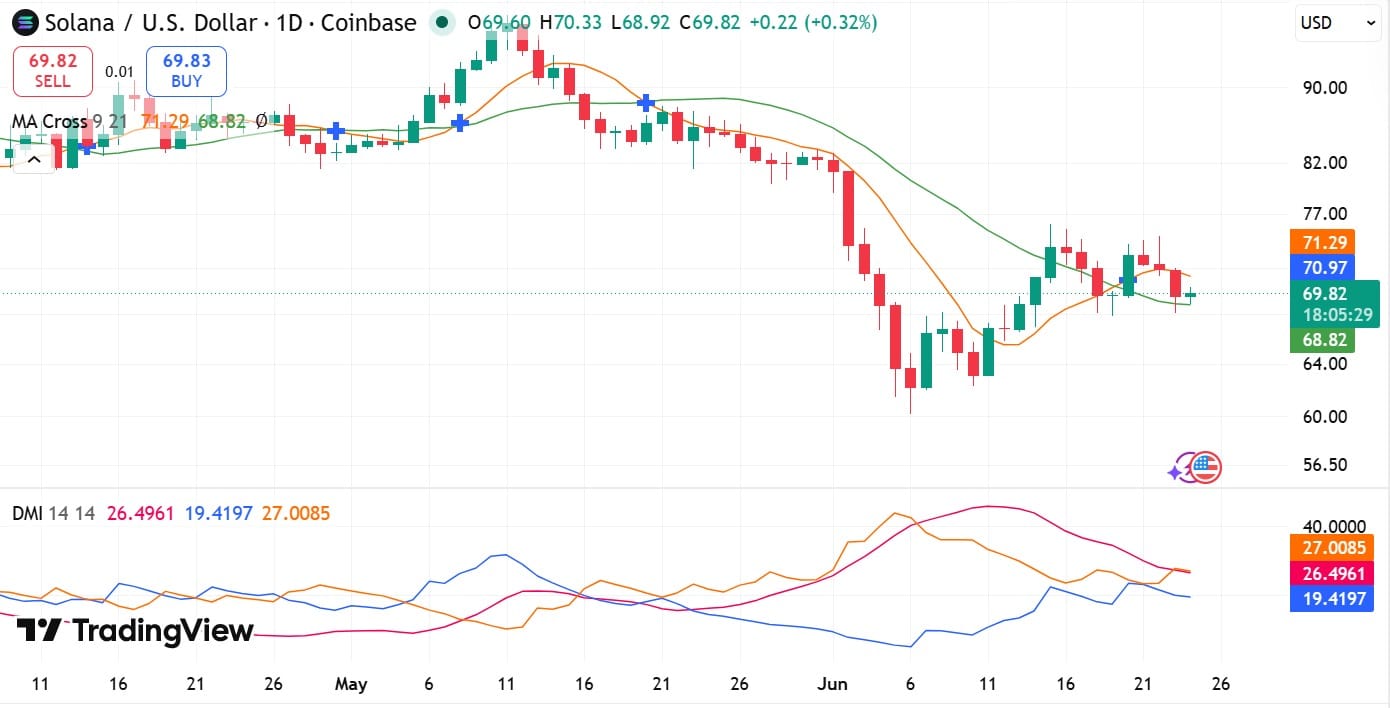
The Directional Movement Index reinforced that view.
The Positive Directional Index (+DI) dropped to 19, while the Negative Directional Index (-DI) climbed to 26. At the same time, the Average Directional Index (ADX) rose to 27.
Together, those readings suggested bearish momentum remained dominant.
Why are traders still undecided?
Despite the bearish setup, traders remained divided on Solana’s next move.
Onchain Lens reported that a whale expanded a 20x short position to 624,680 SOL, worth $43.4 million. The position remained underwater, showing a floating loss of $4.5 million.
Even so, the whale continued holding the trade, reflecting conviction in further downside.
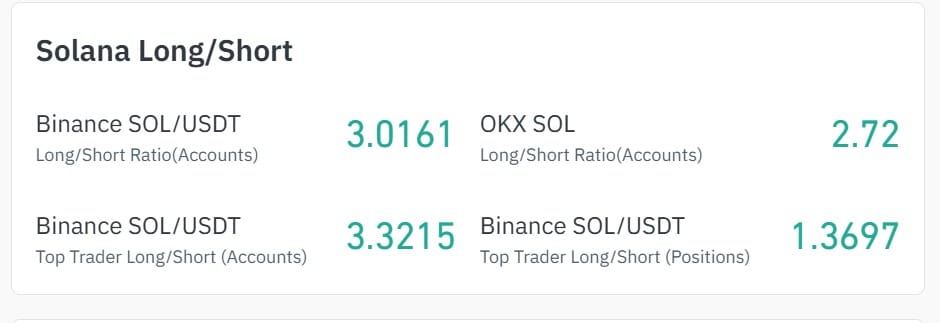
By contrast, smaller traders appeared more optimistic.
The Long/Short Ratio exceeded 3.0 on Binance and stood near 2.6 on OKX. That suggested many retail traders continued positioning for a rebound. This left traders focused on whether whales or retail participants would ultimately drive the next move.
Where does leverage risk leave SOL?
Rising futures activity pushed leverage higher across the market.
As whales increased bearish exposure, Cumulative Short Liquidation Leverage climbed to $128 million. For short sellers, $76 emerged as the key upside liquidation level.
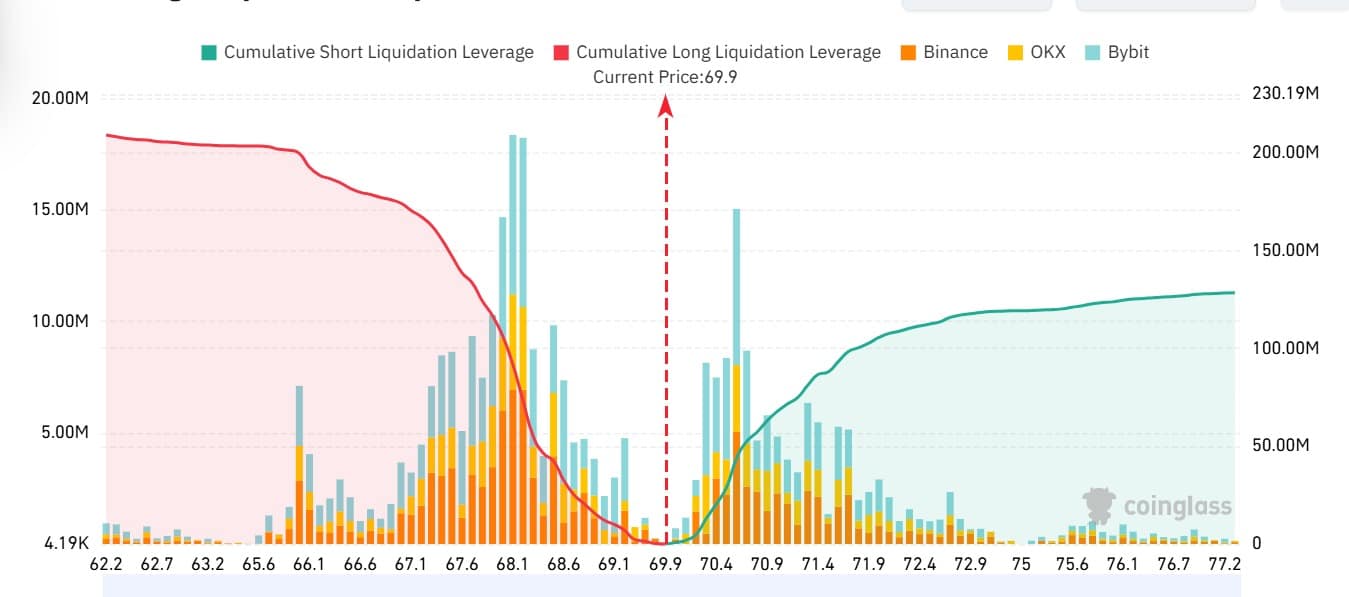
Meanwhile, Cumulative Long Liquidation Leverage reached $80 million. That shift made $68 the most important downside liquidation level.
As a result, $68 and $76 remained the key levels to watch.
A break below $68 could trigger long liquidations and accelerate losses toward $66. If selling pressure intensifies, $63 may become the next major support zone. However, a move above $76 could force short liquidations and open the path toward $80.
Final Summary
- SOL lost the $70 support level after its rebound toward $76 failed.
- A whale maintained a $43.4 million short position despite a sizable unrealized loss. Retail traders remained largely bullish, creating a split market outlook.