PEPE rebounds 26% in July – Should traders expect more upside?
The $0.000028-$0.0000032 area was an important area on the price charts for PEPE swing traders and investors.



Pepe [PEPE] has rallied by 9.77%, from $0.00000256 to $0.00000281, since the 9th of July. This bounce was within the larger bounce that began on the 1st of July and has taken the popular memecoin up 26% so far.
The trading volume in the past 24 hours has fallen by 47%, suggesting that the flurry of activity to end the weekend has begun to fade. Weekends generally see reduced trading volume, which can sometimes lead to heightened volatility.
Here’s what traders can expect from PEPE in July.
PEPE bounce has the potential to go much higher
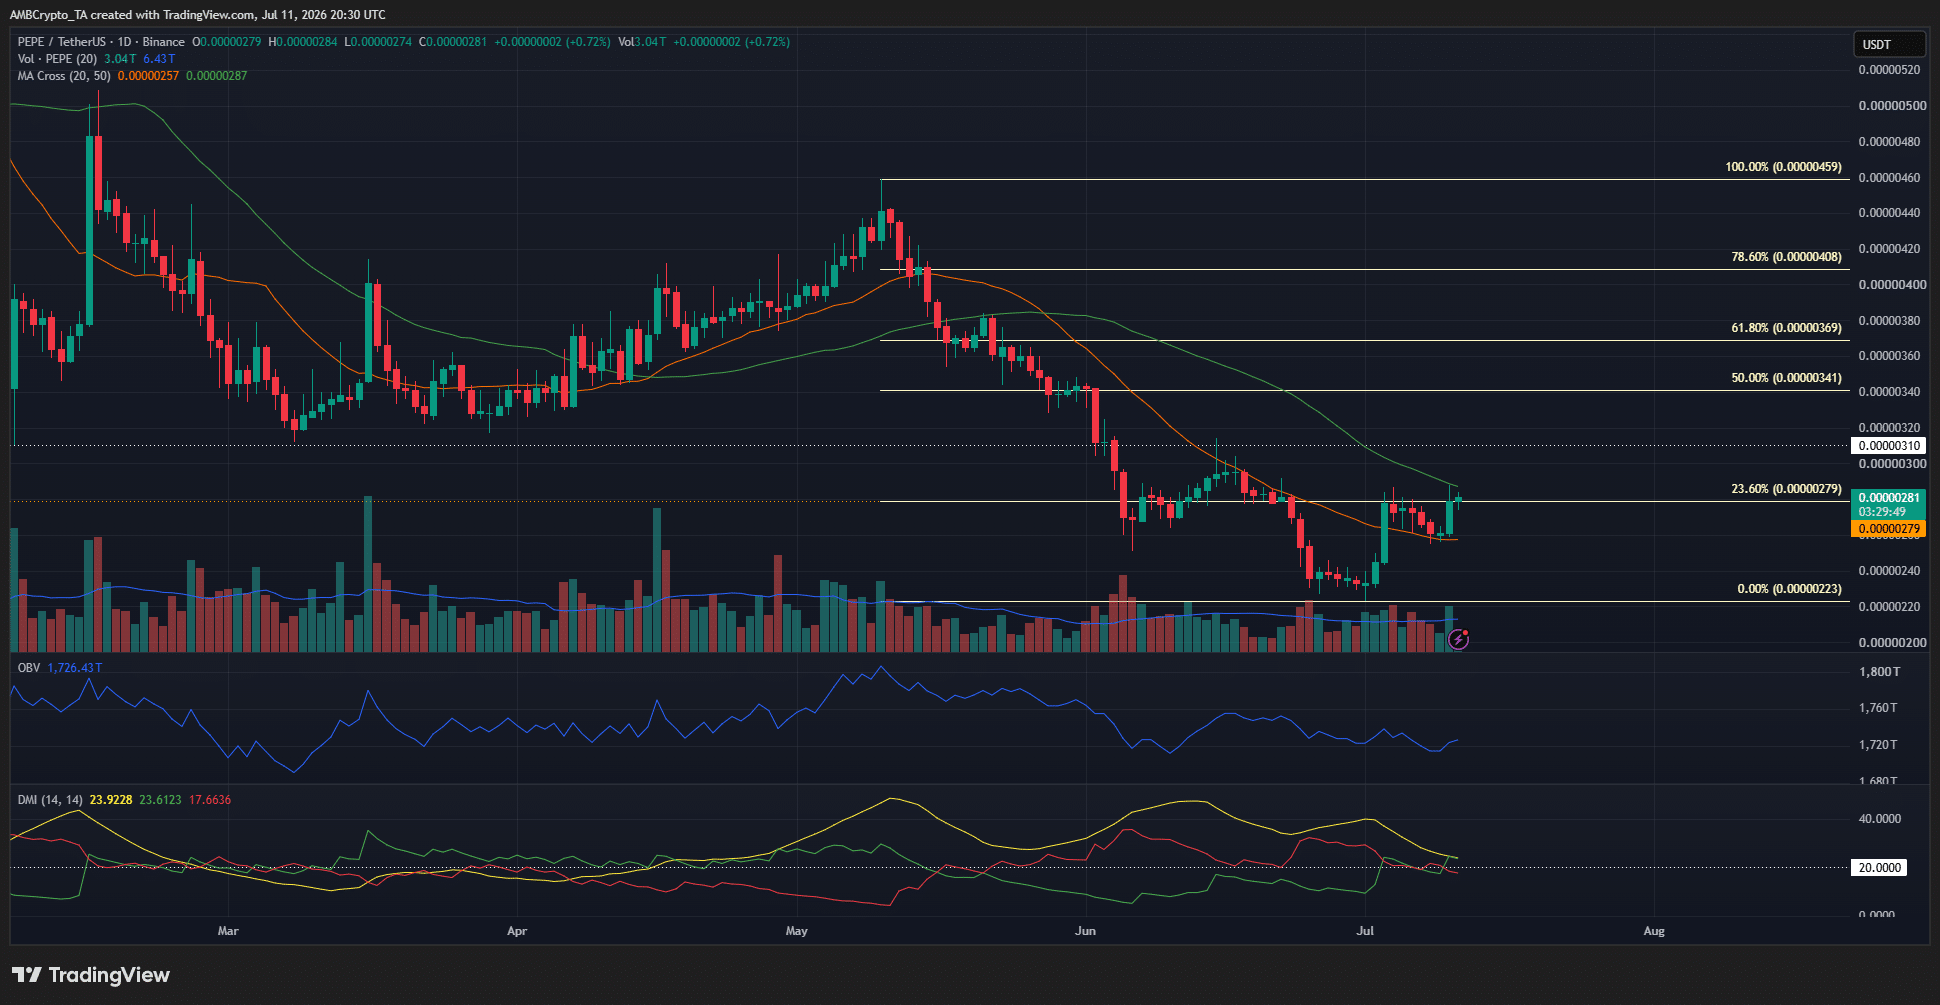
The Directional Movement Index saw the +DI climb above 20, and the ADX was also above 20. Together, they signaled that an uptrend was taking shape.
Yet, the price action on the 1-day chart was bearish. The swing structure was bearish; the memecoin was setting new lows and lower highs. Zooming out, we can observe that this has been the case since January 2025.
Even extended rallies, such as the 185% move from April to May 2025 or the 82.4% rally in four days in January 2026, have come within this broader bearish context.
The price was right below the 50-day Moving Average, testing it as a dynamic resistance. The OBV has struggled to make new highs since May, signaling a lack of buying pressure in the market.
If the 23.6% Fibonacci retracement level at $0.0000028 can be flipped to support, like in mid-June, there would be some chance for PEPE bulls.
Should traders sell PEPE now?
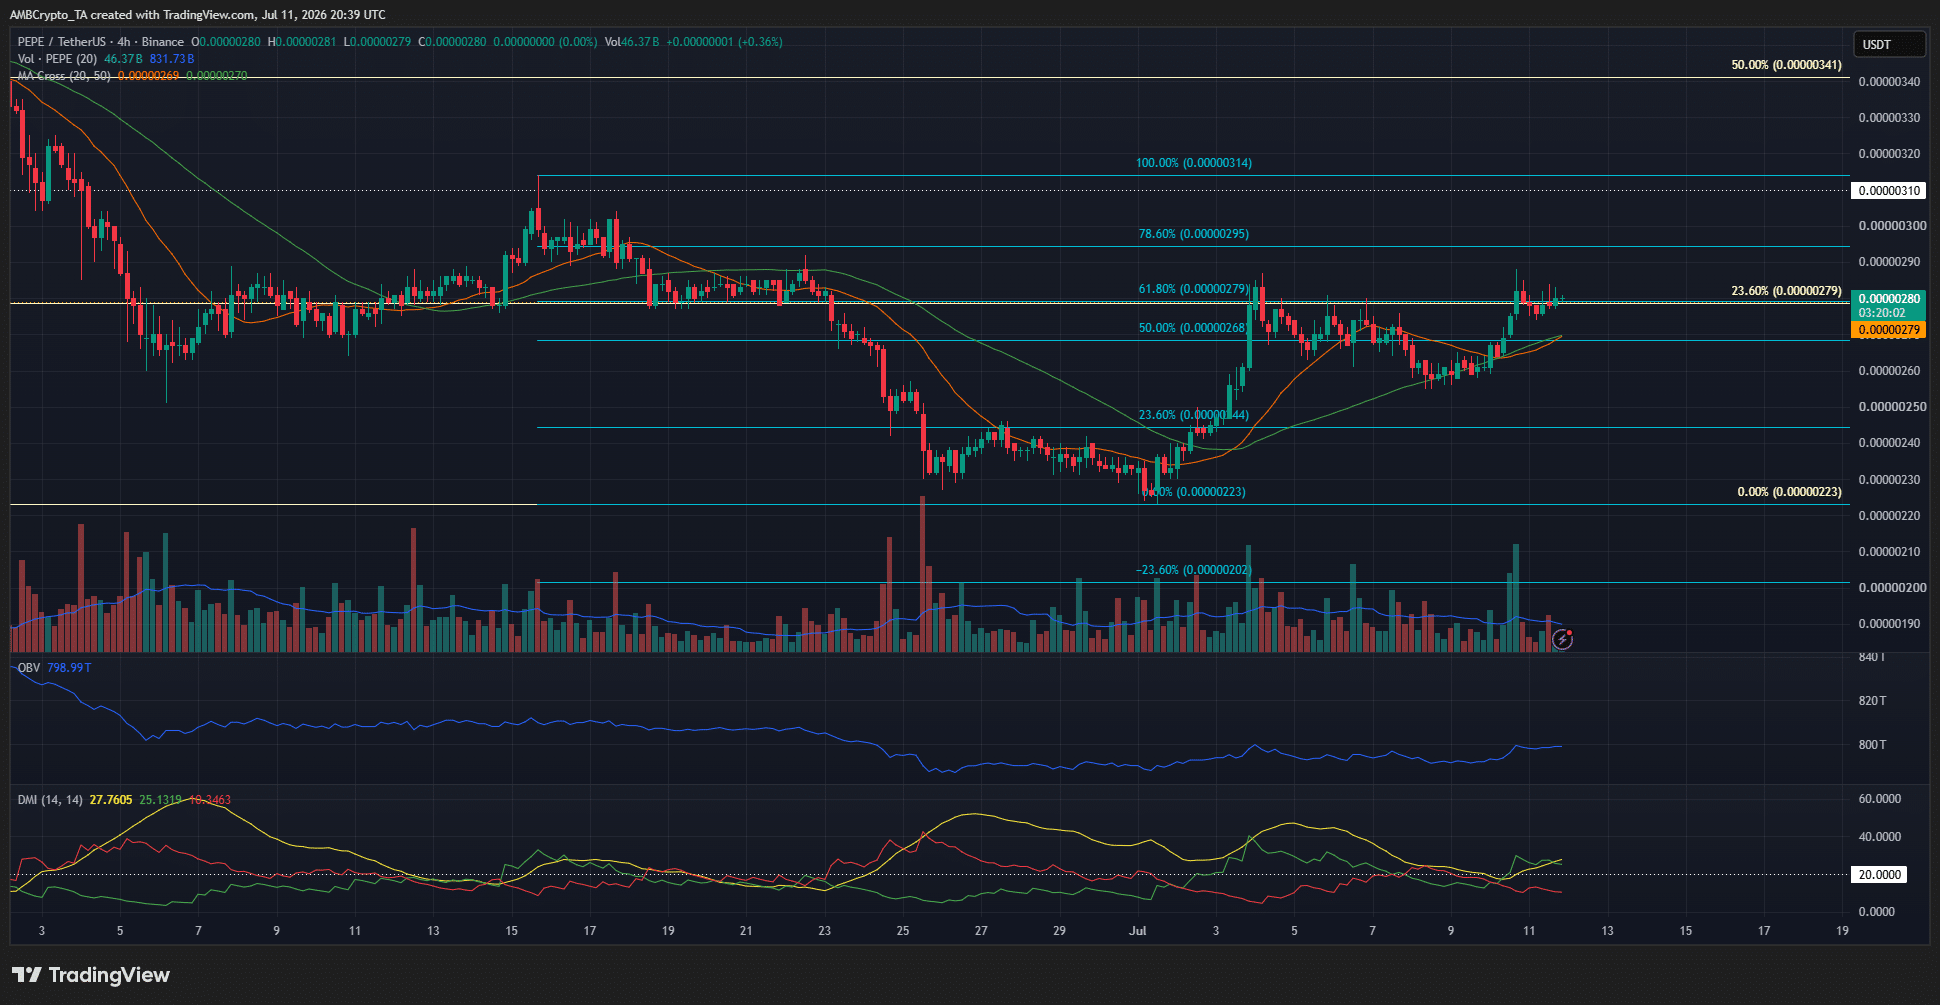
Based on the 4-hour timeframe’s swing structure, another set of Fibonacci retracement levels (cyan) was plotted. They showed that the 78.6% retracement level at $0.00000295 was a key resistance to watch out for.
Swing traders should expect the current bounce to end around the $0.0000030 resistance zone. This bearish idea would be invalidated upon an H4 session close above the $0.00000314 swing high.
Final Summary
- The PEPE price action was bearish in the higher timeframes, but there is potential for a sharp bounce.
- As things stand, the $0.0000030 area is likely to see the bearish trend take control once more.