Tutorial crypto: Why THESE metrics suggest TUT’s rally could fade
TUT may have rallied hard, but this is the moment for traders to pay closer attention.



Tutorial [TUT] has led the market’s gainers over the past 24 hours, surging 126% and lifting the asset to a market capitalization of roughly $906 million.
The rally has run for two straight days, with buyers dominating the market as the token trends higher. Volume climbing alongside price signals bullish conviction among traders, who may keep adding to their positions.
A sudden spike in accumulation has fueled much of the move, with the holder base expanding by 2,260 new addresses since the 8th of August and adding firepower to the rally. The climb in holder count likely reflects investors positioning for a probable extension of the upward move.
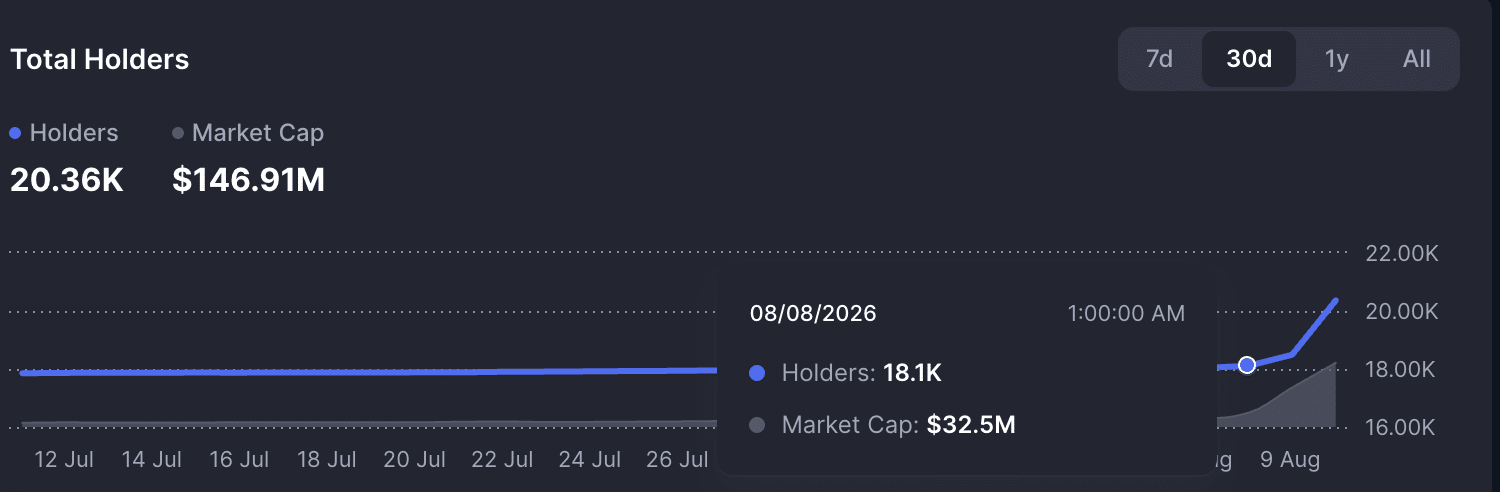
Concerns are emerging, however, over whether the BNB Chain-based token can hold its value or face a strong chance of decline in the days ahead.
TUT momentum fades as the Aroon and ASI turn bearish
The Aroon indicator, which tracks whether bulls or bears control the prevailing trend, points to a rising risk of decline.The indicator plots two lines to gauge that momentum, the Aroon Up in orange and the Aroon Down in blue.
At the time of analysis, the Aroon Up kept falling while the Aroon Down held higher on the chart. A sharp drop in the Aroon Up, like the fall to 57% seen here, typically signals sellers taking charge.
The Accumulative Swing Index reinforces the picture, showing growing seller strength as the reading has begun to decline over the past day.
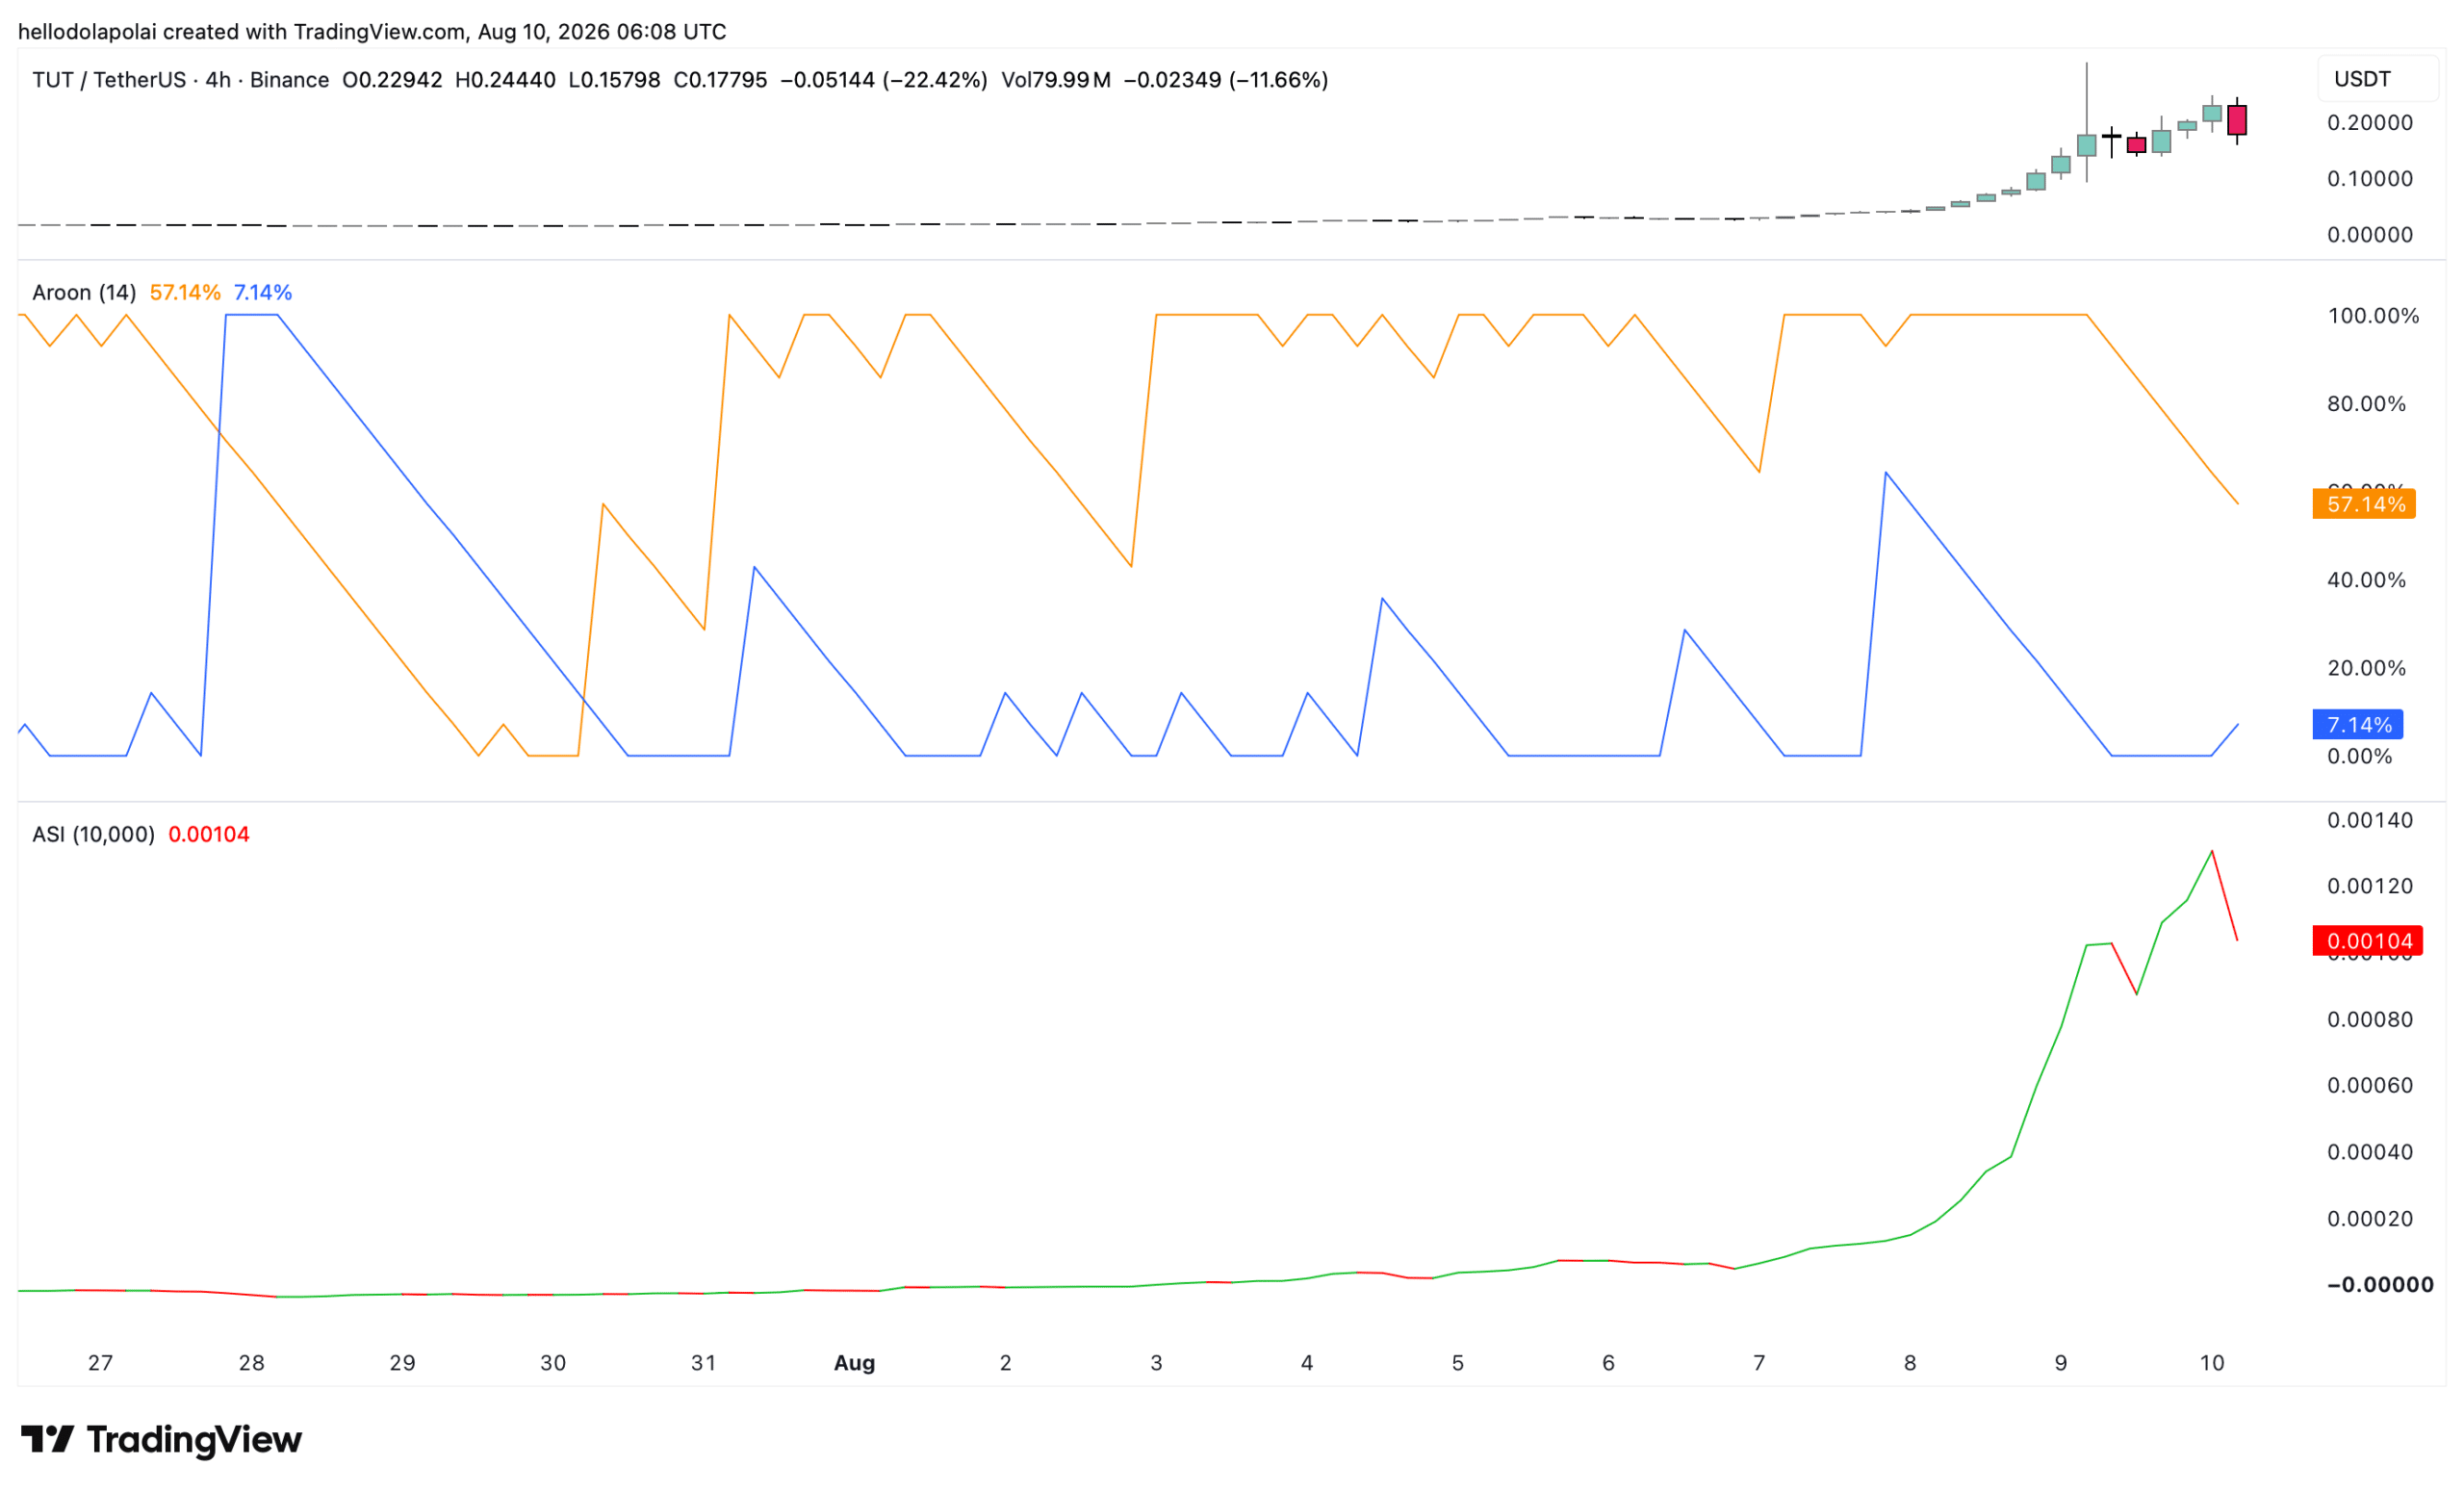
The index turned red after spiking green, showing sellers had overtaken buyers compared with the prior day.
The falling ASI points to heavier weighted selling volume, aligning with the Aroon indicator’s bearish read of weakening bullish momentum. Together, they suggest the market could face further declines over the coming days.
Altcoin season index leaves TUT little room to run
The broader altcoin backdrop remains weak, leaving only a slim chance of a sustained rally for now. The Altcoin Season Index supports this view, sitting at 36, well below levels typically associated with major market moves.
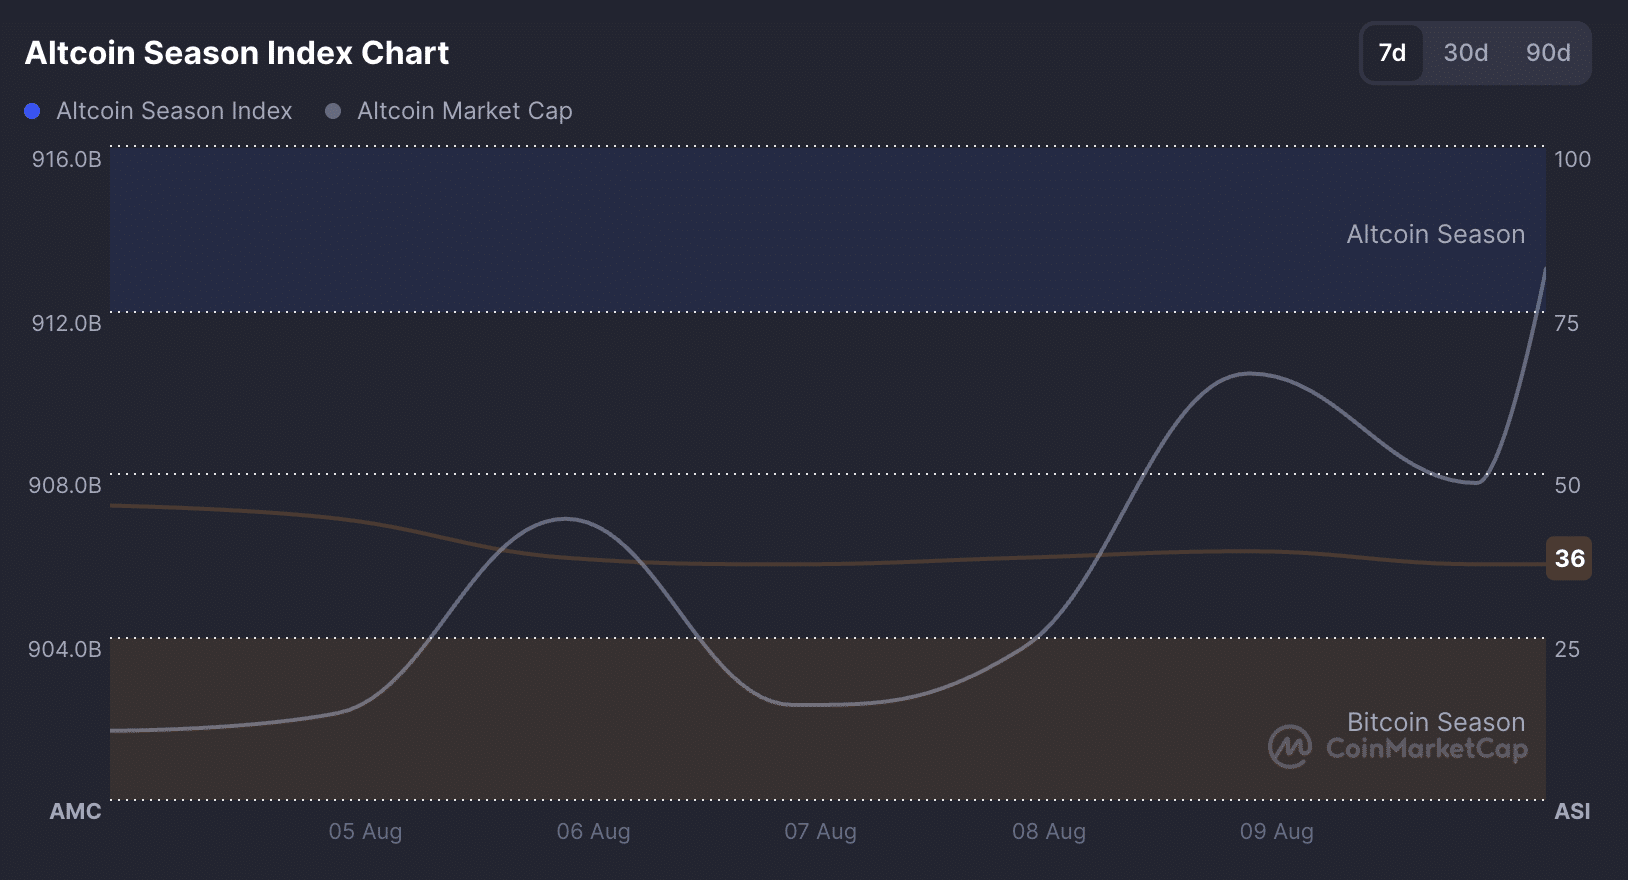
For TUT, this matters because weak utility can hurt liquidity when investors take profits and rotate into other assets.For now, the downside risk remains significant, with a pullback capable of erasing much of the gains built up over recent days.
Final Summary
- TUT has climbed 126% over two straight days to a market cap near $906 million.
- Fading momentum on the Aroon indicator and a declining Accumulative Swing Index, set against a weak Altcoin Season Index reading, point to a possible decline ahead.