Sui crypto price down 87% from all-time high: Has it finally bottomed?
The Sui crypto price action has had a bearish swing structure since November 2025.



Sui [SUI] has been stuck in a downtrend in the higher time horizon. It made an all-time high at $5.35 in January 2025. Three months later, the move had corrected by 68%, and by November 2025, the downtrend was officially confirmed.
The Sui crypto price is down 87.3% from its all-time high. Since June 6, the altcoin has hovered around the $0.67-$0.77 area on the price charts.
Is this consolidation phase a good time to buy the Layer 1 token, or should investors wait for another sell-off?
Clues from the long-term SUI crypto price trend
On the face of things, a two-month consolidation phase around $0.70 appeared to signal a good buying opportunity. At the same time, Bitcoin [BTC] stubbornly clung to the $60k psychological support area.
This could be a market bottom, but it is too early to be certain. What is certain is the bearish swing structure of SUI.
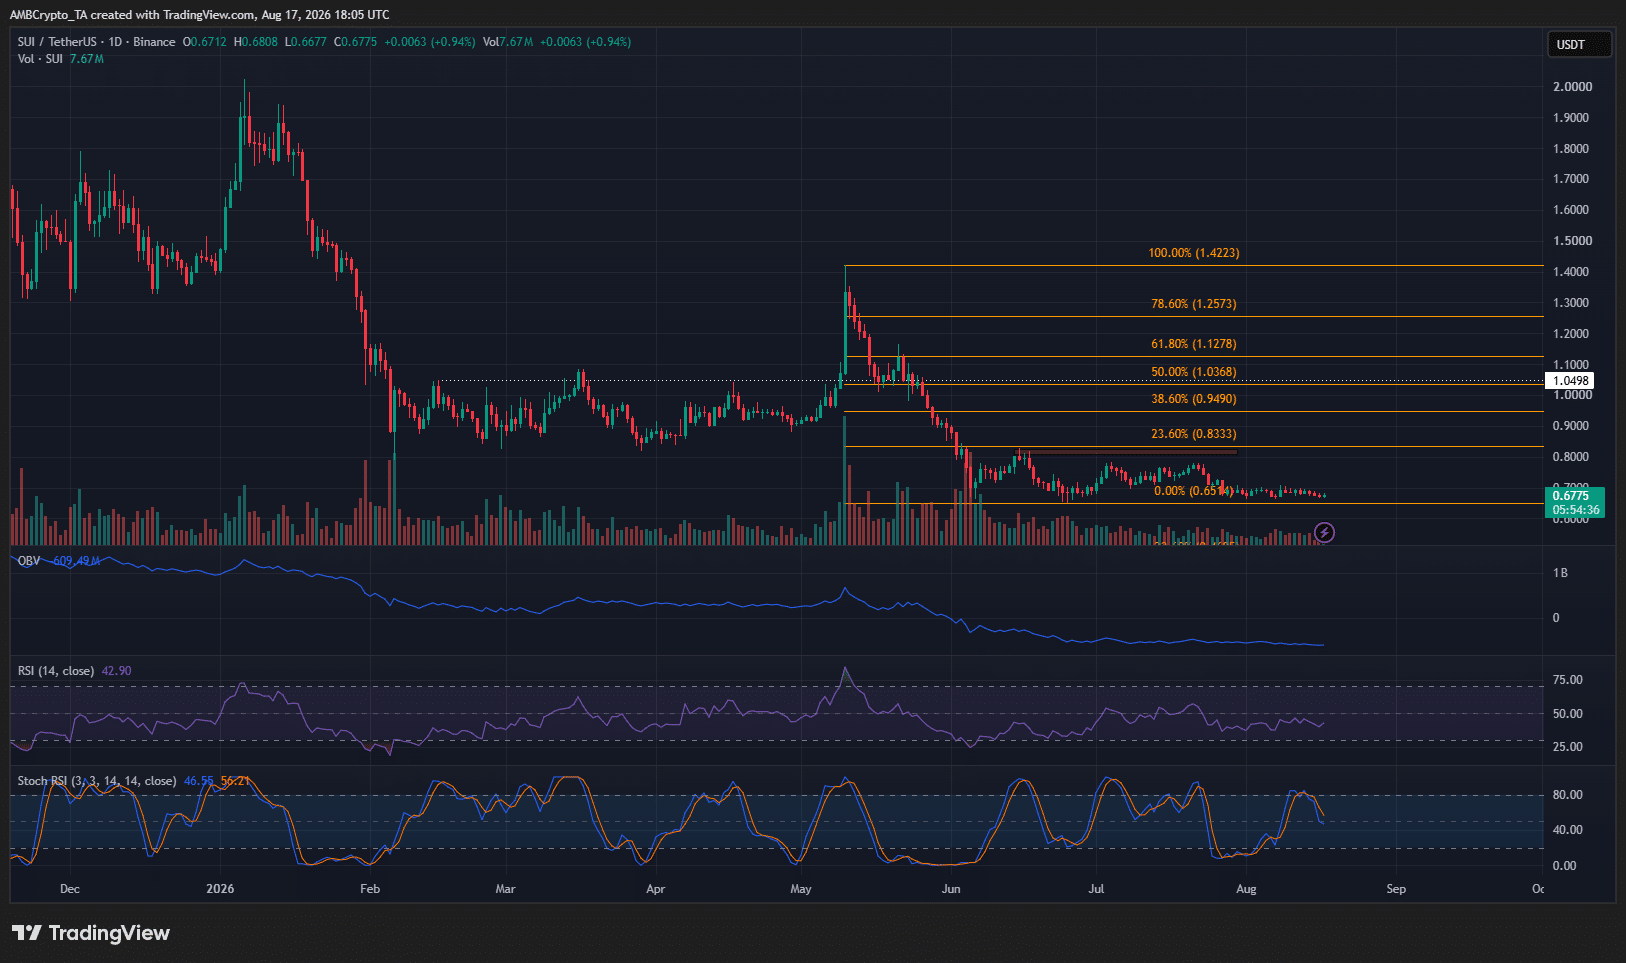
The consolidation phase is clear, and so is the bearish swing structure. The $0.833 supply zone is the 23.6% retracement phase, a good distance away from the golden pocket at $1.12-$1.25.
The OBV has been flat for over a month, and the RSI has struggled to cross over above neutral 50. This meant weak buying pressure and a lack of sustained upward momentum.
In recent days, the Stochastic RSI has formed a bearish crossover, signaling further drawdown is possible.
From February to early May, too, the Sui crypto price action appeared to be in a consolidation phase. A strong bullish breakout on high volume reached $1.42, which was sold off in the following weeks.
It is possible that another such bullish surge, followed by severe selling, could occur in the coming weeks.
Traders’ call to action- Pay attention to the magnetic zones
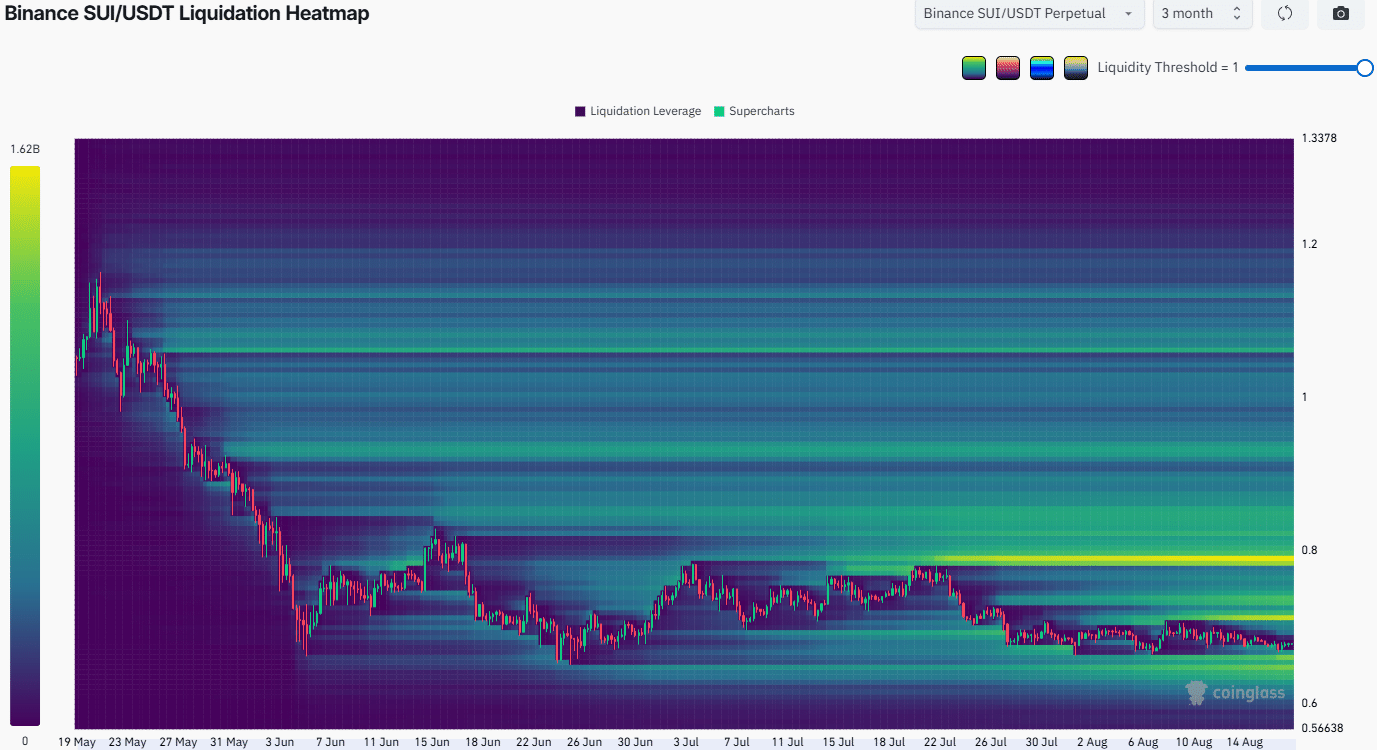
The lack of buying pressure meant that a drop to new lows below $0.65 is possible. This is also an area of considerable long liquidations, making it an attractive target for the Sui crypto price to sweep.
Overhead, the $0.78 area was another notable liquidity cluster. It coincides with the local supply zone, too.
Swing traders should beware of a surprise rally higher, but as things stand, a bounce toward $0.80 would offer a selling opportunity, as would a breakdown below $0.64.
Final Summary
- The Sui crypto price action has had a bearish swing structure since November 2025.
- The token’s extended consolidation phase was similar to the one it saw from February to early May that was broken by a strong price rally.