Bitcoin jumps 23% amid $4B crypto short squeeze – Is BTC’s bottom in?
Did Bitcoin find a bottom, or merely discover how crowded the short trade had become?



Since Monday, the 17th of August, Bitcoin [BTC] has rallied by 22.9%.
The leading crypto has moved from $62,900 to trade at $77,306 at the time of writing. This move was fueled by heavy buying pressure and capital inflow to the market, alongside enormous short liquidations.
According to CoinGlass data, the crypto market witnessed $2.739 billion in short liquidations on the 19th of August, and another $1.265 billion liquidation wave on the 21st of August.
It was by far the two biggest short liquidations in 2026. The RSI on the 4-hour timeframe was extremely overbought, reaching historical extremes for a sustained period.
What is the Bitcoin market’s next move?
The week of relentless rally saw the cumulative short liquidations on Binance take the lead over the cumulative long liquidations. Analyst Boris noted that the cumulative short liquidations measured $7.739 billion, overtaking the $7.582 billion for the longs.
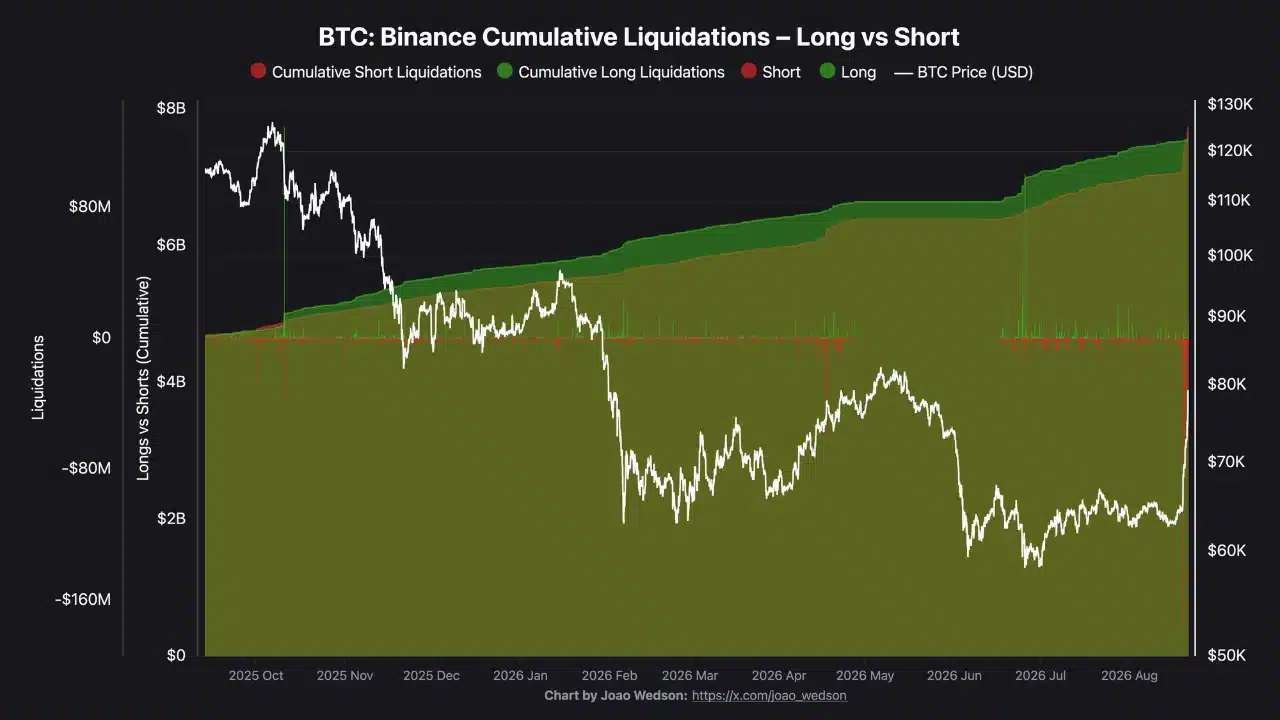
This was the first such overtake since the October 2025 short squeeze that pushed Bitcoin prices to an all-time high, before the sell-off later in the same month.
The pace of the rally has caught the market unawares and punished the bears.
The question that remains is: will the long positions also be similarly punished? Will the market gravitate back toward the liquidity that has pooled around $60k?
In a post on X, veteran trader Killa explained why the market regime might have seen a decisive shift. Short positions have been completely obliterated, an outcome that generally doesn’t accompany bear market conditions.
Instead, what we would expect is a more controlled bounce that gets sold off quickly, “designed to protect short exposure”. An explosive rally that so violently squeezes short positions marks a trend transition, the trader argued.
Examining the Bitcoin price structure
Be that as it may, the 1-day timeframe revealed that the bearish swing structure was still in place.
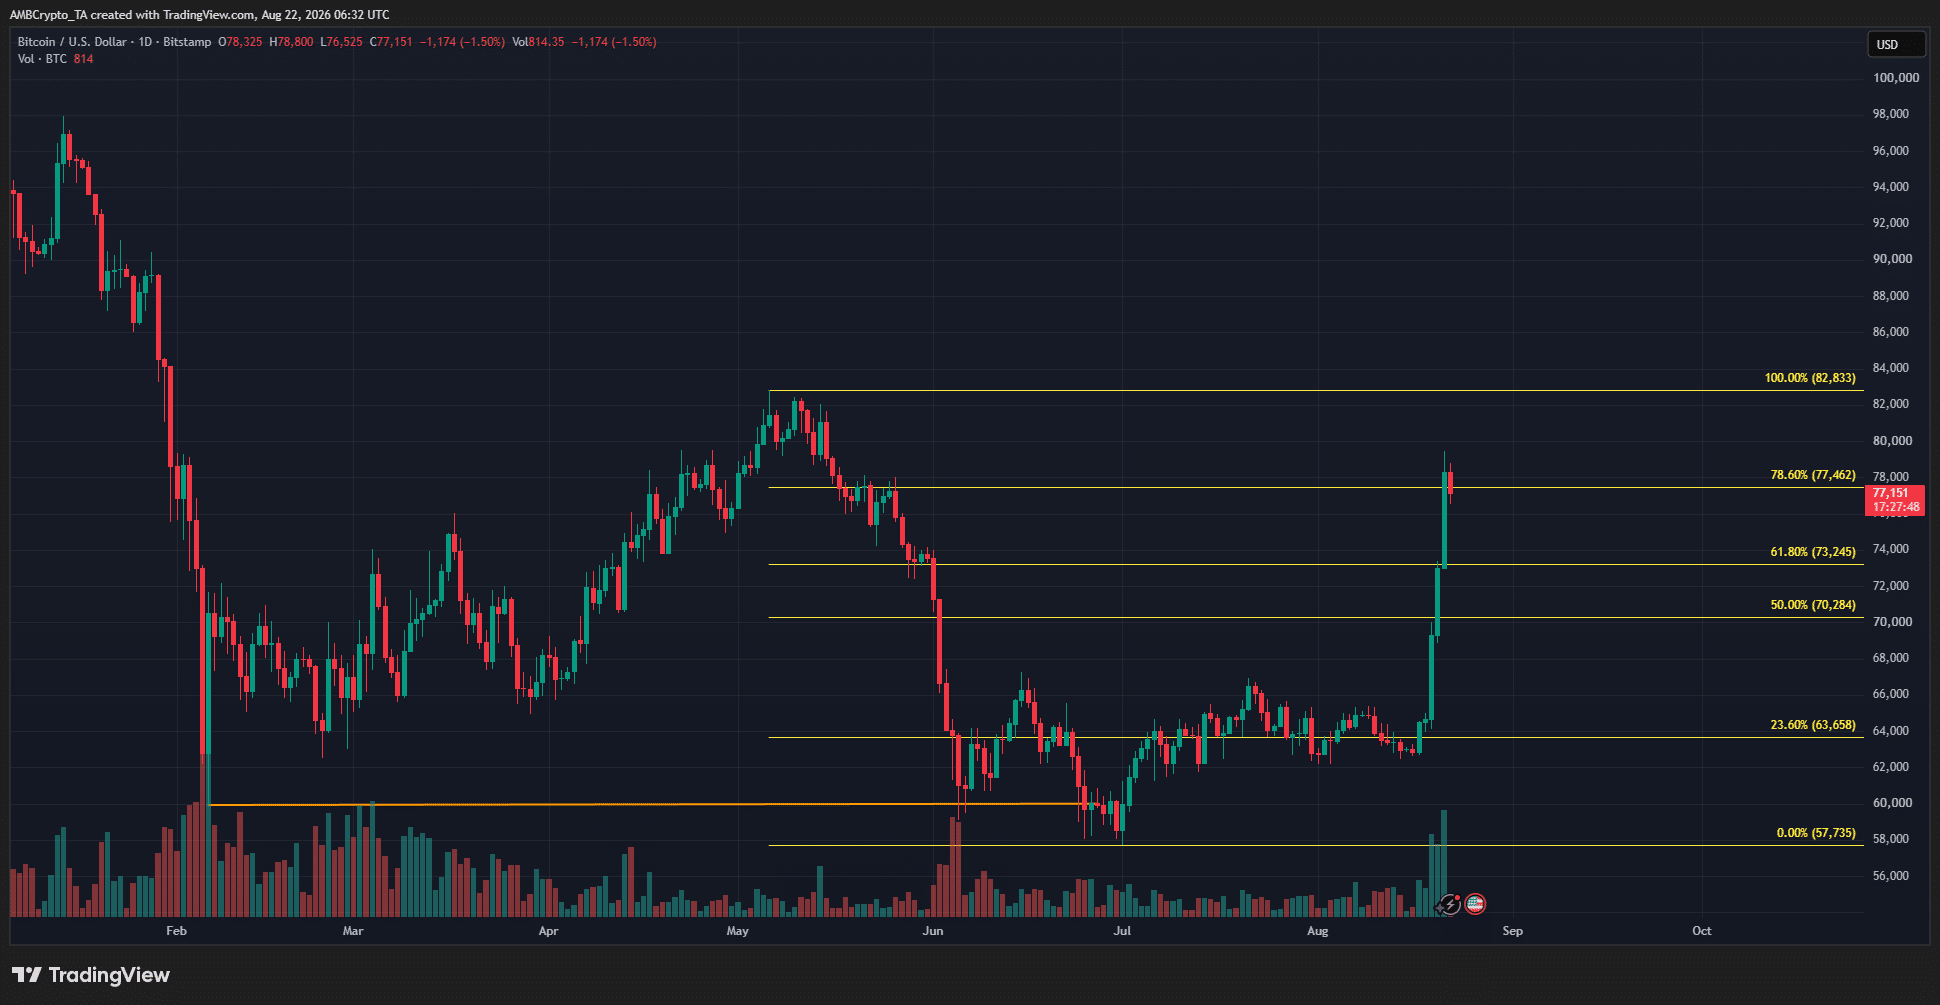
The Fibonacci levels (yellow) highlighted the 78.6% retracement level at $77,462 as a key supply zone. Another critical level is the swing high at $82.8k. If breached, the structure would flip bullishly, and a pullback would be for buying.
Only time will tell if we have seen the market bottom and a trend transition is already underway. For traders and investors, risk management is of utmost importance now. Rushing to buy due to FOMO could be painful, as can revenge shorting.
Final Summary
- The intense rally of the past week saw heavy short liquidations act as jet fuel for the bullish move.
- Analysts and investors were debating if the move marked an upward trend transition, or if bear market conditions persist.