TRUMP jumps 37% in 24 hours, rallies to $2.55: Has the bear market finally broken?
TRUMP has rallied over 80% in a week, and its daily trading volume has surged sixfold.



The Official Trump [TRUMP] token has rallied by 37% in the past 24 hours and is up 80.3% in a week. The swift Bitcoin [BTC] rally beyond $75k has given the wider altcoin market hope and induced sizable capital inflows in both Spot and Perpetuals markets.
Despite being a weekend, when Spot volumes are expected to slump slightly, market sentiment was blisteringly bullish. This was evidenced by the whopping 625% increase in daily trading volume, per CoinMarketCap data.
On Thursday, the 20th of August, U.S. President Donald Trump announced plans to purchase a significant amount of Bitcoin and other crypto assets. Surprisingly, the TRUMP token had rallied up to $1.865 on the day of the announcement but saw a minor setback.
Since briefly dipping to $1.60, the memecoin has rallied by 60% and was trading at $2.55 at the time of writing. In a matter of days, the bearish long-term trend dating back to February 2026 was structurally breached.
How much higher can TRUMP go next week?
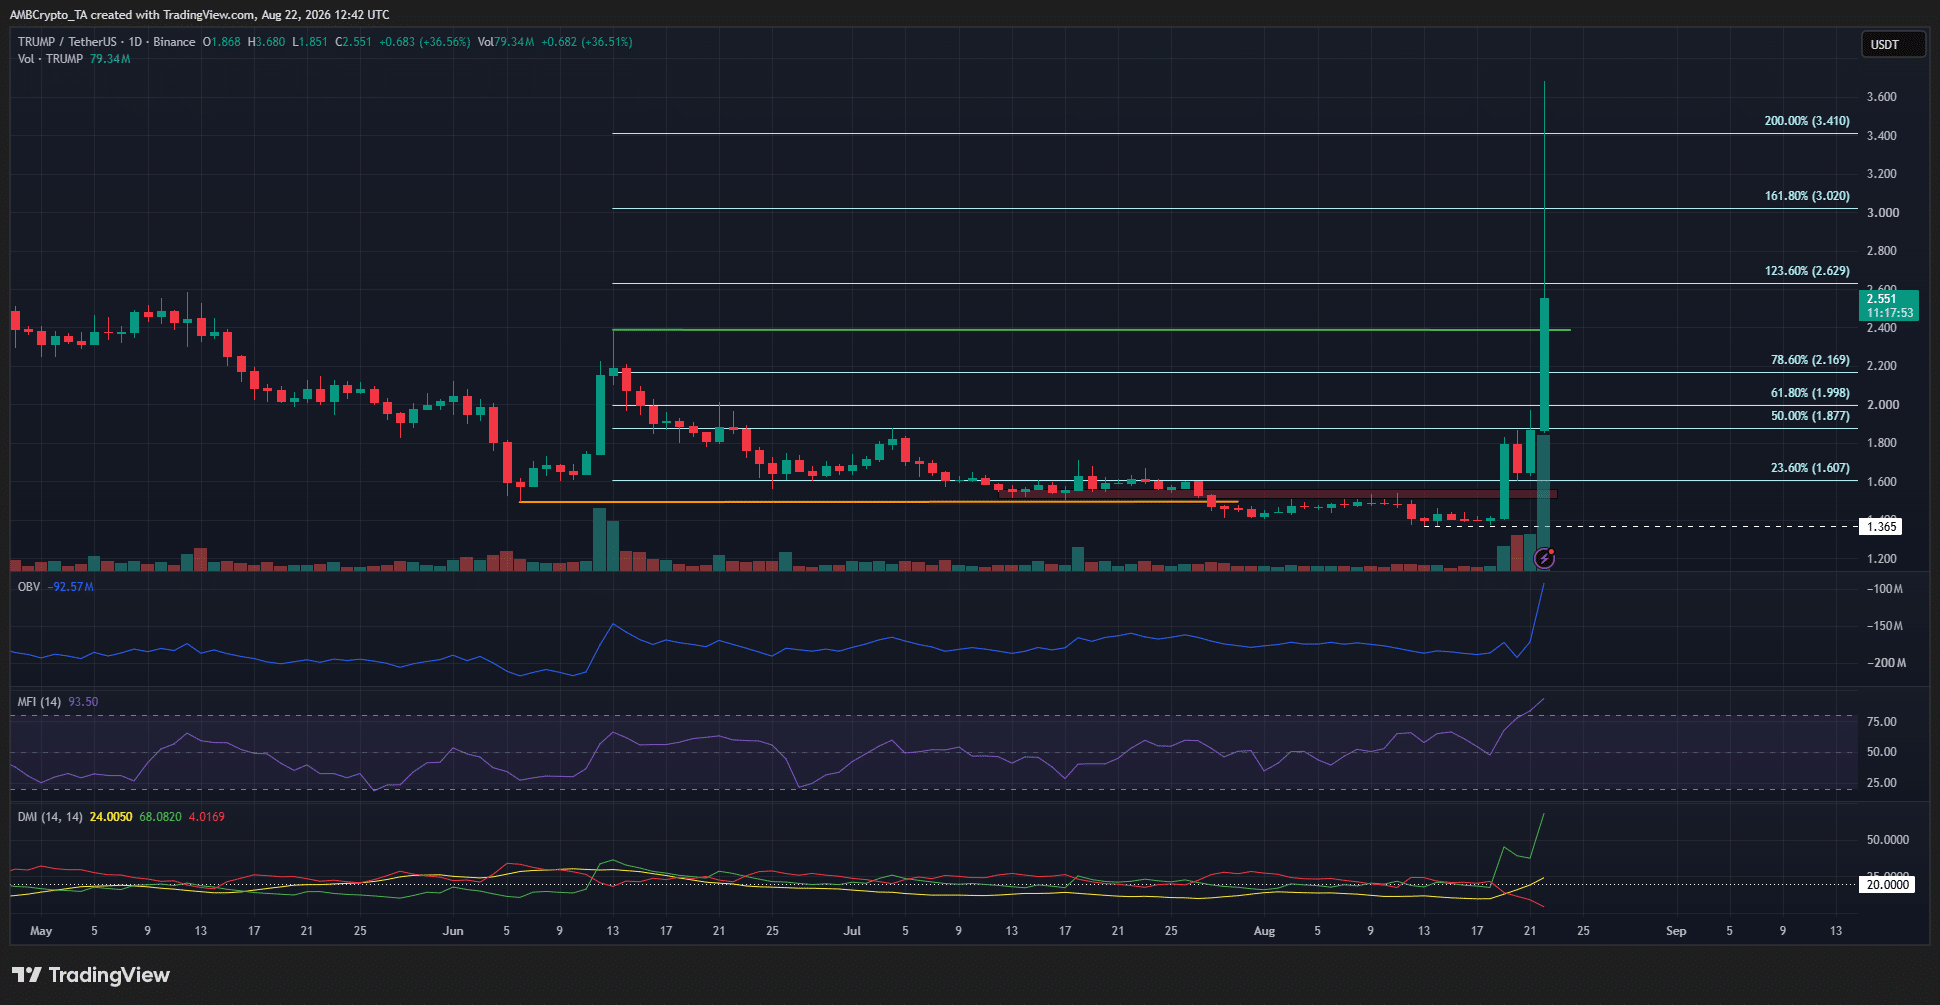
The 1-day timeframe’s bullish swing structure break (green) was not yet confirmed at the time of writing. A daily session close above $2.38 is needed to flip the structure.
On the other hand, the technical indicators were wildly bullish. The OBV made multi-month highs, as did the Money Flow Index, with its overbought reading of 93.5.
The Directional Movement Index also showed a strong uptrend in progress.
Traders’ call to action – Wait for a pullback
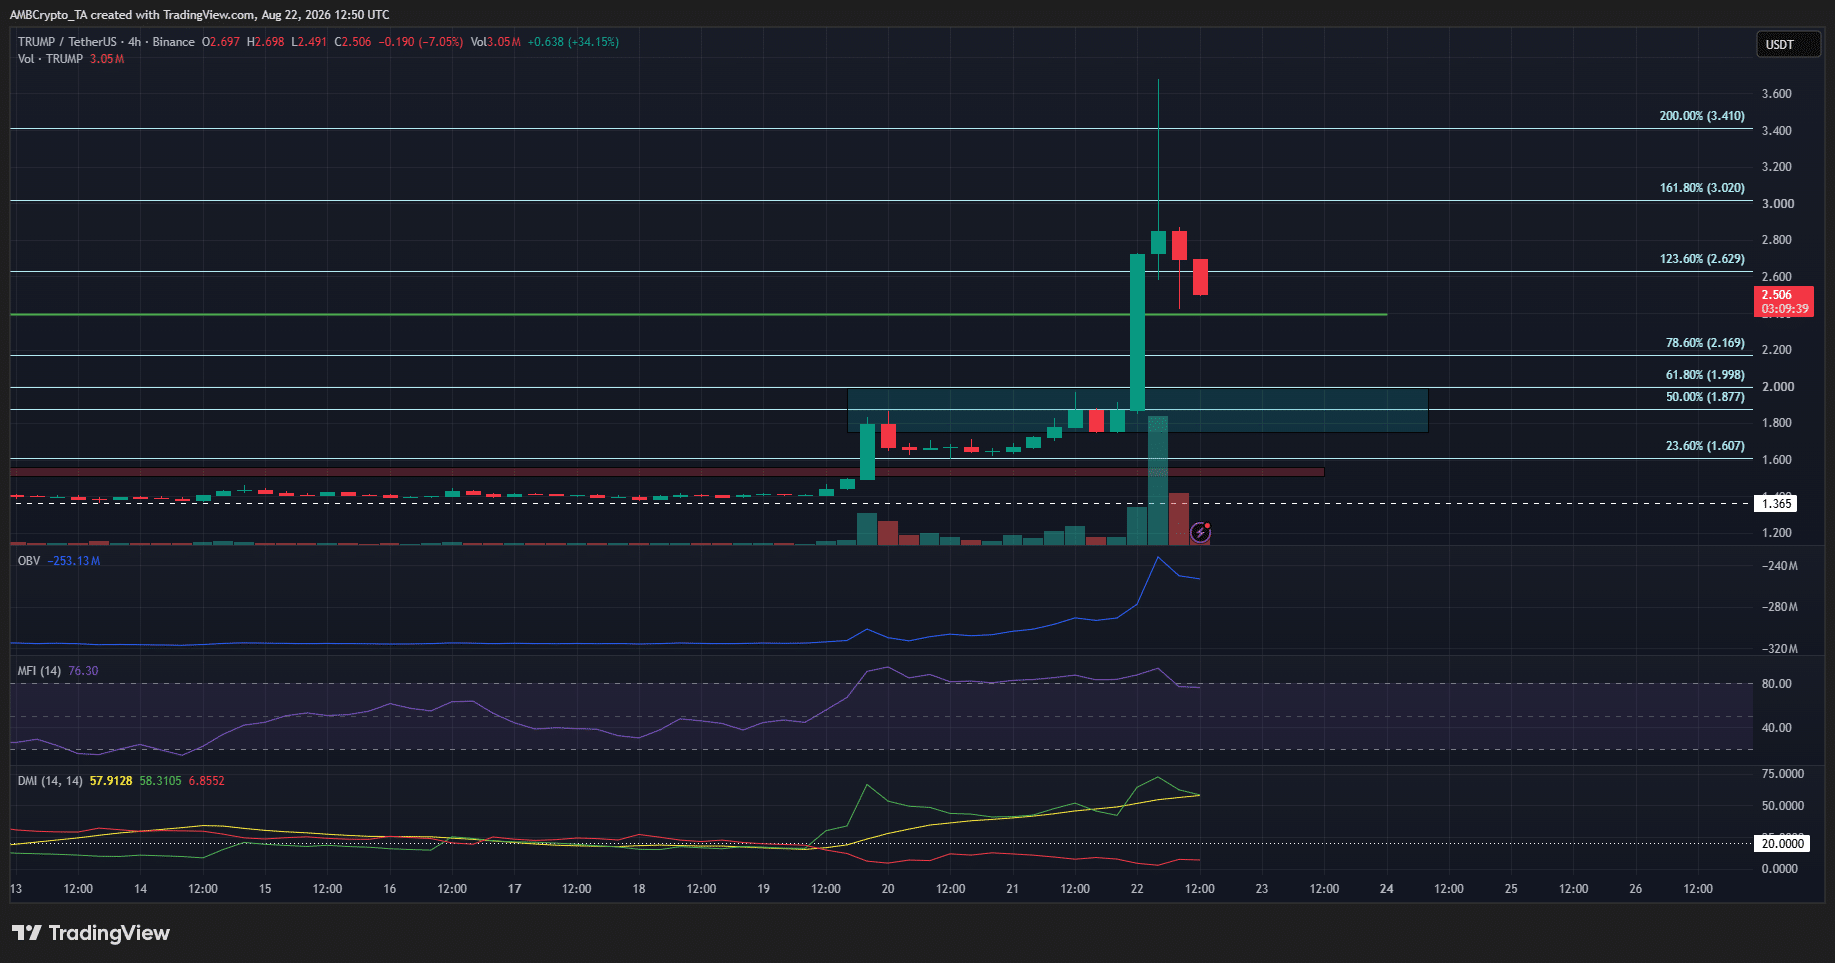
The 4-hour timeframe’s indicators were also tremendously bullish. It is possible that the market is overextended and would see a pullback.
A deep pullback toward the $1.8-$2.0 area (cyan box) would be an ideal buying opportunity, given the bullish structure shift on the daily chart and the recent momentum.
At the same time, bullish traders and investors must rein in their euphoria. Like the mid-March rally of 40% in three days, there is a slight chance that the current rally would also be aggressively sold off.
In the bearish scenario, a TRUMP price drop below $1.60 would be a strong sign that bears were taking control. Until then, the $2.0 support zone is one to watch.
Final Summary
- TRUMP has rallied over 80% in a week, and its daily trading volume has surged sixfold at the time of writing.
- The price structure was bullish, and a retracement toward $1.8-$2.0 would likely present a buying opportunity.