Bitcoin Cash Spot demand stays weak for 10 days – But overheating signals emerge
Bitcoin Cash follows the broader market trend, but investors still need to remain cautious.



Bitcoin Cash [BCH] saw an 18% surge in price over the past day. However, in a broader context, the move remains relatively small, as the asset has yet to recover after losing more than 52% over the past 90 days.
While the rally continues, leverage remains a growing concern as it largely drives the current run and could leave price vulnerable to a significant pullback. This leaves BCH at risk of a further decline despite its present bullish outlook.
BCH may be overvalued, risking a decline
The market appears heated, with longs dominating capital and liquidity in the perpetual market, while the Spot market has failed to match the demand.
The perpetual market saw a massive surge in the Funding Rate on the chart, with the reading jumping to 0.0102%, indicating that there’s been a major increase in the number of long positions in the market.
In fact, at the peak on the 21st of August, the Funding Rate hit 0.0210%, as longs kept paying the funding fee to maintain price disparity.
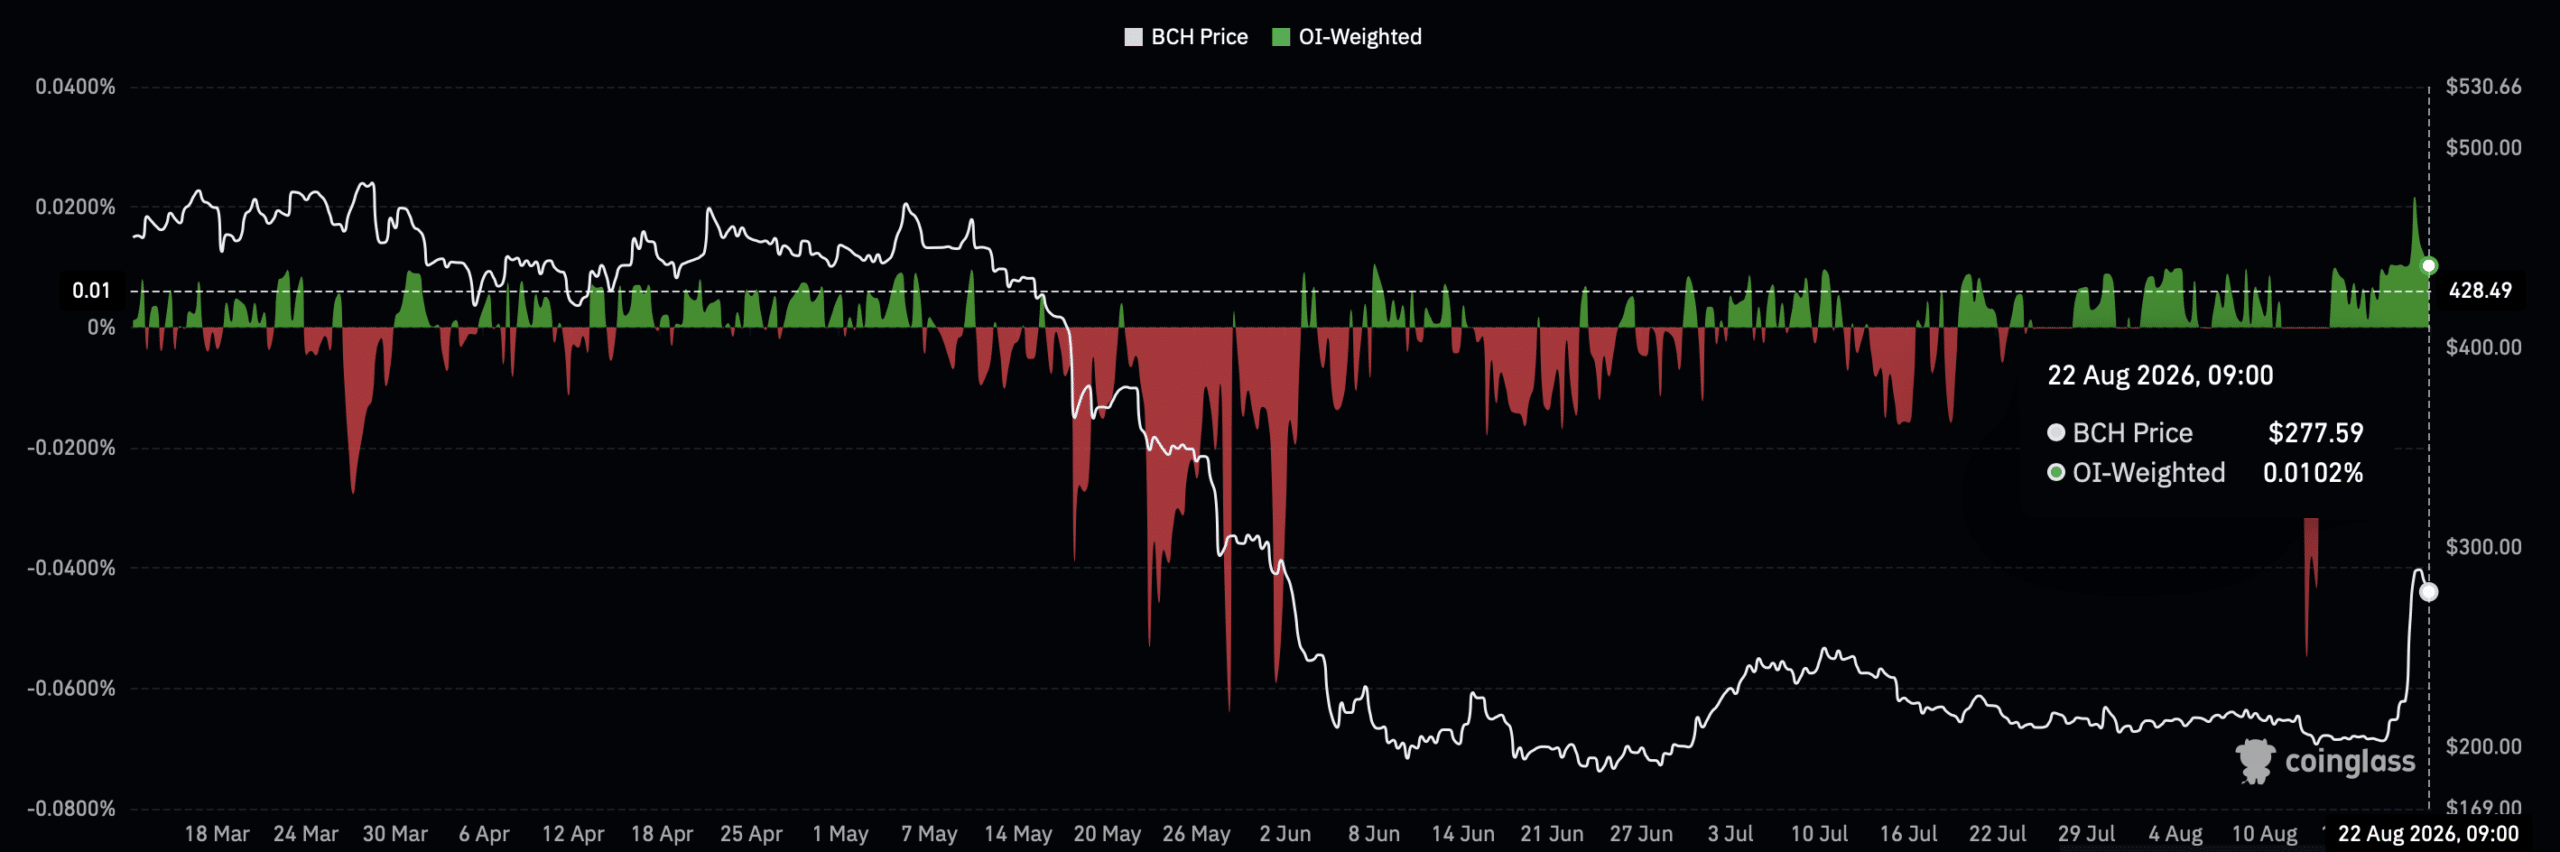
Interestingly, the perpetual market capital also expanded, with Open Interest surging 13% to about $567 million at the time of writing.
The perpetual market’s positive outlook isn’t concerning on its own, but the weak Spot market raises questions about whether traders have overheated the market.
The Spot market has seen very minimal demand, which shows that the price may struggle to sustain its present level.
This is because there’s been more selling than buying, which has lasted 10 days straight, with a netflow of about $33.39 million within that period.
Price could still move higher
There’s a clear sign that BCH may, in fact, trend higher based on the reading of the liquidation heatmap.
The heatmap shows unfilled liquidity clusters above the current price, with sell orders that could potentially push BCH toward $315.
While this is no guarantee that price would move in that direction, areas of dense liquidity clusters like this tend to have a strong pull on price.
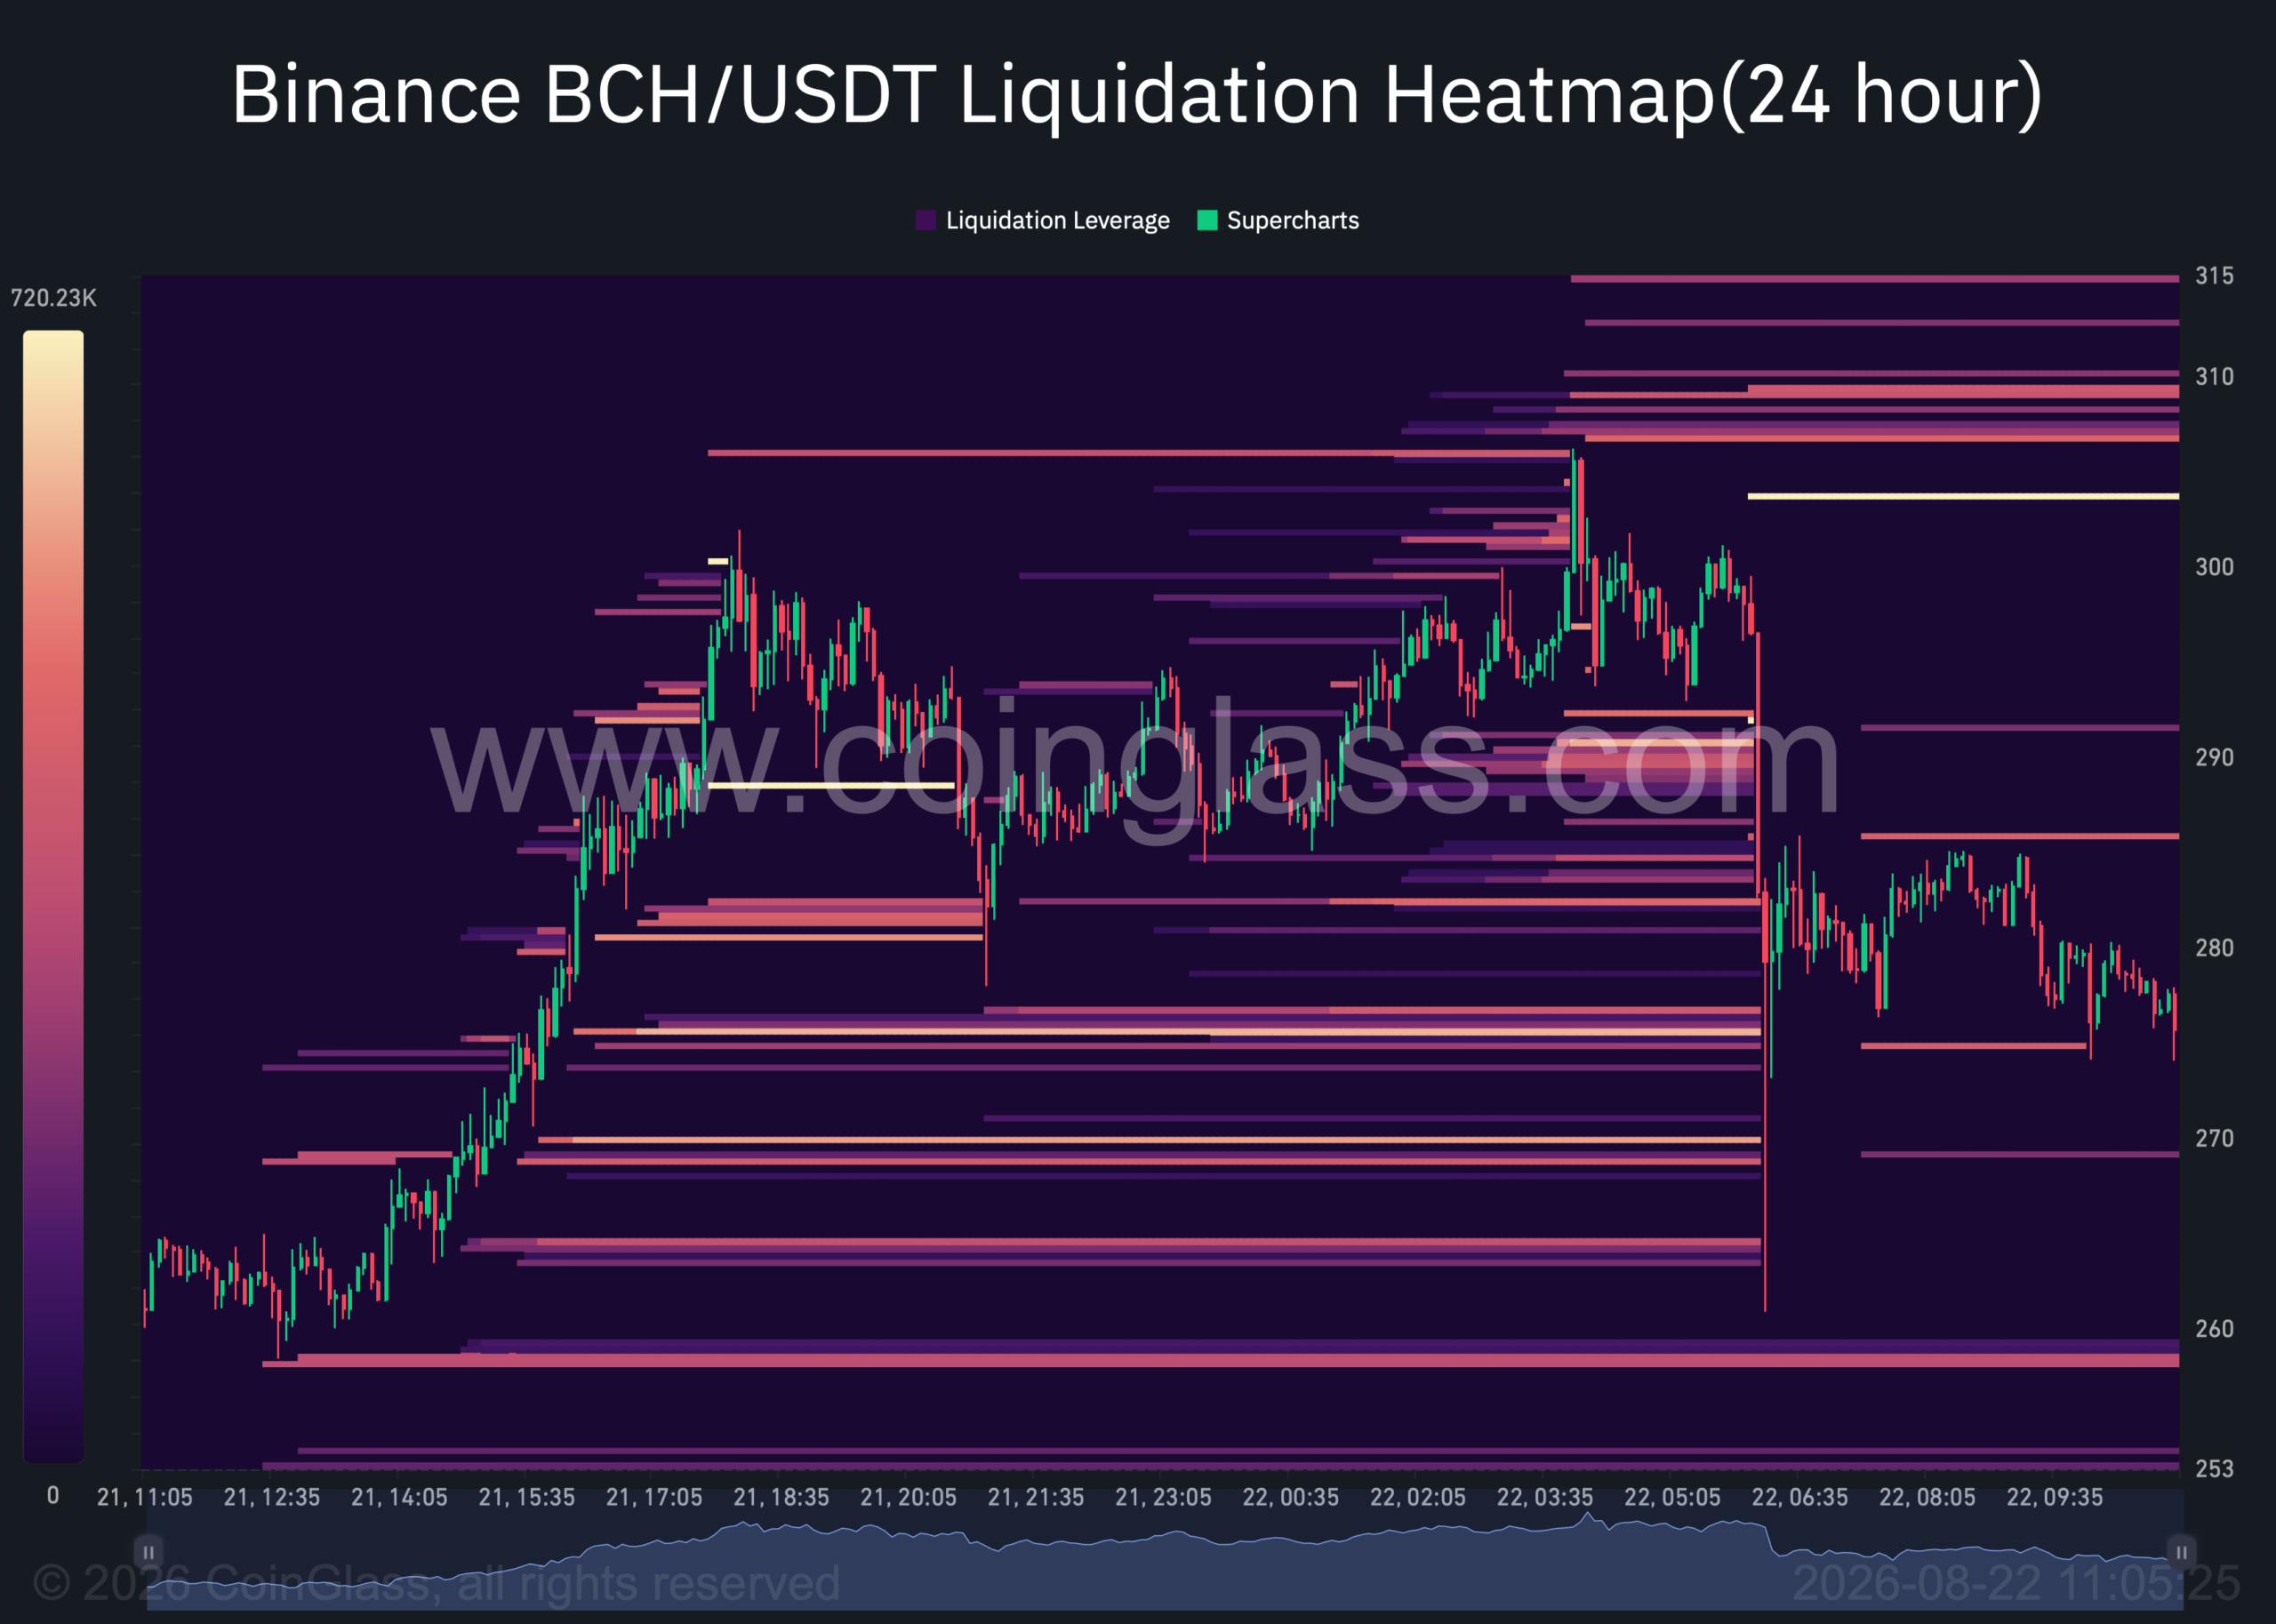
Likewise, on the downside, there’s a potential that BCH could still slide lower on the chart, with buy-side clusters at around the $260 mark.
The momentum in price could play a significant role in dictating what path BCH takes, and with more losses accumulated by long traders, the risk of a decline remains a major possibility.
Resistance ahead of price
Structurally, price has shown a clear bullish trait. However, there’s still an obstacle in the form of a resistance line marked in dots that the price needs to overcome. Price needs to overcome this level before a bullish move could be set in stone.
The Accumulation/Distribution (A/D) indicator, as well as the Moving Average Convergence Divergence (MACD), has both signaled growing strength and that price could rally.
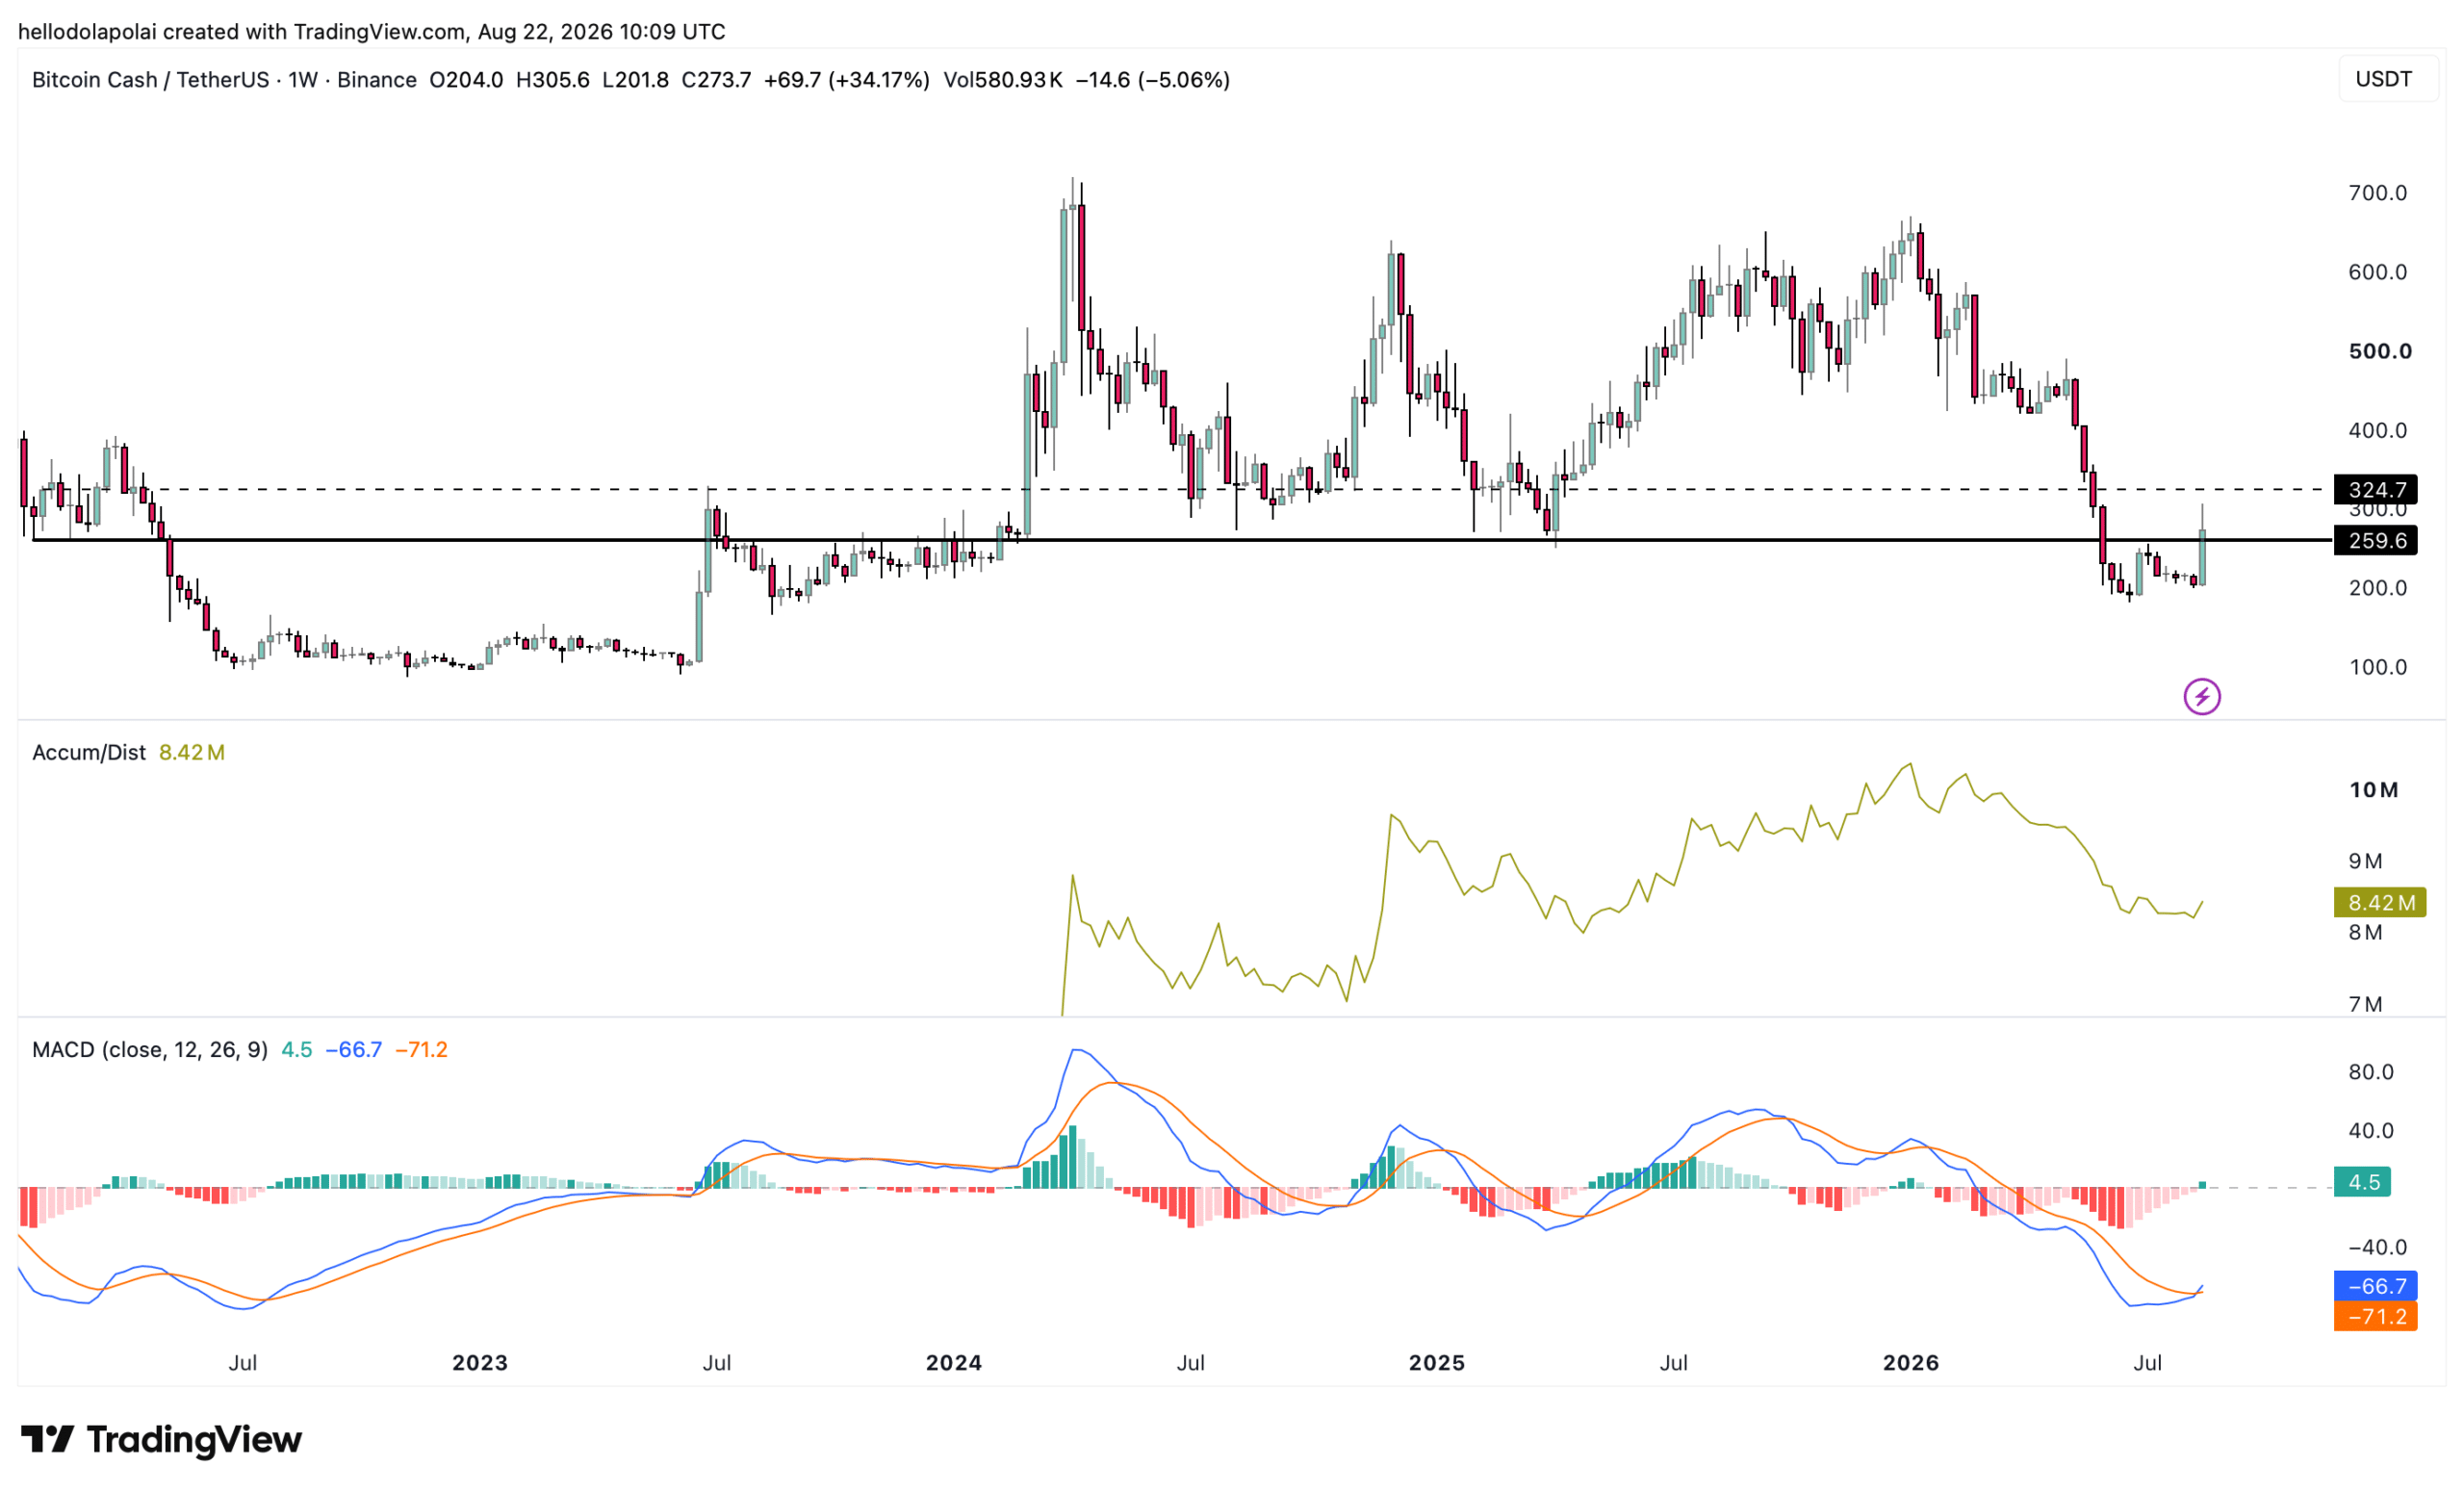
The MACD formed a crossover, with the blue MACD line crossing over the orange signal line, which has preceded a rally. On the other hand, there’s been a surge in the accumulated volume of BCH, hitting 9.7 million.
Final Summary
- BCH’s 18% rally is increasingly leverage-driven, while Spot demand has remained weak for 10 consecutive days.
- The $315 area could attract a higher price, but rising long exposure leaves BCH vulnerable to a pullback toward $260.