

Ethereum price prediction: ETH approaches $2.5K as ETF outflows reach $407.3M
The Ethereum price prediction was bearish in the short-term as the price approaches a local range's high.



On Friday, the 11th of September, Ethereum [ETH] rallied to a high of $2,667. Just four days later, ETH had undergone an 11.6% retracement back to $2,356. At the time of writing, Ethereum was trading at $2,495 and was once again closing in on the $2,530 local resistance zone.
Wednesday’s rate hike decision has given investors reason to pause and reassess their bullish conviction. Further rate hikes to combat inflation would mean a phase of tightening liquidity in the market, making risk-on market losses more likely.
The spot Ethereum ETF flows have slowed down in recent days. According to Farside Investors’ data, the past three trading days saw a cumulative $407.3 million in outflows, showing short-term bearish pressure.

In a post on X, Santiment observed that the Ethereum transaction costs had dropped considerably. Soft mainnet demand has helped pull costs lower, while the price has recovered considerably in July and August.
Cheaper utility and price recovery trends make for a friendlier environment for Ethereum projects. Recovering participation and low execution costs could be a bullish sign for the network.
Ethereum price prediction- Looking beyond the failed $2,667 breakout
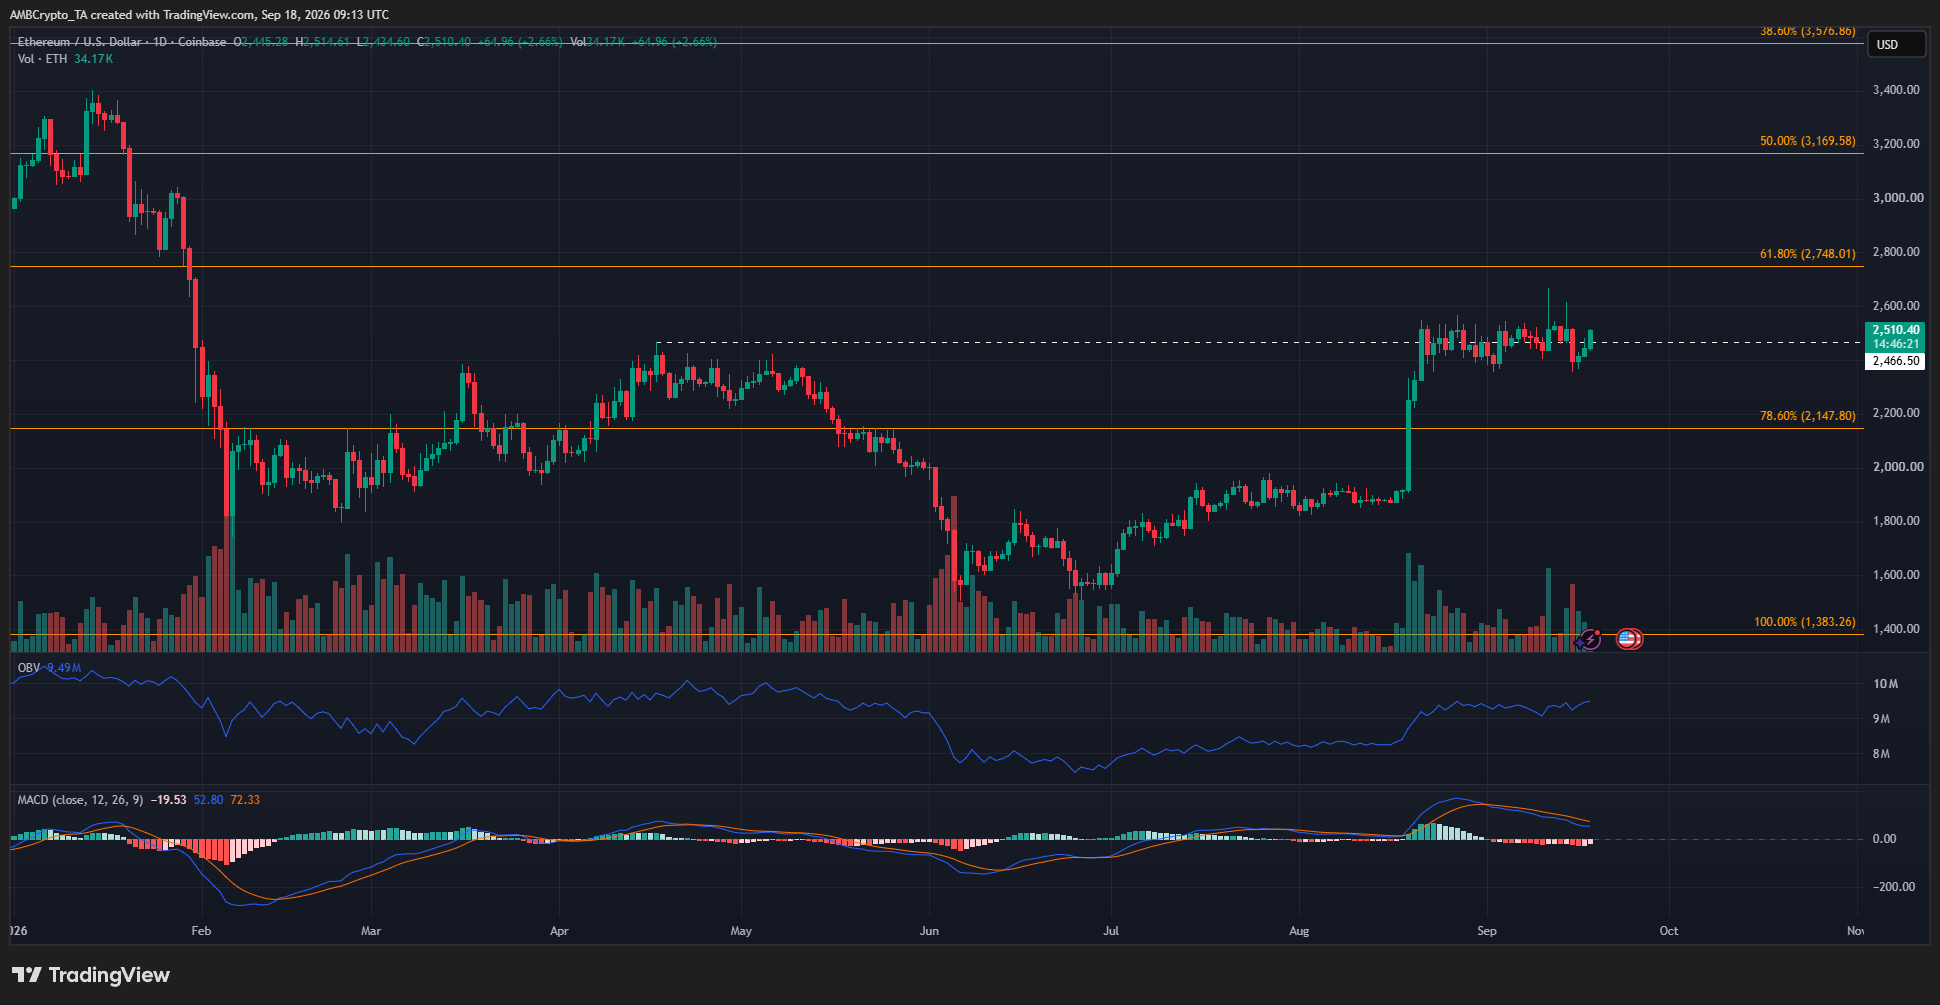
The 1-day chart showed a promise of a bullish trend. The April high at $2,466 was beaten, although the momentum has slowed down since then. Nevertheless, the breach of the previous swing high was a sign of intent from the bulls.
The daily chart has flipped bullishly, and the weekly chart was also bullish. The Fibonacci retracement levels (orange) were based on the weekly structure. A recovery above the 78.6% level at $2,147 in August was an encouraging sign.
Traders’ call to action- Watch for a range resolution
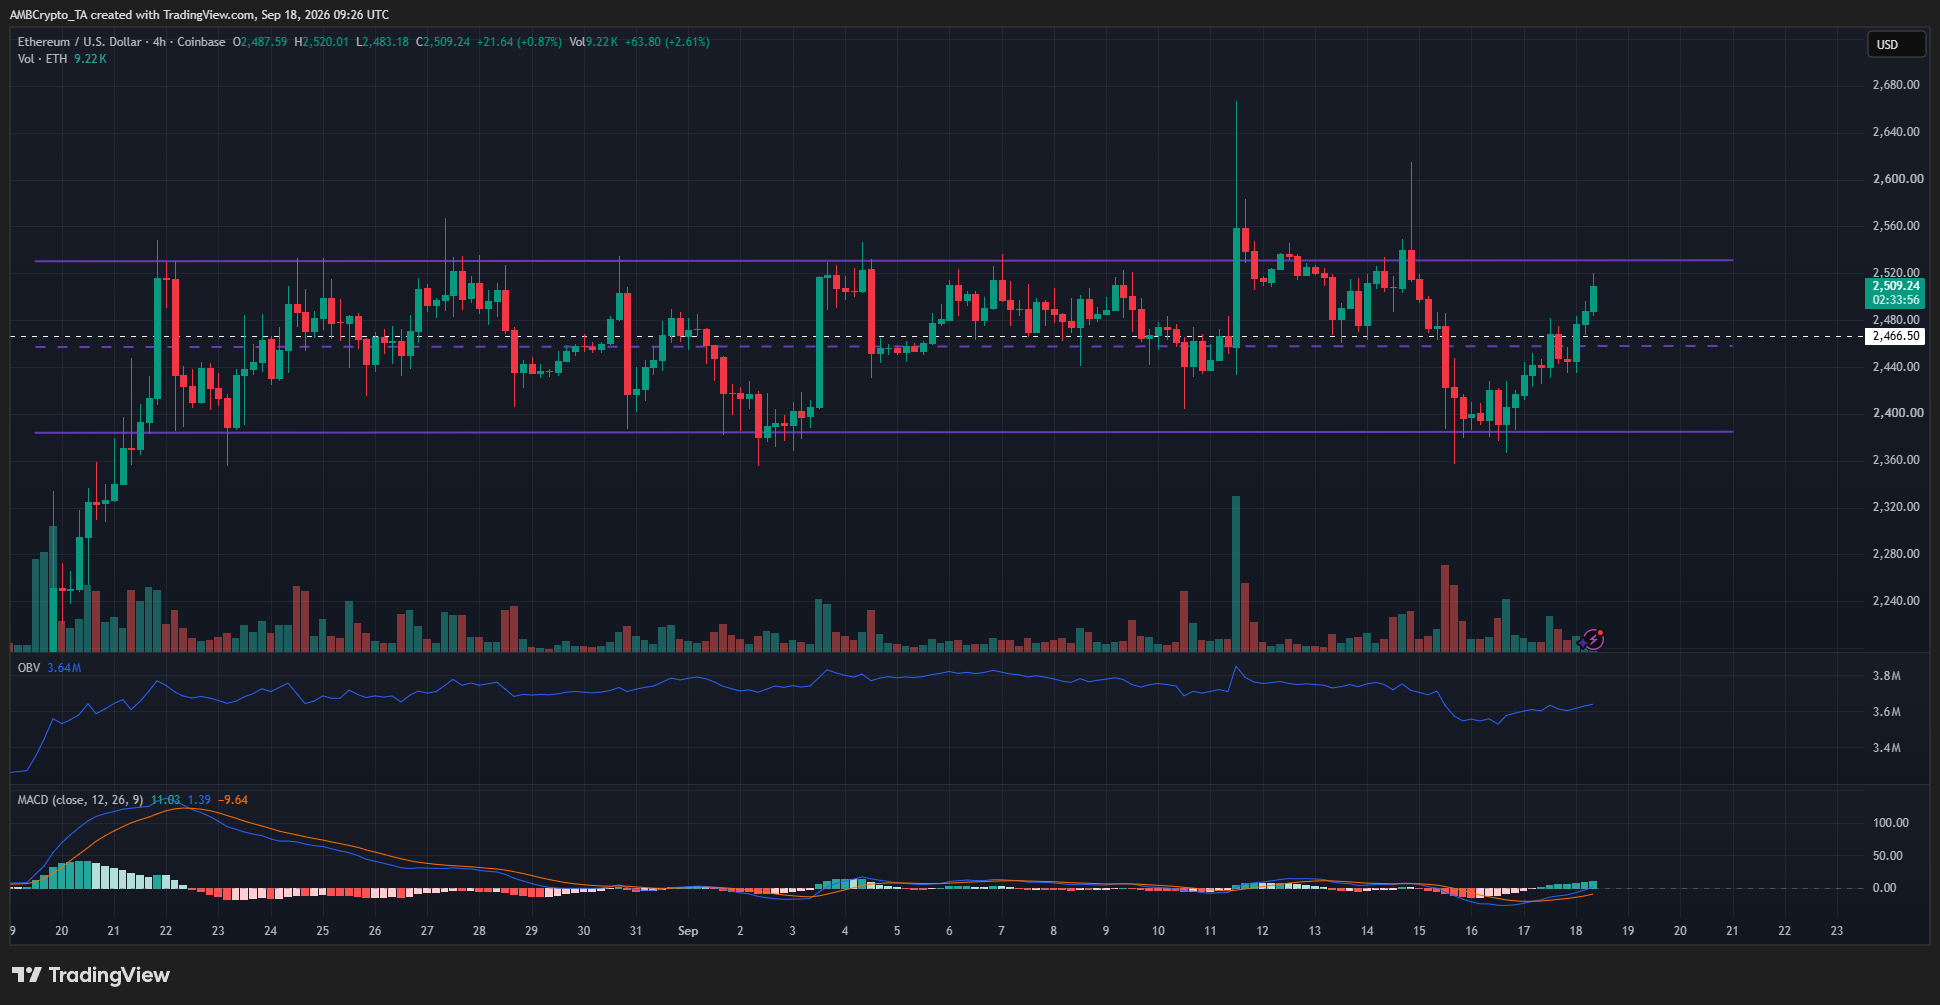
The $2,380-$2,530 range (purple) continued to hold. At the time of writing, the range highs were about to come under siege.
The MACD formed a bullish crossover below the zero line to show momentum was beginning to shift bullishly. The OBV was well below the highs from last week, showing subdued buying volume during the recent price bounce.
Overall, ETH swing traders need to be suspicious of a bullish breakout due to the earlier failed breakouts. Meanwhile, a dip below $2,380 would open the door for a bearish move.
Whether that move also turns out to be a sharp liquidity hunt, only time will tell. Risk management will be as important as ever in trading this range.
Final Summary
- Ethereum transaction costs have decreased while prices recovered, intelligence platform Santiment wrote.
- The Ethereum price prediction was bearish in the short-term as the price approaches a local range’s high.