CASHCAT falls 30% – But this same support level has historically triggered rallies
CashCat faces selling pressure as bears push the price lower.



CashCat [CASHCAT] lost its momentum as the memecoin’s price dropped significantly following capital shrinkage across the broader cryptocurrency market. The asset has since plummeted roughly 30% within the past 24 hours.
The chart shows that the decline followed a breach of a structural horizontal resistance line, while the asset has now traded into the support level of a broader rising bullish channel.
Overall, the price analysis of the chart shows that the asset is trading within an overall bullish pattern, oscillating between the upper resistance and lower support levels.
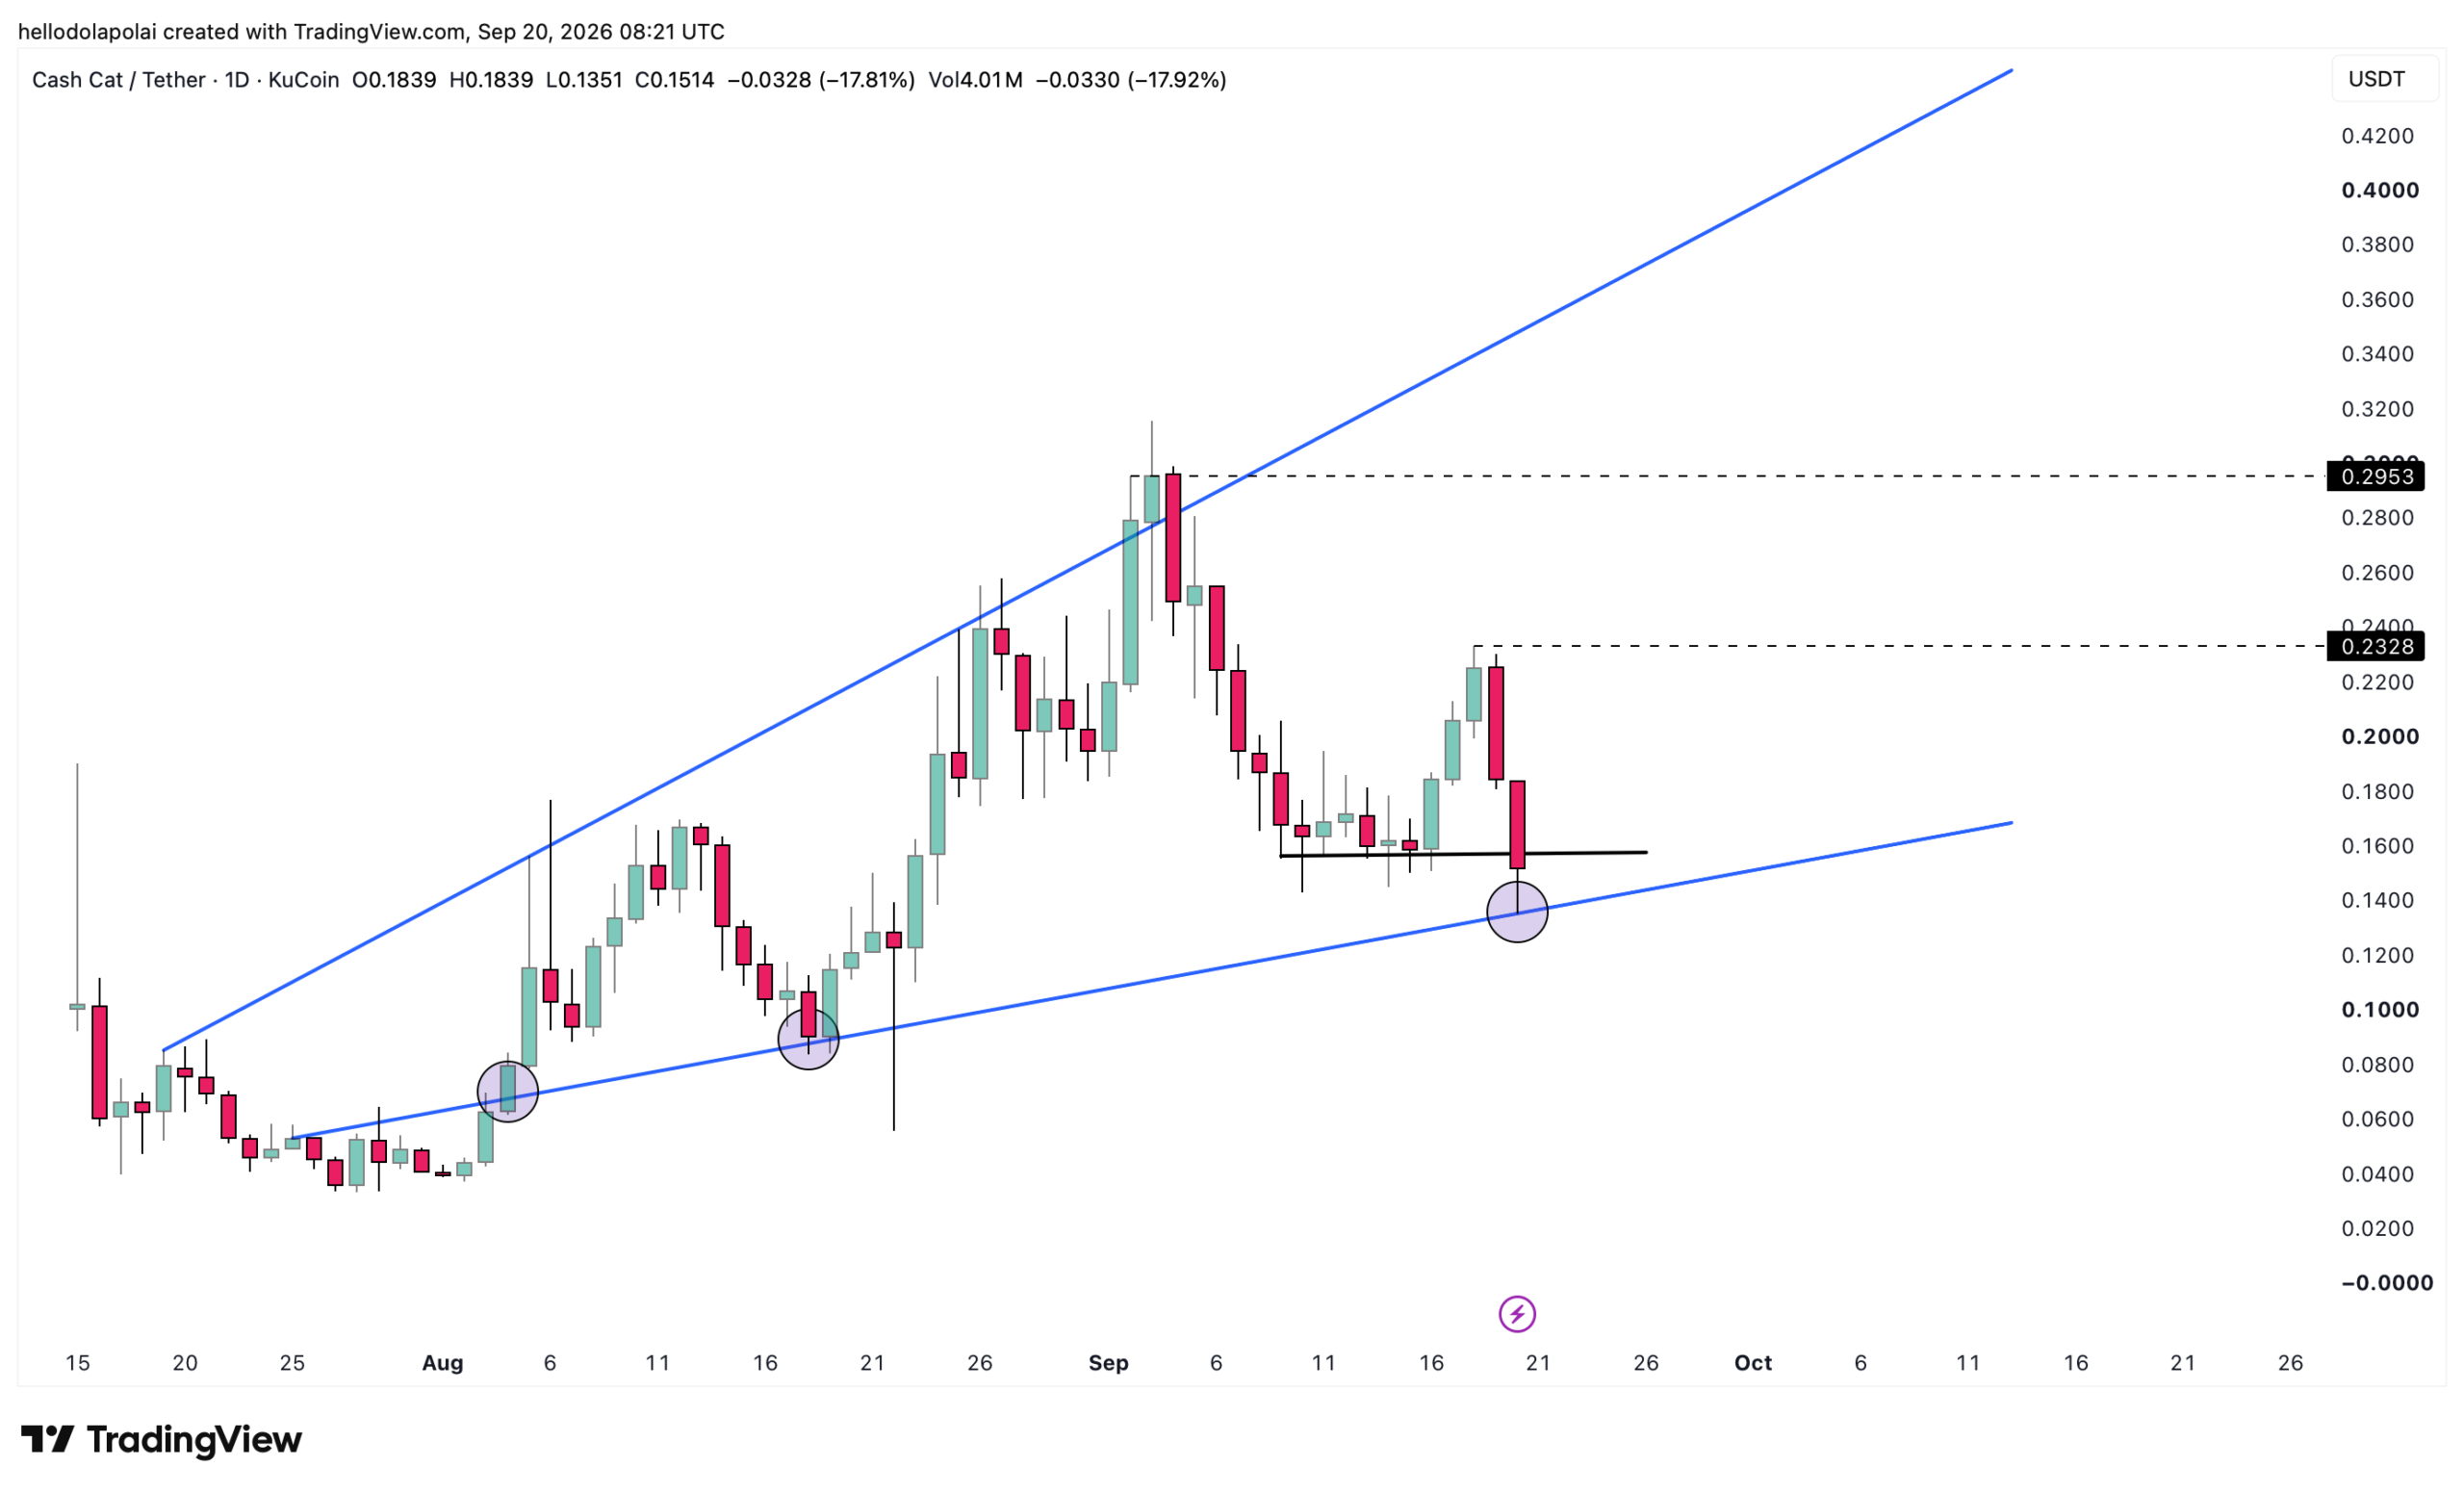
The support level into which the price has now traded has been a key catalyst for a rally on more than one occasion. With the price trading into this zone, there is a high chance of a rebound if the fractal pattern continues to hold.
MFI rises as bears maintain market control
The bears still hold control over the market, with data from the chart showing that the Bull Bear Power, which determines which side of the market is in control, shows that bears are dominant.
The red histogram bar formed on the chart shows that there is a clear concentration among bears in the market. In fact, this is the highest level of bearish influence in the market since the 10th of September, when the histogram bar fell even lower than the present level.
The Money Flow Index (MFI), which measures capital inflow into the market and whether the market is bullish or bearish depending on its position on the chart, shows a mixed outlook.
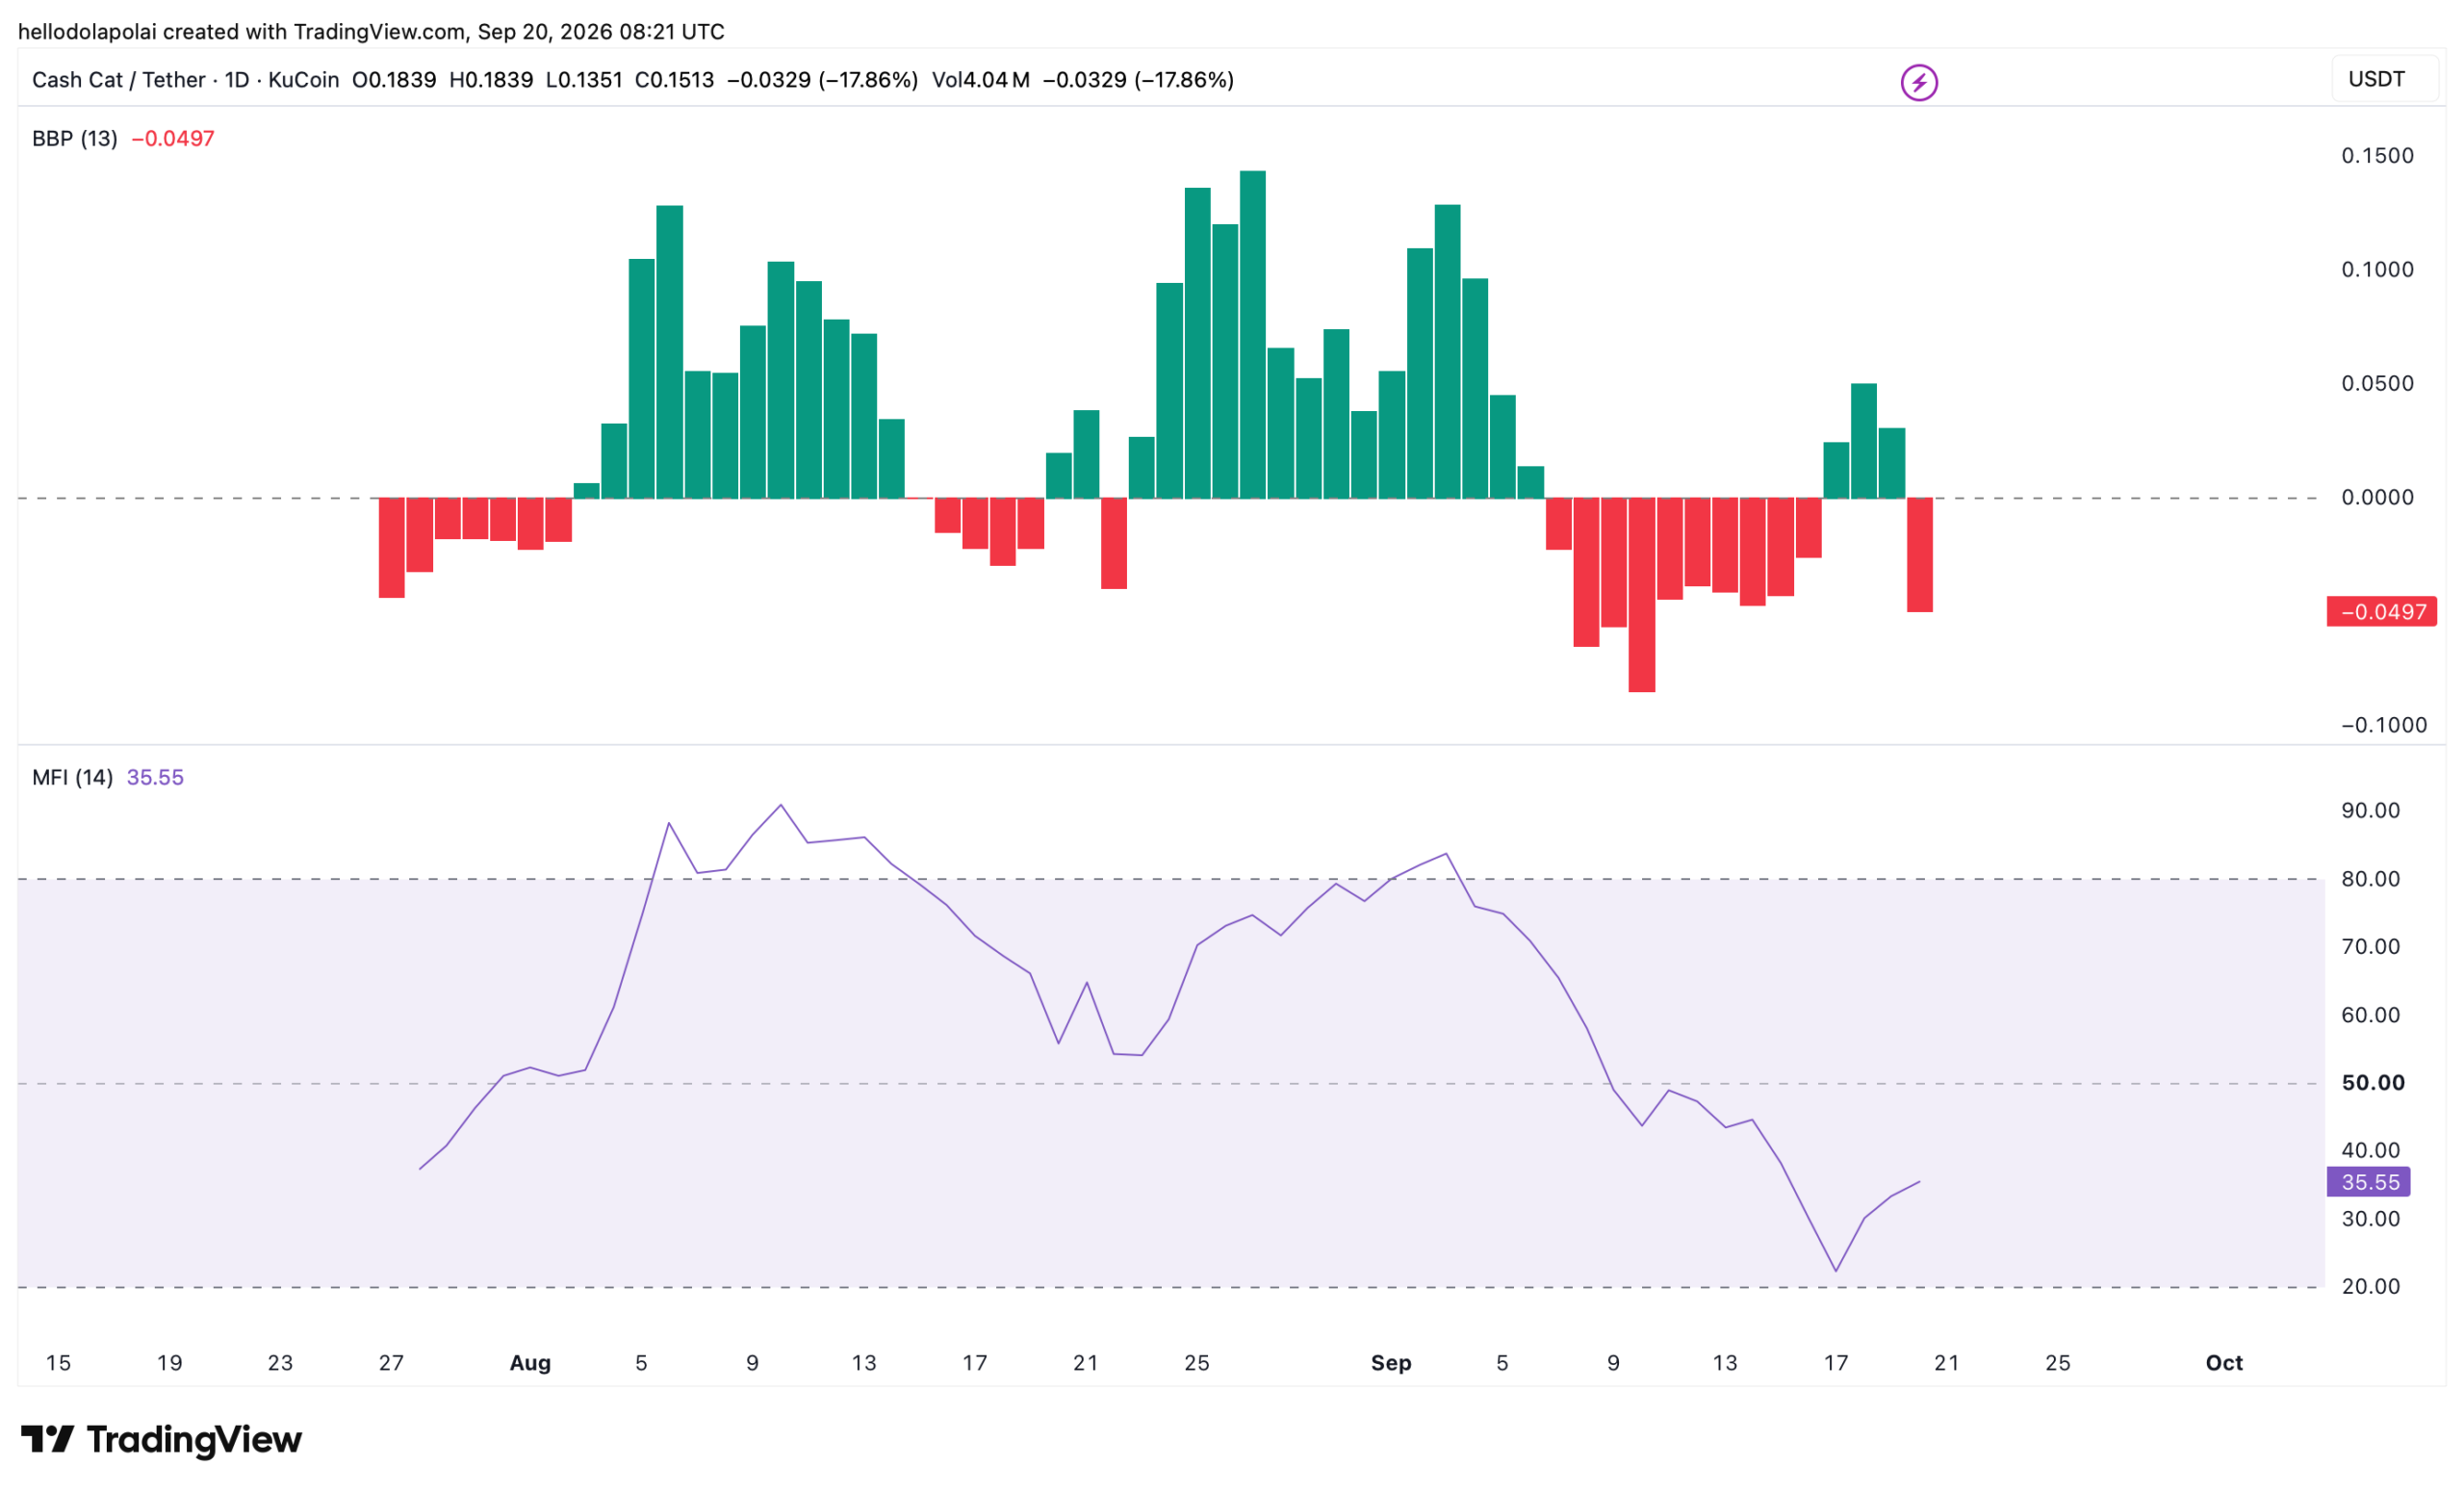
The MFI indicator is presently surging forward, with a reading of roughly 35.5 on the chart, implying that as the price traded into the channel’s support, more capital flowed into the market, likely as it triggered several buy orders.
Positive Funding Rate leaves room for a rebound
The Funding Rate data shows that there has been a decline in the past day, albeit slightly, with the reading remaining positive.
The Funding Rate remains at 0.0078%, implying that the majority of contracts opened in the market are positioned long. The Spot market netflow has likewise shown net buying.
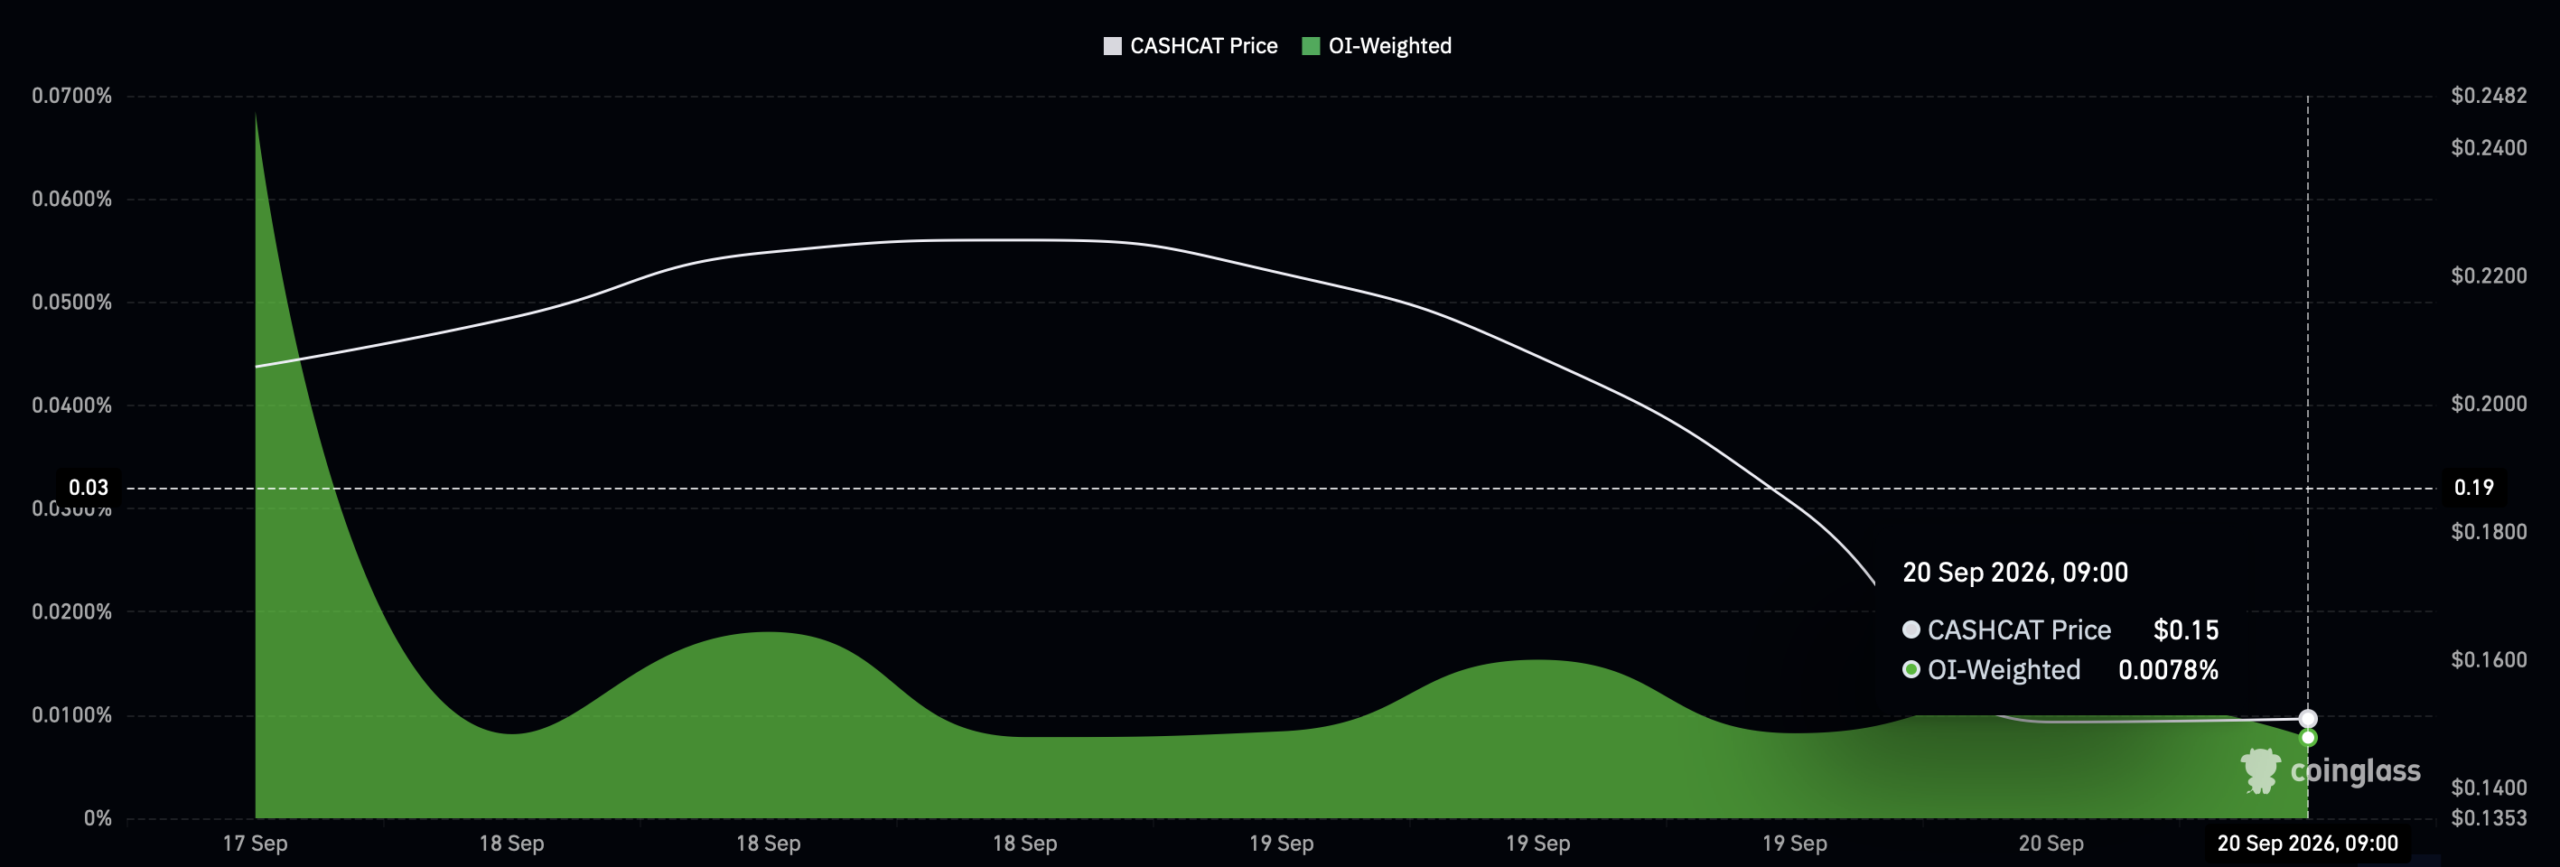
This implies that the recent price decline is a result of sentiment in the market rather than a clear structural bearish change, and for now, the potential for a rebound remains high.
Final Summary
- CASHCAT’s 30% decline has brought the price to a rising channel support that has previously triggered rebounds.
- Positive Funding Rate and rising MFI point to buying activity, but Bull Bear Power remains tilted toward bears.


![Stacks [STX] hits 13%: Can spot accumulation sustain the rally?](https://ambcrypto.com/wp-content/uploads/2026/09/Abdul-131-e1789890944611.webp)