Why is XCN up today? Onyxcoin’s Chain.com deal, rising users & more…
The XCN crypto rally started in August, when a year-long trendline resistance was breached.



Onyxcoin [XCN] has rallied 6.18% in the past 24 hours, even after taking into account the sharp dip from $0.00531 to $0.00480 on Wednesday, the 23rd of September. Over the past week, the altcoin has rallied 23%, and nearly 30% over the past month.
The gains were likely spurred by the Onyx acquisition of Chain.com, the stablecoin payments fintech infrastructure firm, just over a week ago. Onyx Mesh went live on the Onyx Layer 1 in early July.
The shift in crypto market sentiment over the past month has helped attract new users to the chain, Onyx Explorer chain stats showed. Are these catalysts enough to keep the uptrend going?
Exploring the XCN crypto trendline and structure break
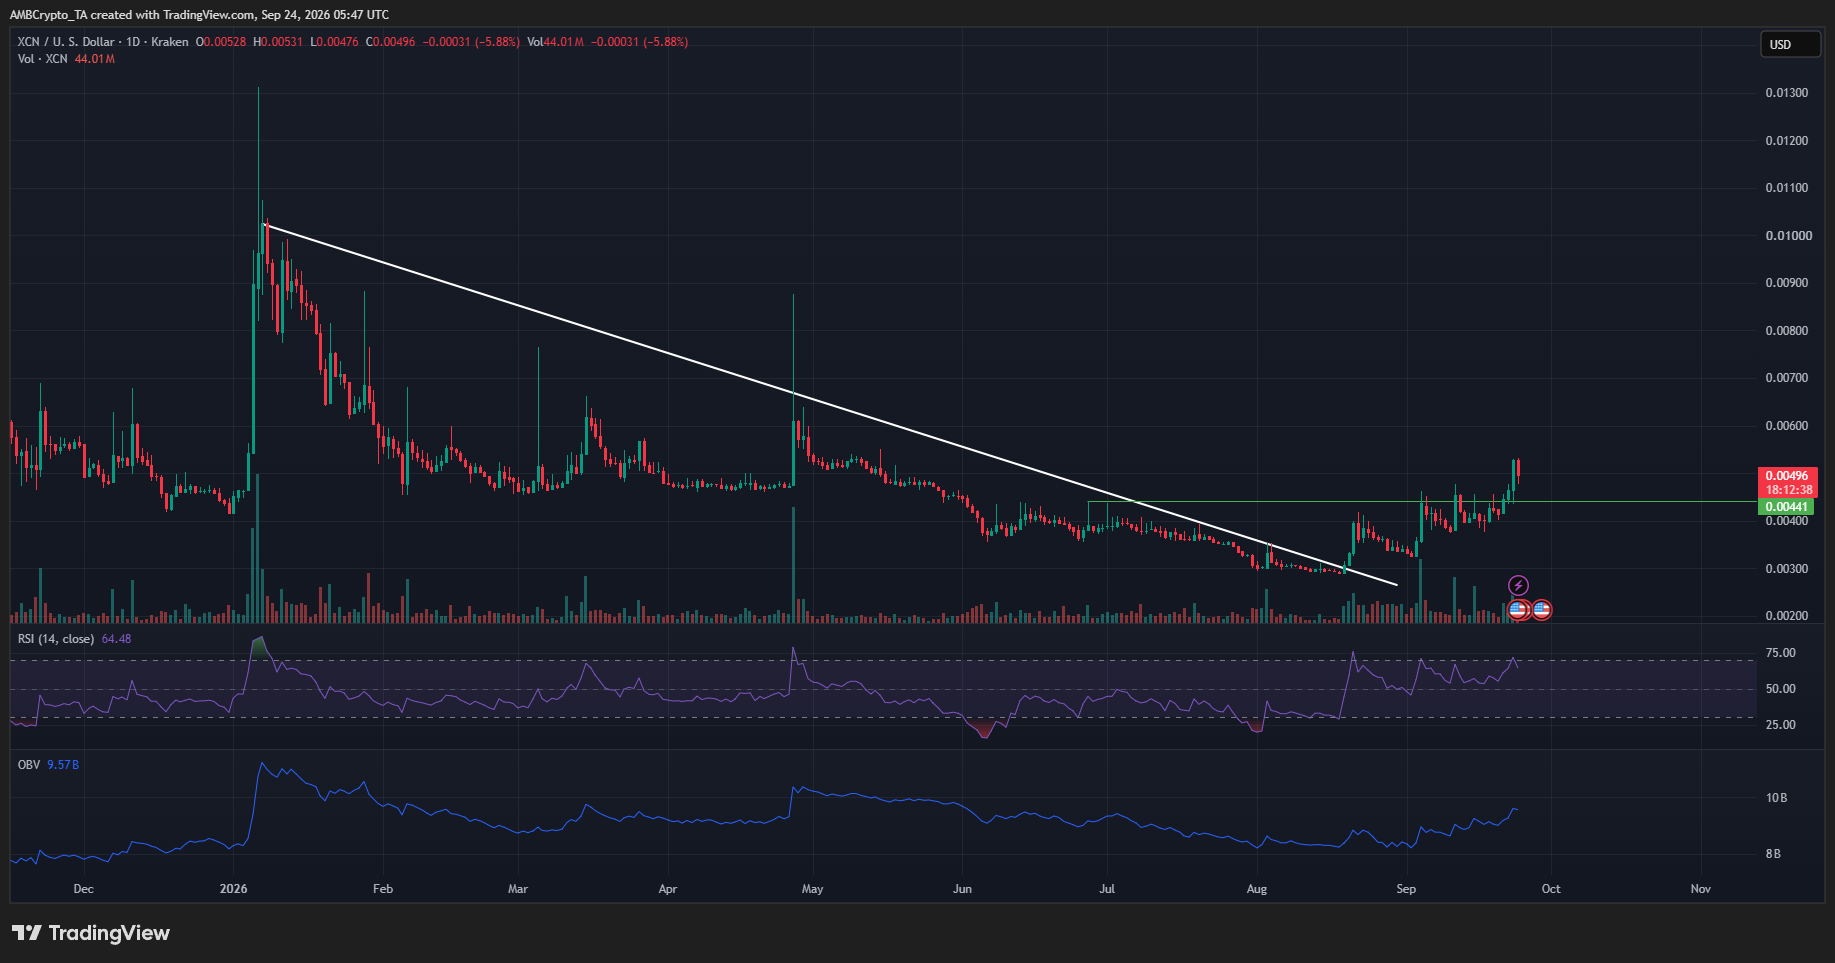
After the rally in early January, XCN crypto has been in steady decline. The price went from that early swing high at $0.0131 to a low of $0.00287 in August, a 78.14% decline.
A trendline resistance helped capture the downtrend, and this trendline was breached in mid-August. In September, the price managed to climb past a key swing level resistance at $0.00441.
The trendline break and the structure shift were both clues that XCN crypto has embarked on a bullish trend. The RSI was in bullish territory, and the OBV was making multi-month highs to reflect high buying volume overall.
Traders’ call to action- Buy the dip
The daily chart showed that the trend was bullish. Swing traders and investors have reason to expect the gains to continue, especially since it looks like Bitcoin [BTC] has started on a new bull run.
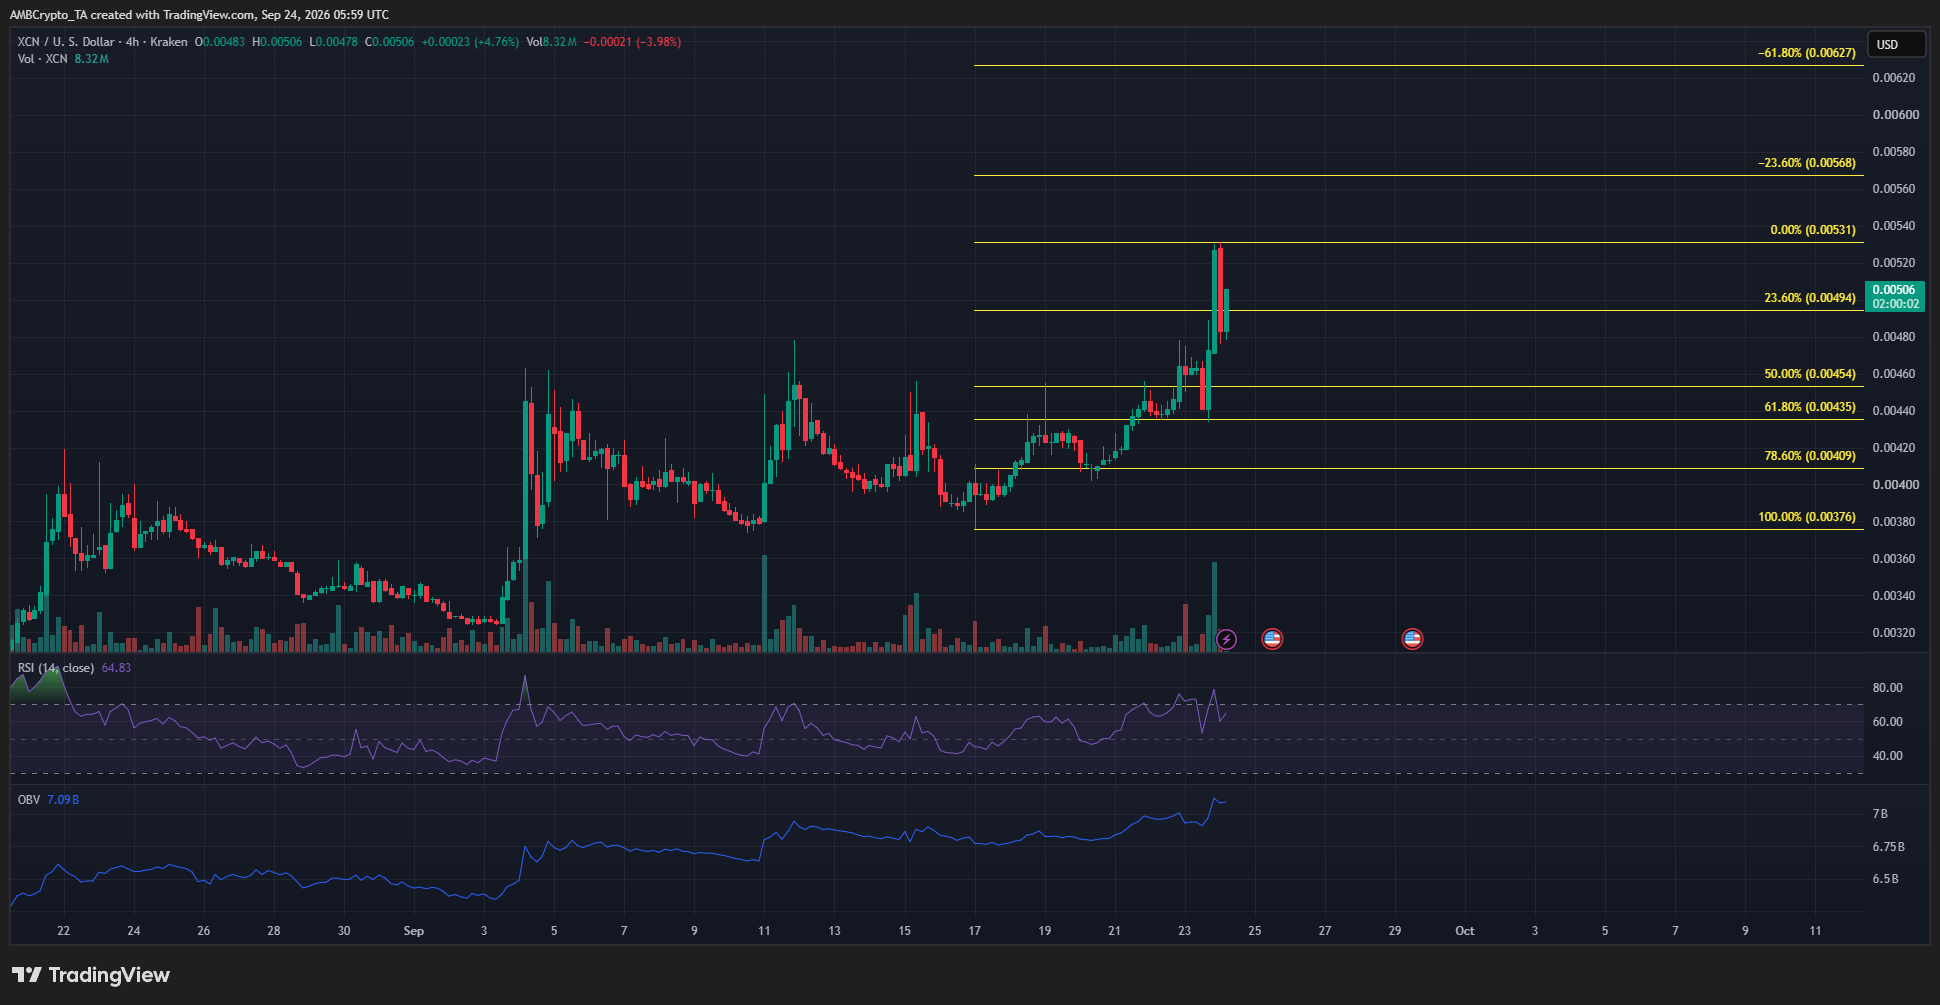
On the 4-hour chart, too, the structure and technical indicators were all bullish. Wednesday’s dip to $0.0048 could be the beginning of a deeper retracement.
The Fibonacci levels highlighted what these could be. The $0.00409-$0.00435 golden pocket is one to watch for a bullish reversal. So long as the price remained above the higher low at $0.00376, the uptrend would be intact.
The next bullish price targets were $0.00568 and $0.00627.
Final Summary
- The XCN crypto rally started in August, when a year-long trendline resistance was breached.
- Recently, the price structure also flipped bullishly, giving a strong signal that the altcoin was ready to rally higher.