Why FARTCOIN’s green candle may not be enough to stop the decline
The green candle is easy to spot. Conviction is proving harder to find.


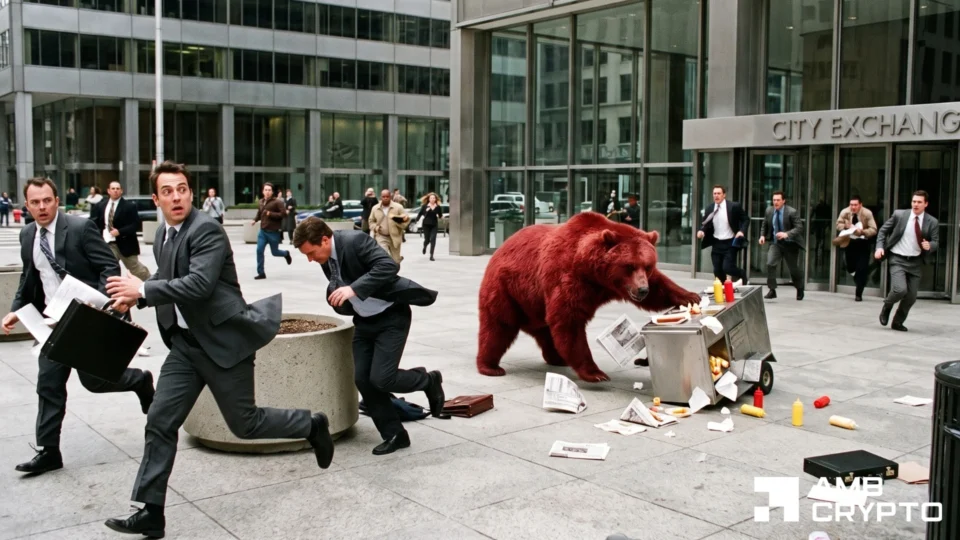
Fartcoin [FARTCOIN] lost 13% over the past day during a broader market correction. Its next move could depend on whether buyers reclaim the middle Bollinger Band.
A green candle hinted at a pause in the decline. Still, weak accumulation and bearish perpetual trading data gave sellers room to press their advantage.
Can FARTCOIN reclaim the mid-band?
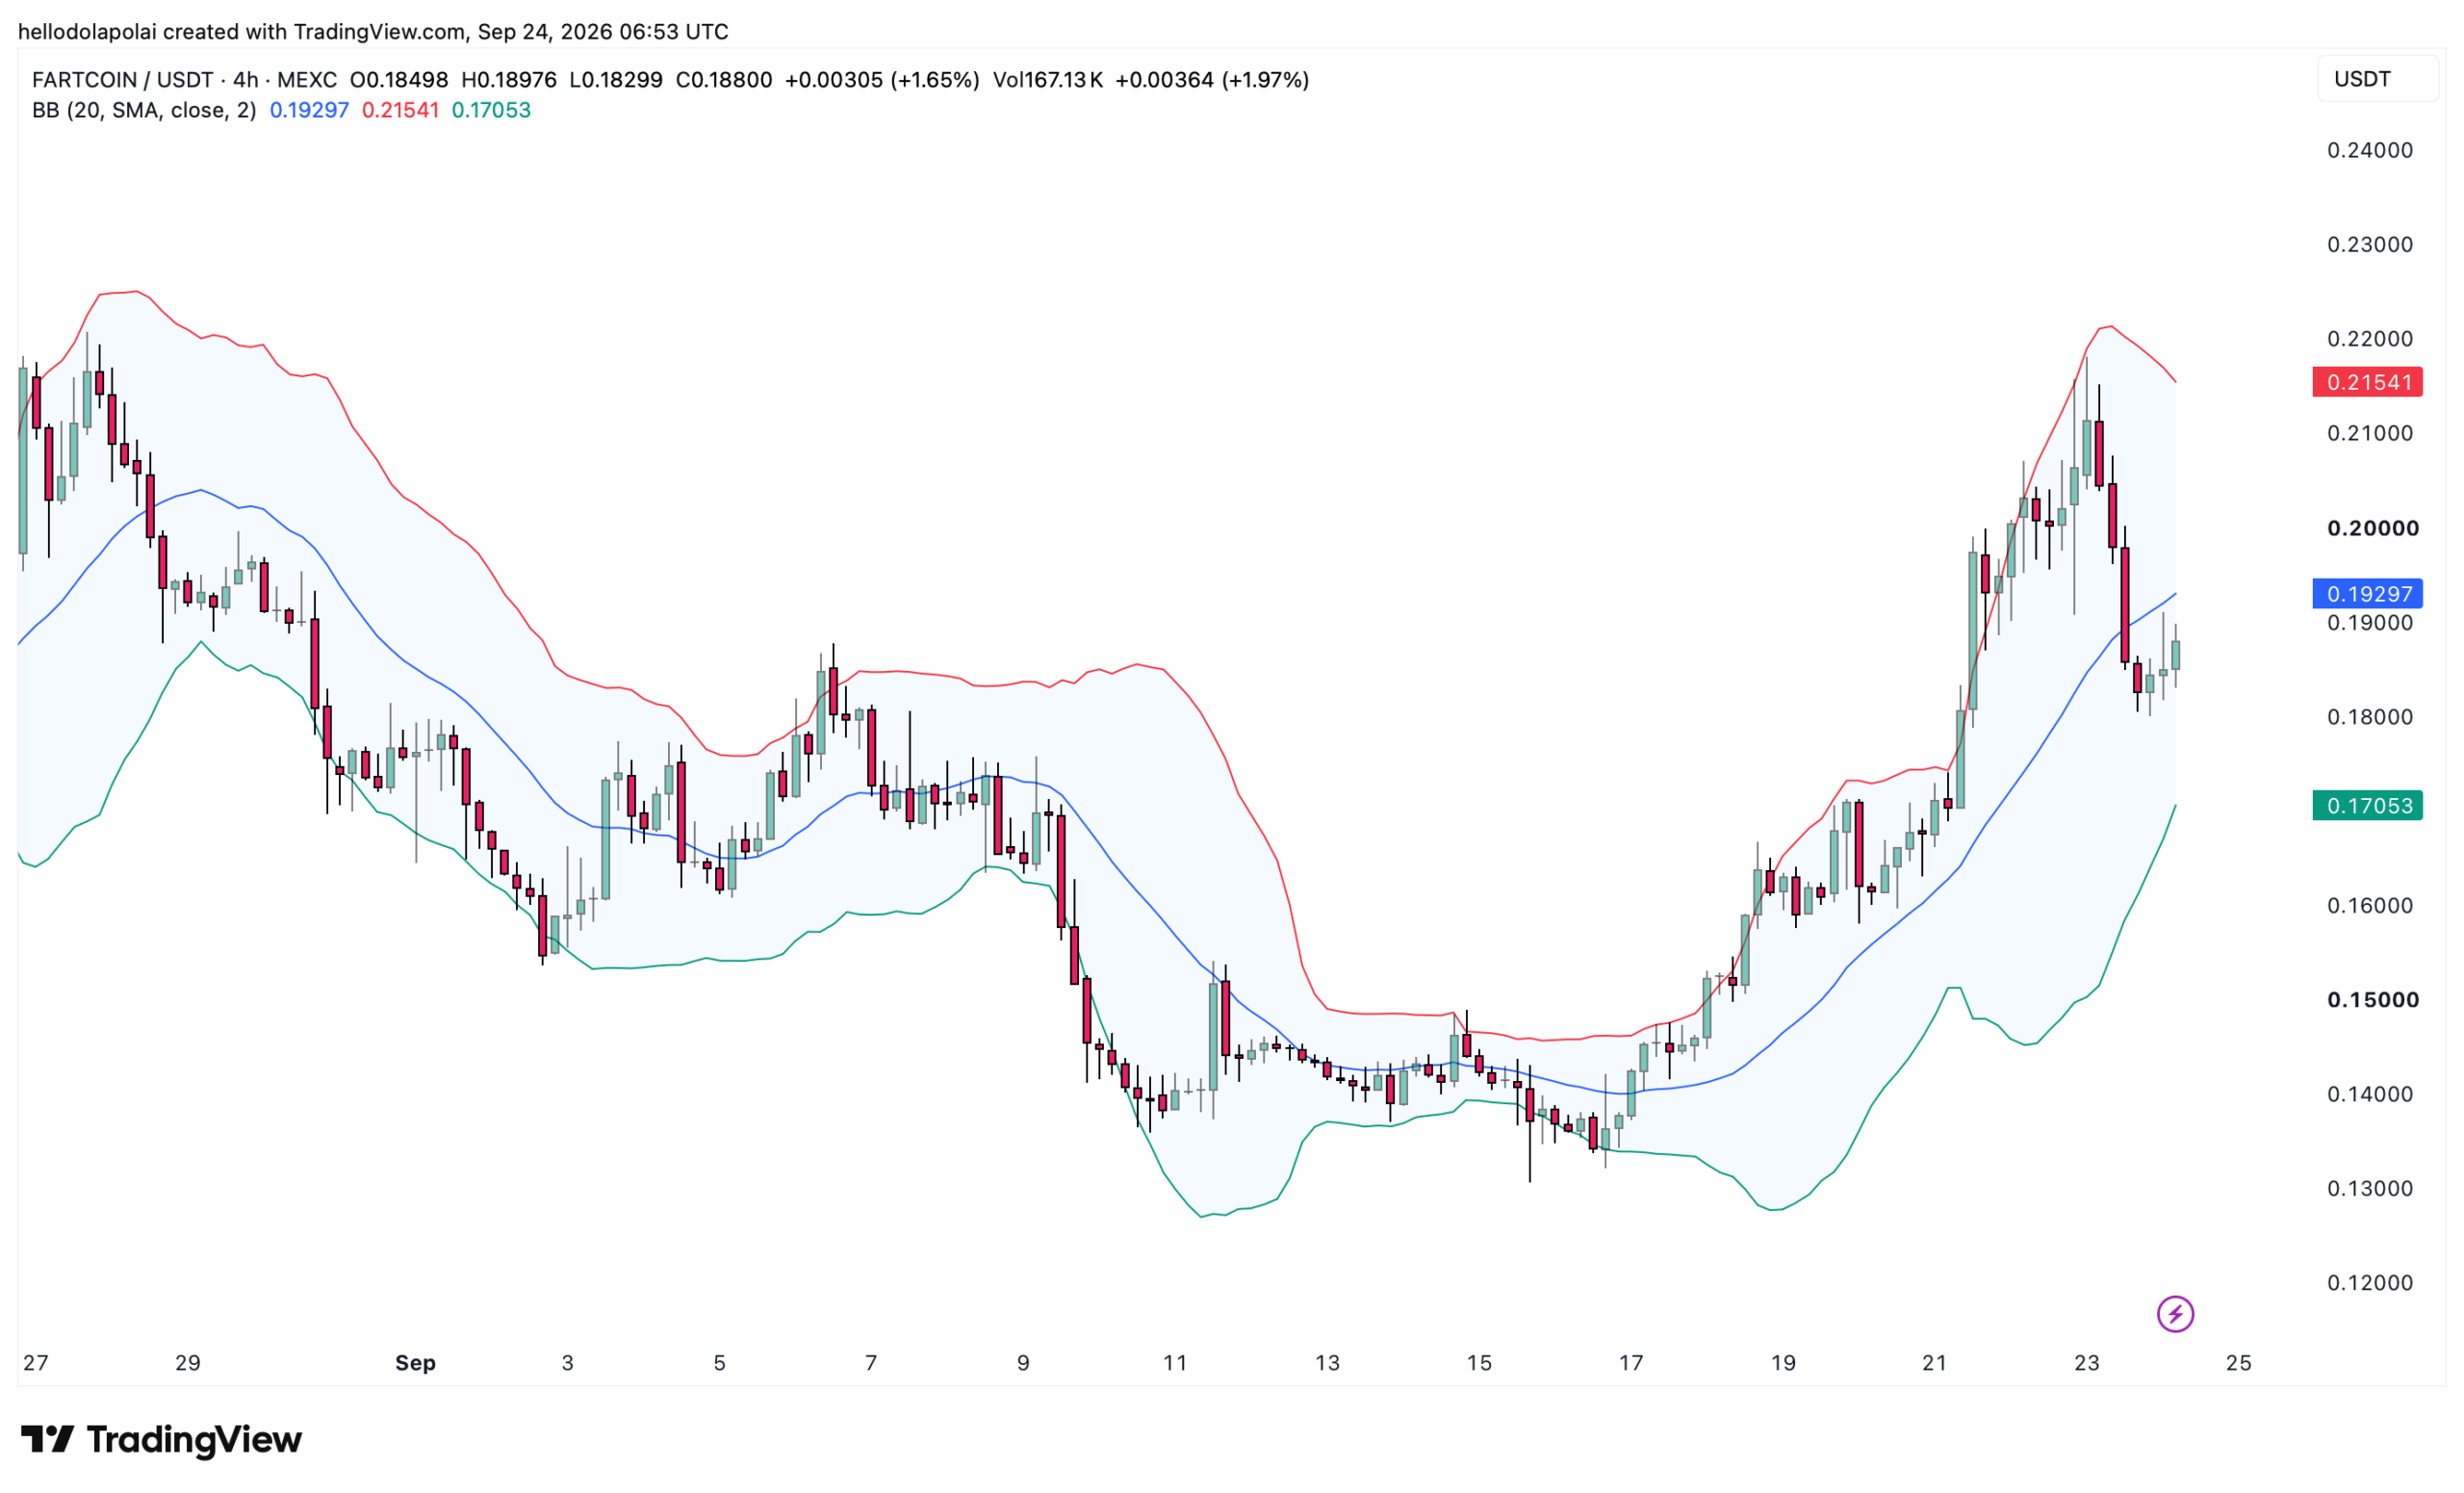
FARTCOIN fell after reaching the upper Bollinger Band during its earlier rise. It then moved toward the middle band, which marked the next price test.
Bollinger Bands show where price sits relative to its moving average and recent volatility. A move near the upper band does not, by itself, mean an asset is overvalued.
For FARTCOIN, the middle band could act as resistance. Although price formed a green candle, it had yet to retest that level.
A rejection there could send the token toward $0.17. First, buyers would need to show whether the bounce has any staying power.
Is FARTCOIN accumulation picking up?
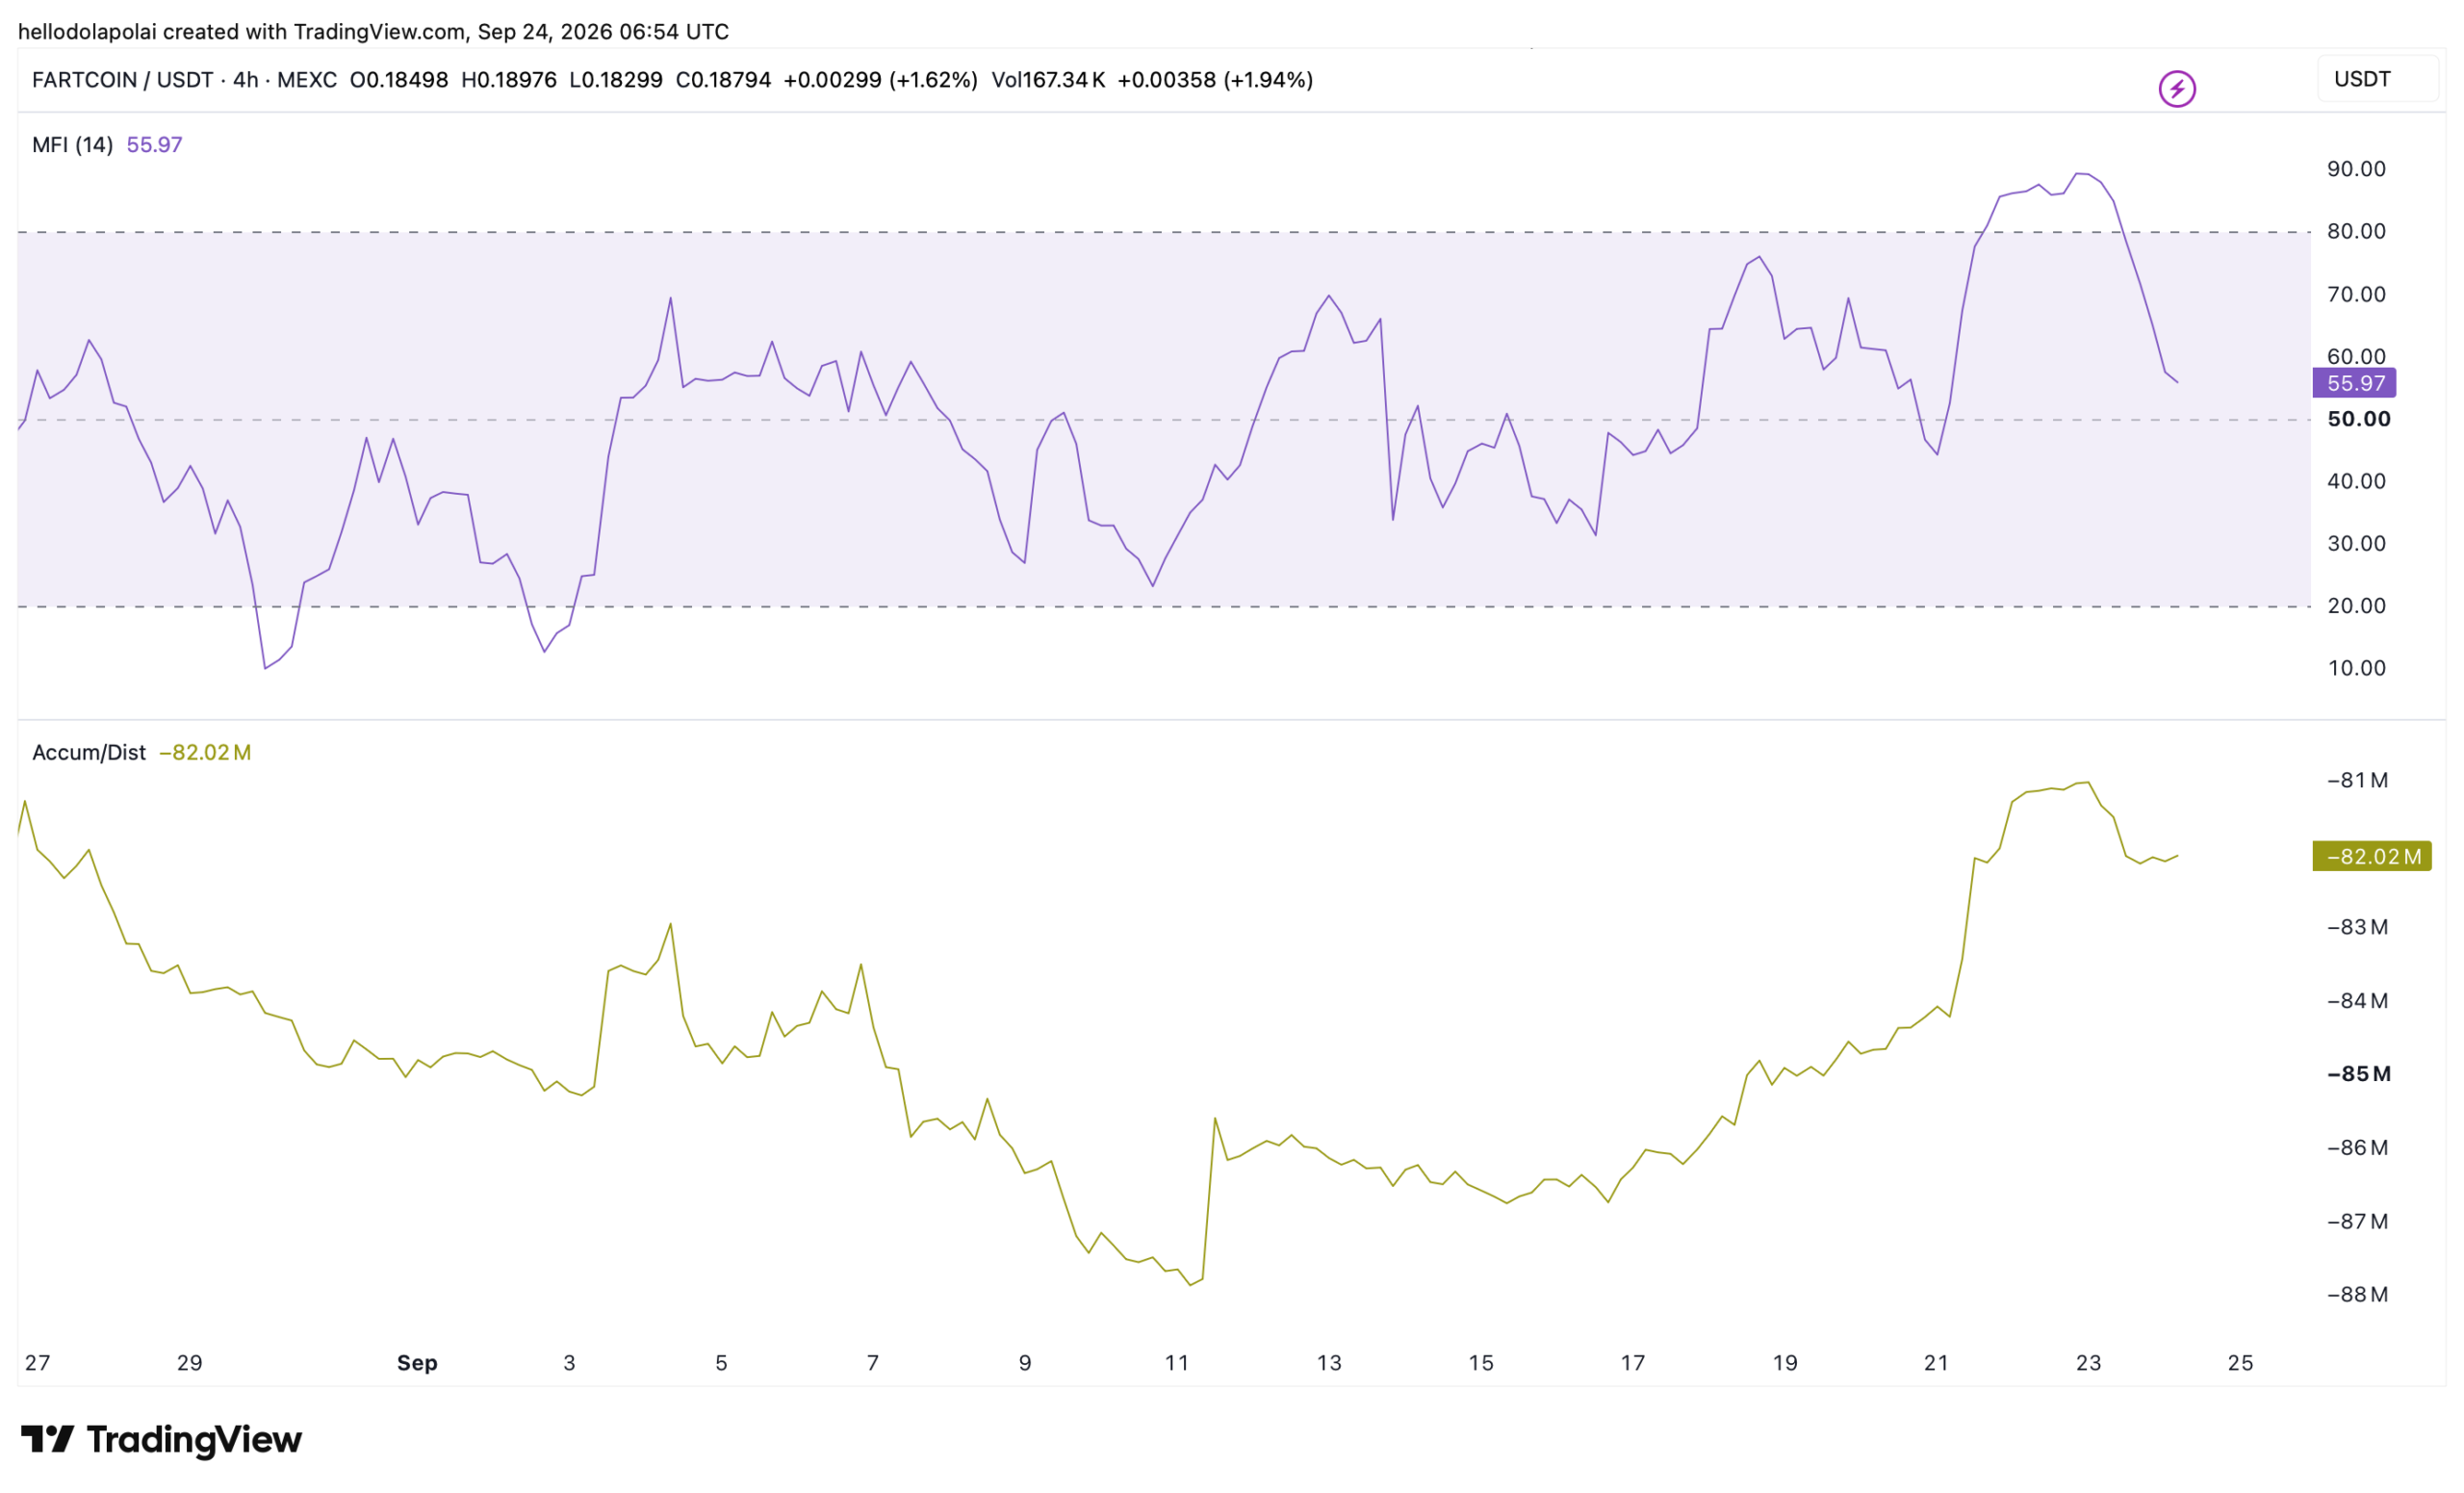
The Accumulation/Distribution Indicator stayed flat in negative territory. That offered little sign of a fresh accumulation trend during the latest price move.
Its flat reading suggested that buying pressure had yet to take a clear lead. The indicator’s negative level alone, however, did not establish current bearish sentiment.
Meanwhile, FARTCOIN’s Money Flow Index fell to 53. The downward move pointed to easing buying pressure, although the reading remained above 50.
That left the rebound possible, but unconvincing. A further decline below 50 could weaken the case for buyers stepping back in.
Are FARTCOIN perpetual traders turning bearish?
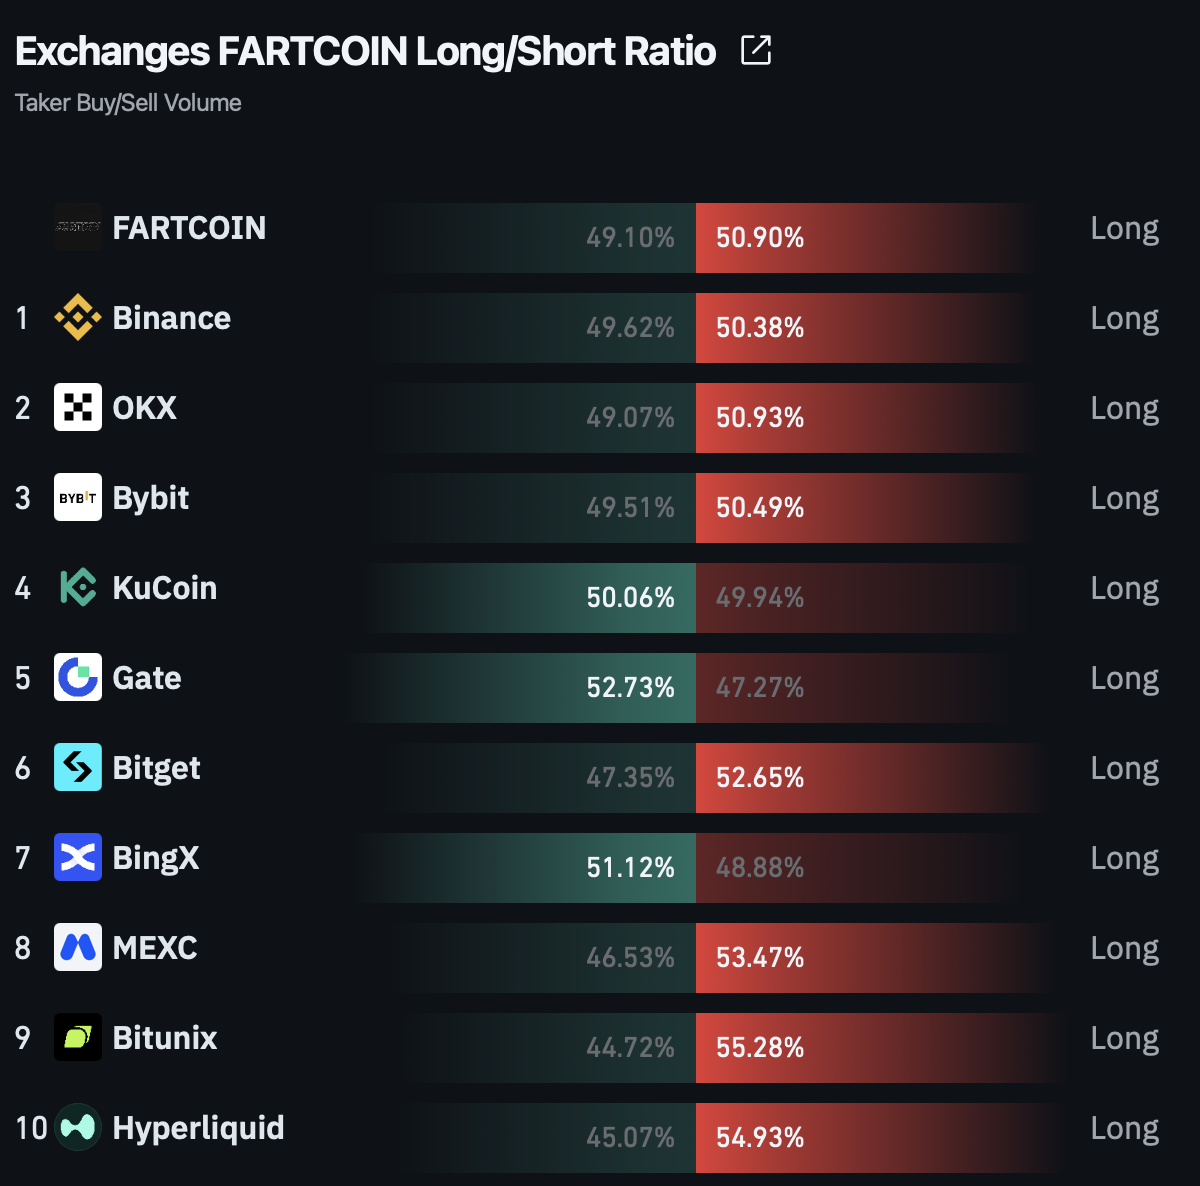
Perpetual market positioning added another hurdle. The CoinGlass Long/Short Ratio favored the short side on roughly seven of the ten exchanges shown.
That exchange count indicated a broad short bias across the displayed ratios. It did not, on its own, measure total sell volume across those venues.
With the middle Bollinger Band still overhead, a failed retest could keep $0.17 in focus. Reclaiming the band would give the green candle a stronger case.
Final Summary
- FARTCOIN fell 13%, and its rebound still faced a test at the middle Bollinger Band.
- The Money Flow Index cooled to 53, while exchange ratios broadly favored shorts.