ASTER’s 6% hike finds support in Bitcoin’s $82K stand, but will the long-term trend change?
ASTER bulls managed to push past the $0.74 mid-range resistance.



Aster [ASTER] recorded a surge of 6% in the last 24 hours. The daily trading volume was 75% higher too, according to CoinMarketCap. It is possible that the altcoin enthusiasm across the market could propel ASTER higher.
For a week now, Bitcoin [BTC] bulls have held on to the $83K support zone, adamantly refusing sellers a pathway below $82K and potentially making a push below $80K.
This Bitcoin resilience has helped altcoins steady their ships. The altcoin market cap (including Ethereum) has stayed around the $1.14-$1.15 trillion region over the past week.
ASTER lacked a strong price trend in July and a good part of August. The consolidation phase back then has since given way to a bullish expansion. However, at press time, the long-term ASTER trend still wasn’t bullish.
What do ASTER bulls need to flip the structure bullishly?
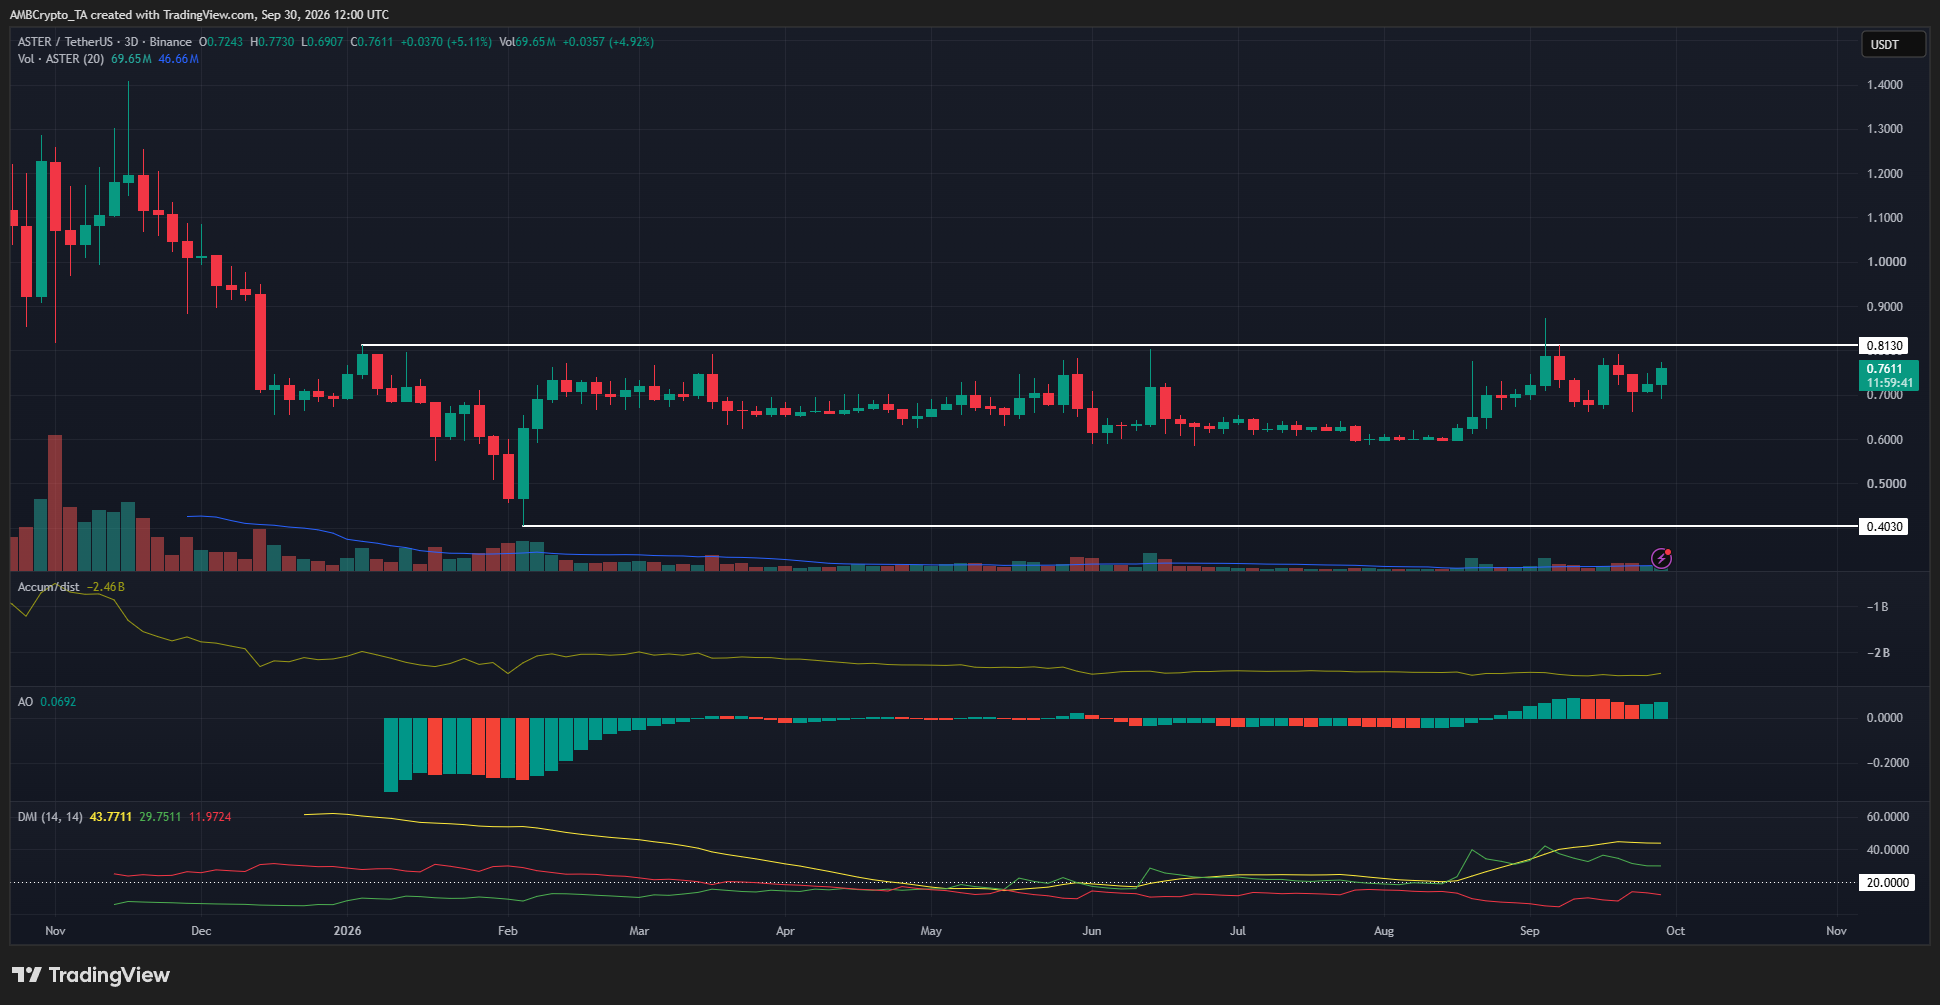
The 3-day chart provided a clear picture of what the bulls needed to flip the structure. The $0.403 and $0.813-levels marked the swing points from the start of the year that are the latest relevant levels to the bearish swing structure.
The swing high was tested in August, but a candle close above it did not occur. Until it does, long-term traders can maintain a cautiously bearish bias.
Despite the hike in daily trading volume, the 3-day volume trends were barely able to exceed the 20-period moving average in September. As a result of relatively low volume and wicks to the upside, the A/D indicator has not managed to climb higher.
The DMI showed a bullish trend in progress, but waiting for a session close above $0.813 to confirm bullish strength could still be a viable plan.
Traders’ call to action – Keep an eye on the range
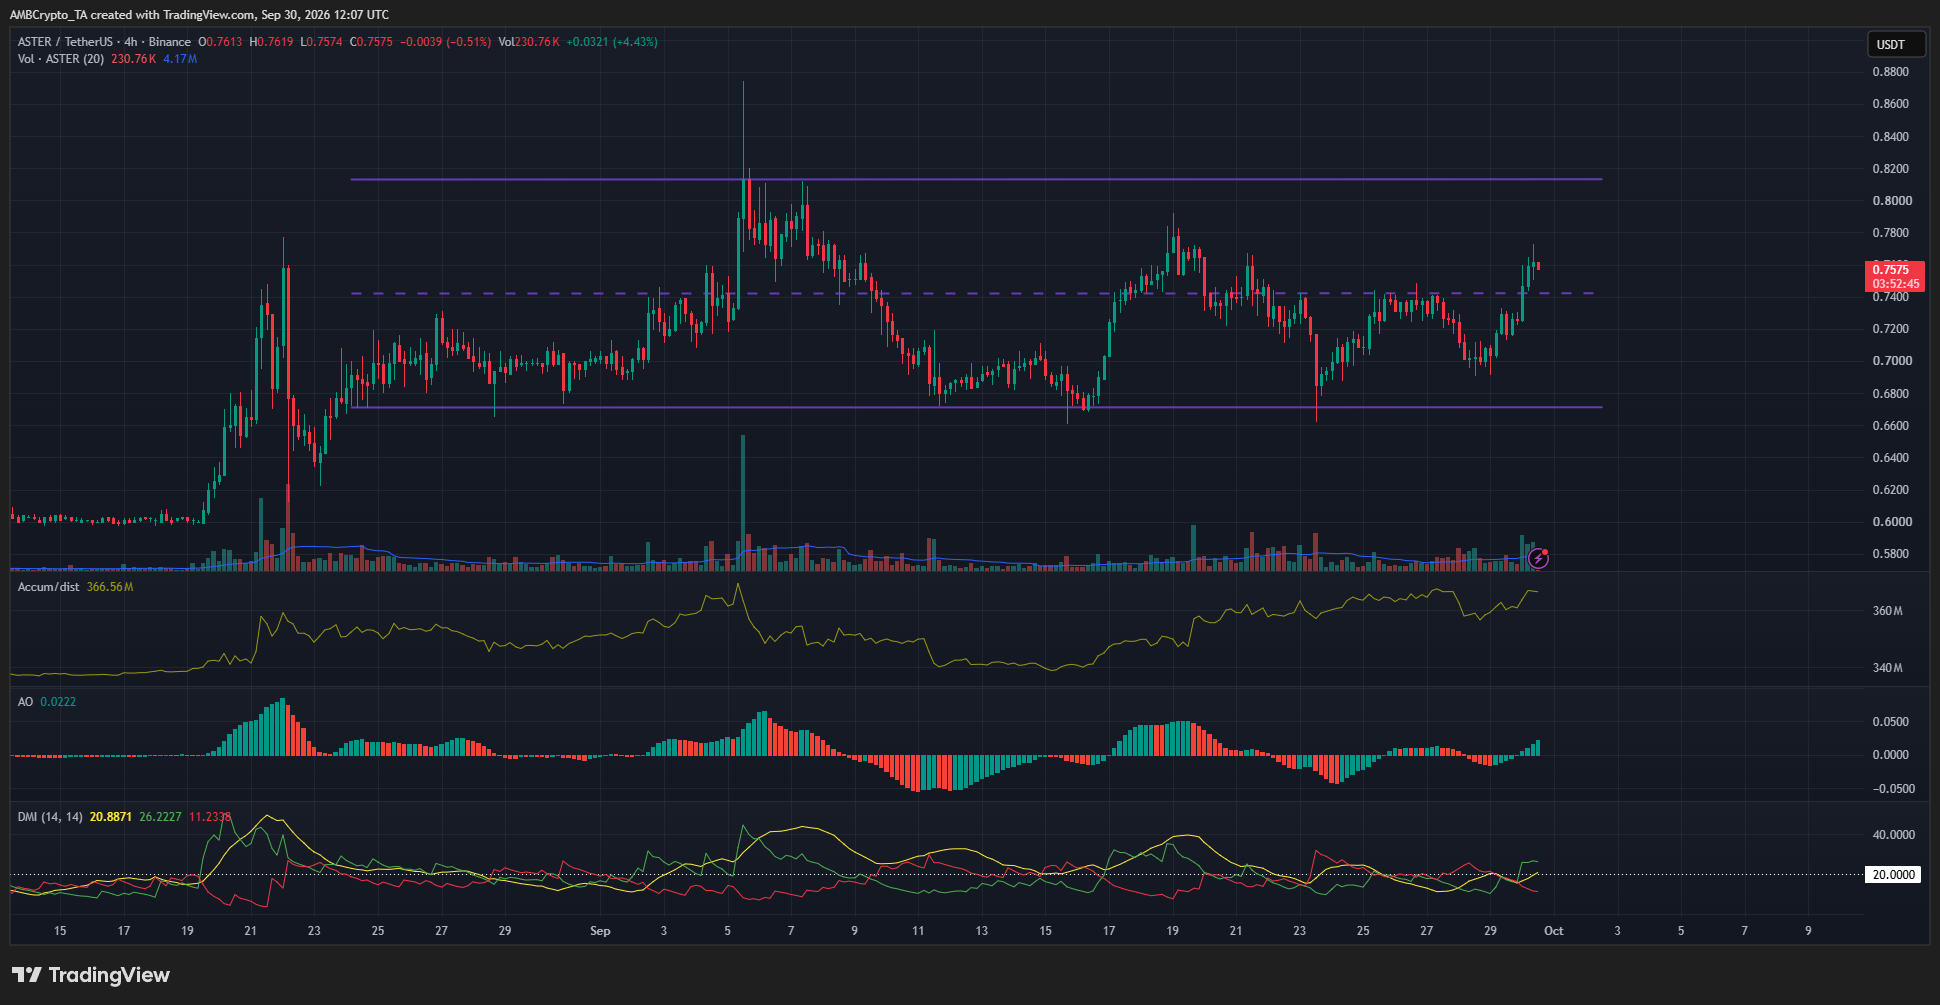
The uptrend in August gave way to a range formation (purple) between $0.67 and $0.81. The past 24 hours’ gains propelled ASTER prices above the $0.74 mid-range resistance.
The technical indicators also supported bullish momentum and increased buying pressure on the 4-hour chart.
Traders can anticipate a sustained move back to the range highs, and remember that a breakout past $0.813 would signal a long-term trend shift.
Final Summary
- ASTER’s price rally of 6% came alongside a 75% increase in daily trading volume.
- Over the past month, altcoin has been trading within a range, just below a swing high that has kept the higher timeframe swing structure bearish in 2026.