Bitcoin clears $85K, but is ‘Uptober’ setting up a bull trap?
Breaching $85K is good news, but for how long?



The “Uptober” frenzy is taking off across the market.
From a technical point of view, BTC’s 42% Q3 rally is already positioning for a better Q4. For BTC, Q4 has historically been one of its strongest quarters, with an average quarterly ROI in excess of 70%. However, for history to repeat itself, October will be crucial in setting the tone for BTC’s Q4 momentum.
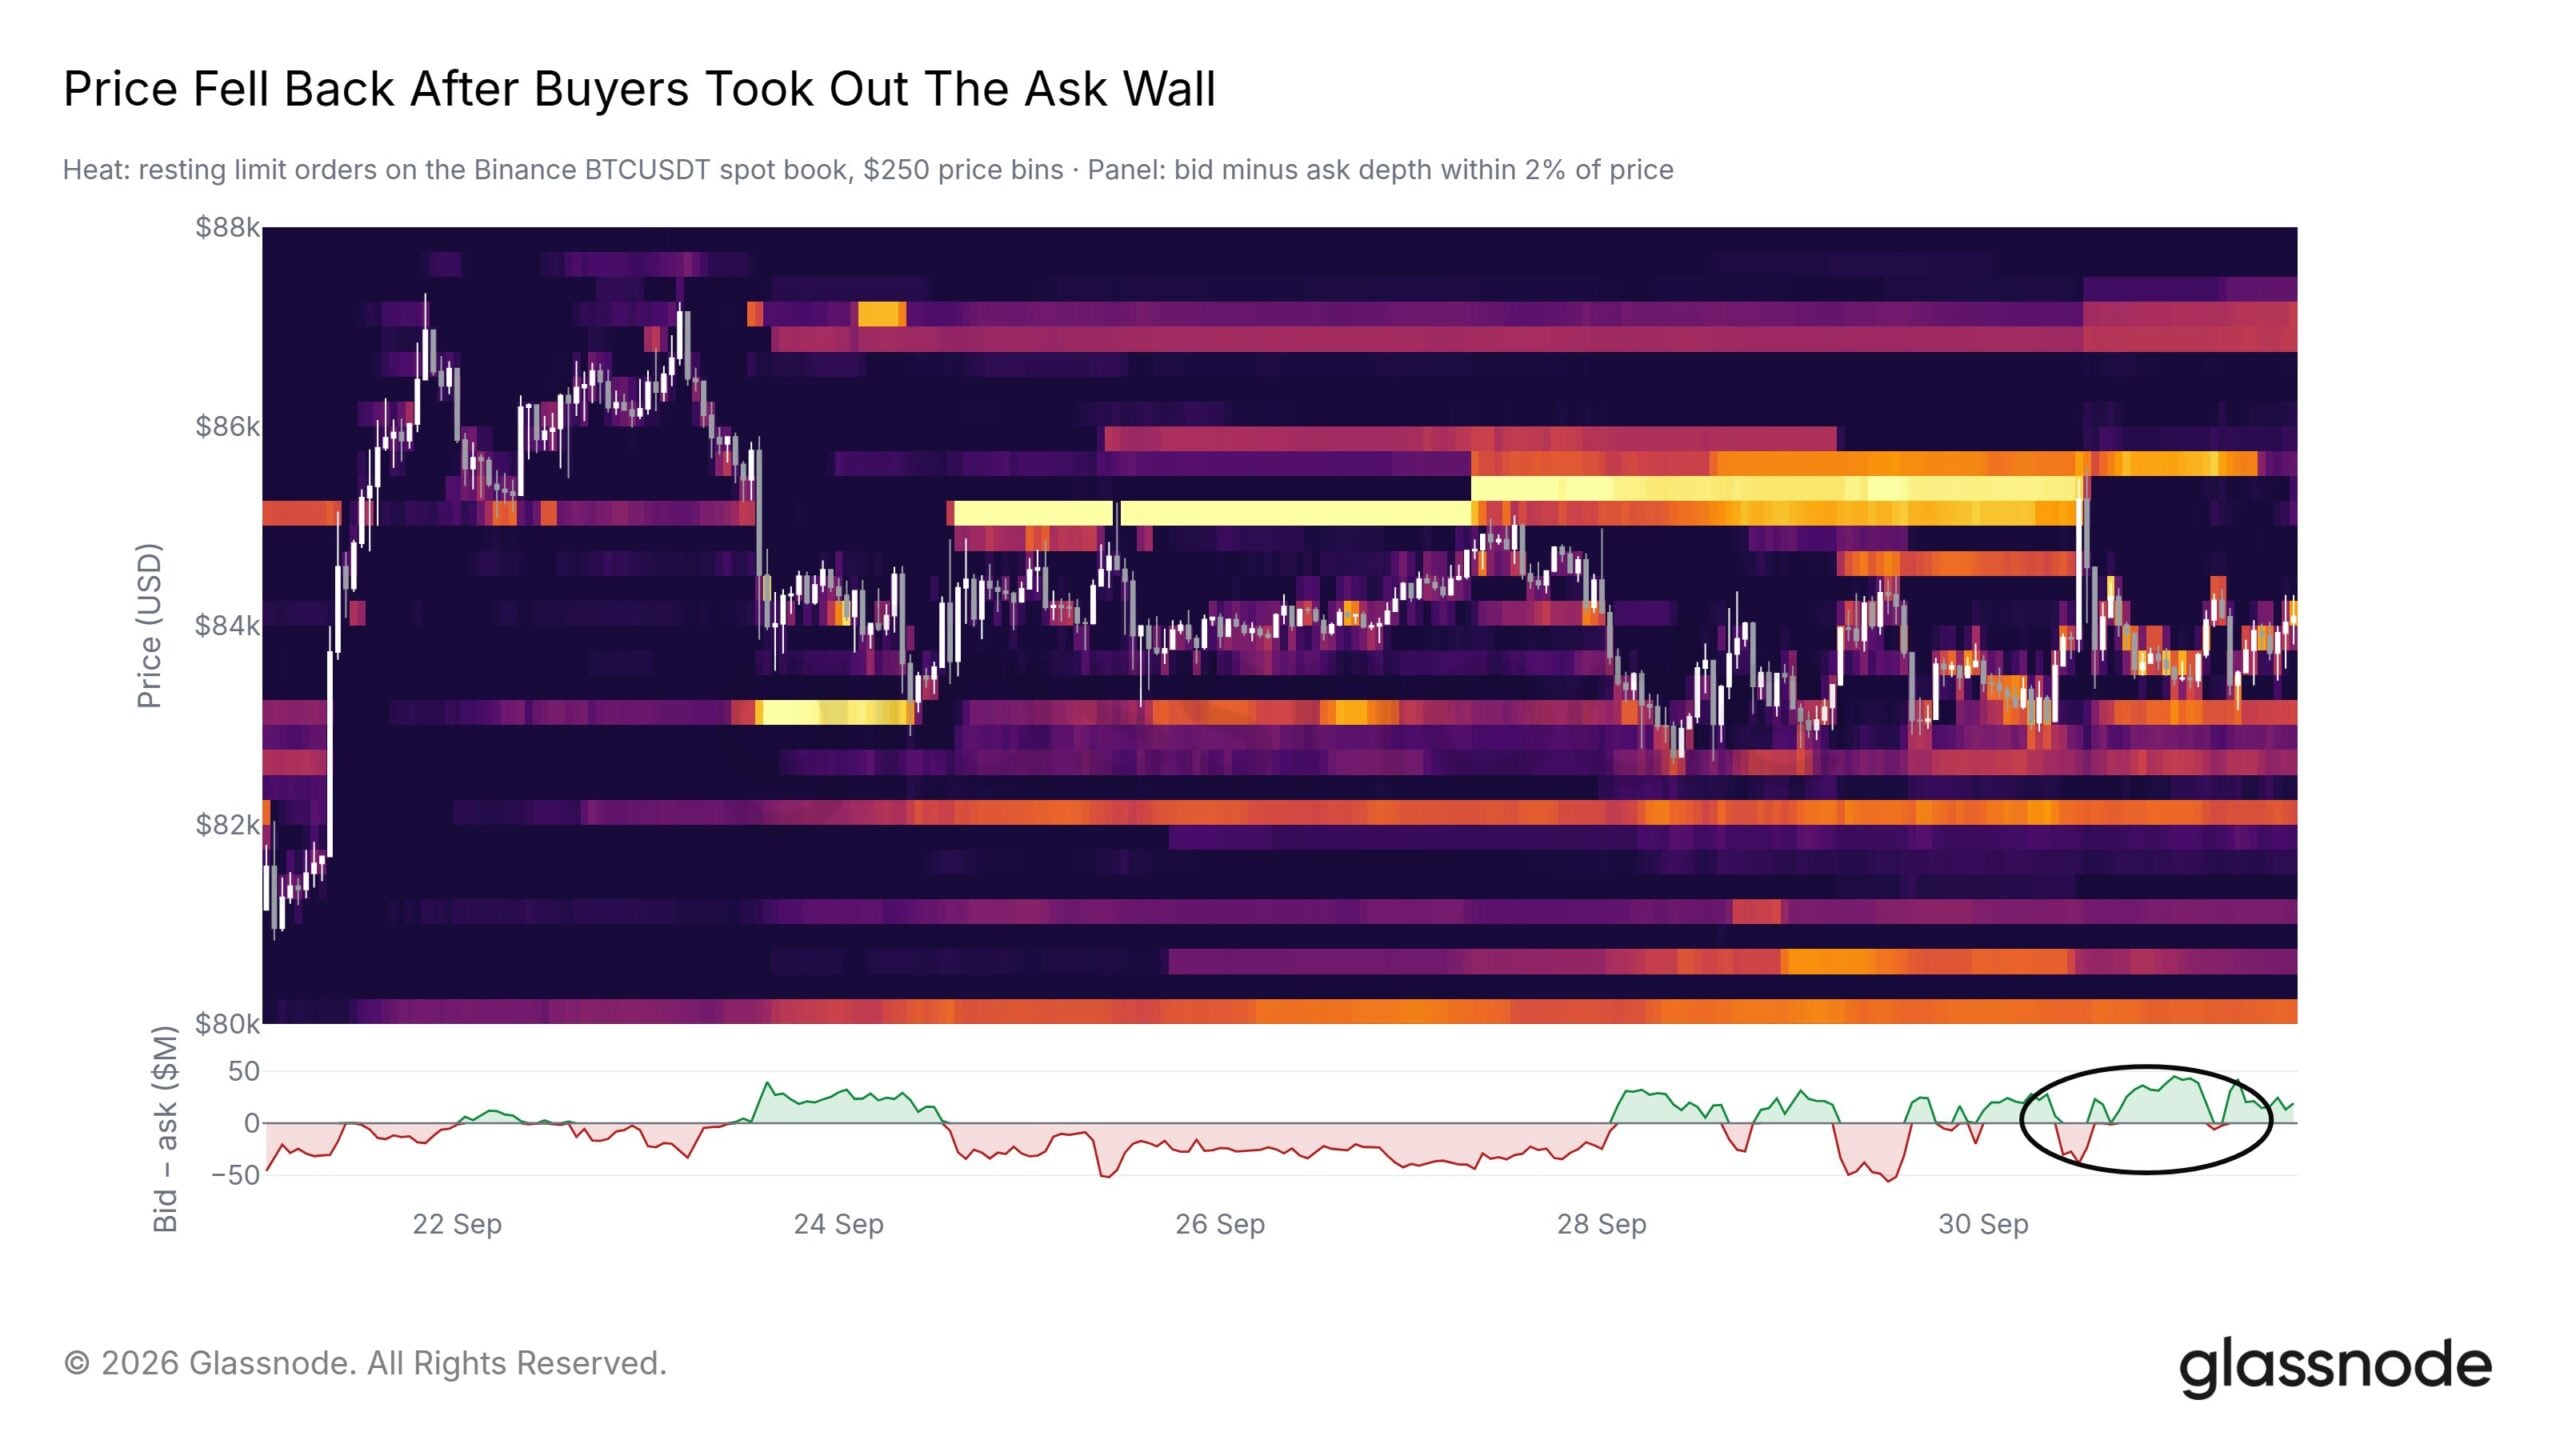
This is where the chart below becomes important. According to Glassnode, the sell wall above BTC has largely disappeared. Buyers took out the $85K wall yesterday after nearly a week of failed attempts. So, with less near-term liquidity sitting above BTC, the road higher could also be relatively easy, allowing for the price to move faster if buying takes off.
Notably, the macro setup could also support this move.
As per FedWatch data, rate hike odds dropped from 70% to 26% as expectations of a pause increased. This implies that the market may be slowly starting to price a more liquidity-friendly setup. Up until the recent macro releases, the market was cautious on Bitcoin, with macro FUD acting a key hurdle. Now, with that pressure easing, improving liquidity expectations could give Bitcoin room to extend its momentum.
Interestingly, the momentum seems to be picking up already too. According to CoinGlass, Bitcoin’s long/short ratio was once again above 1. This hinted at an increase in long positioning by traders. So, with the macro FUD easing, liquidity expectations increasing, and the sell wall thinning out, is Bitcoin [BTC] finally gearing up for its “Uptober” momentum?
Is Bitcoin’s $85K breakout a bull trap?
Bitcoin’s ongoing chop could be either accumulation or another fakeout.
While liquidity expectations are improving, the improvement has not been reflected in strong spot buying. U.S Spot Bitcoin ETFs closed September in the red, ending a nine-day inflow streak with $3.1 billion. The funds recorded $148.7 million in net outflows on Wednesday, with Fidelity’s FBTC leading the exits with $125.6 million, while BlackRock’s IBIT saw $9.5 million in outflows, ending its own nine-day inflow streak.
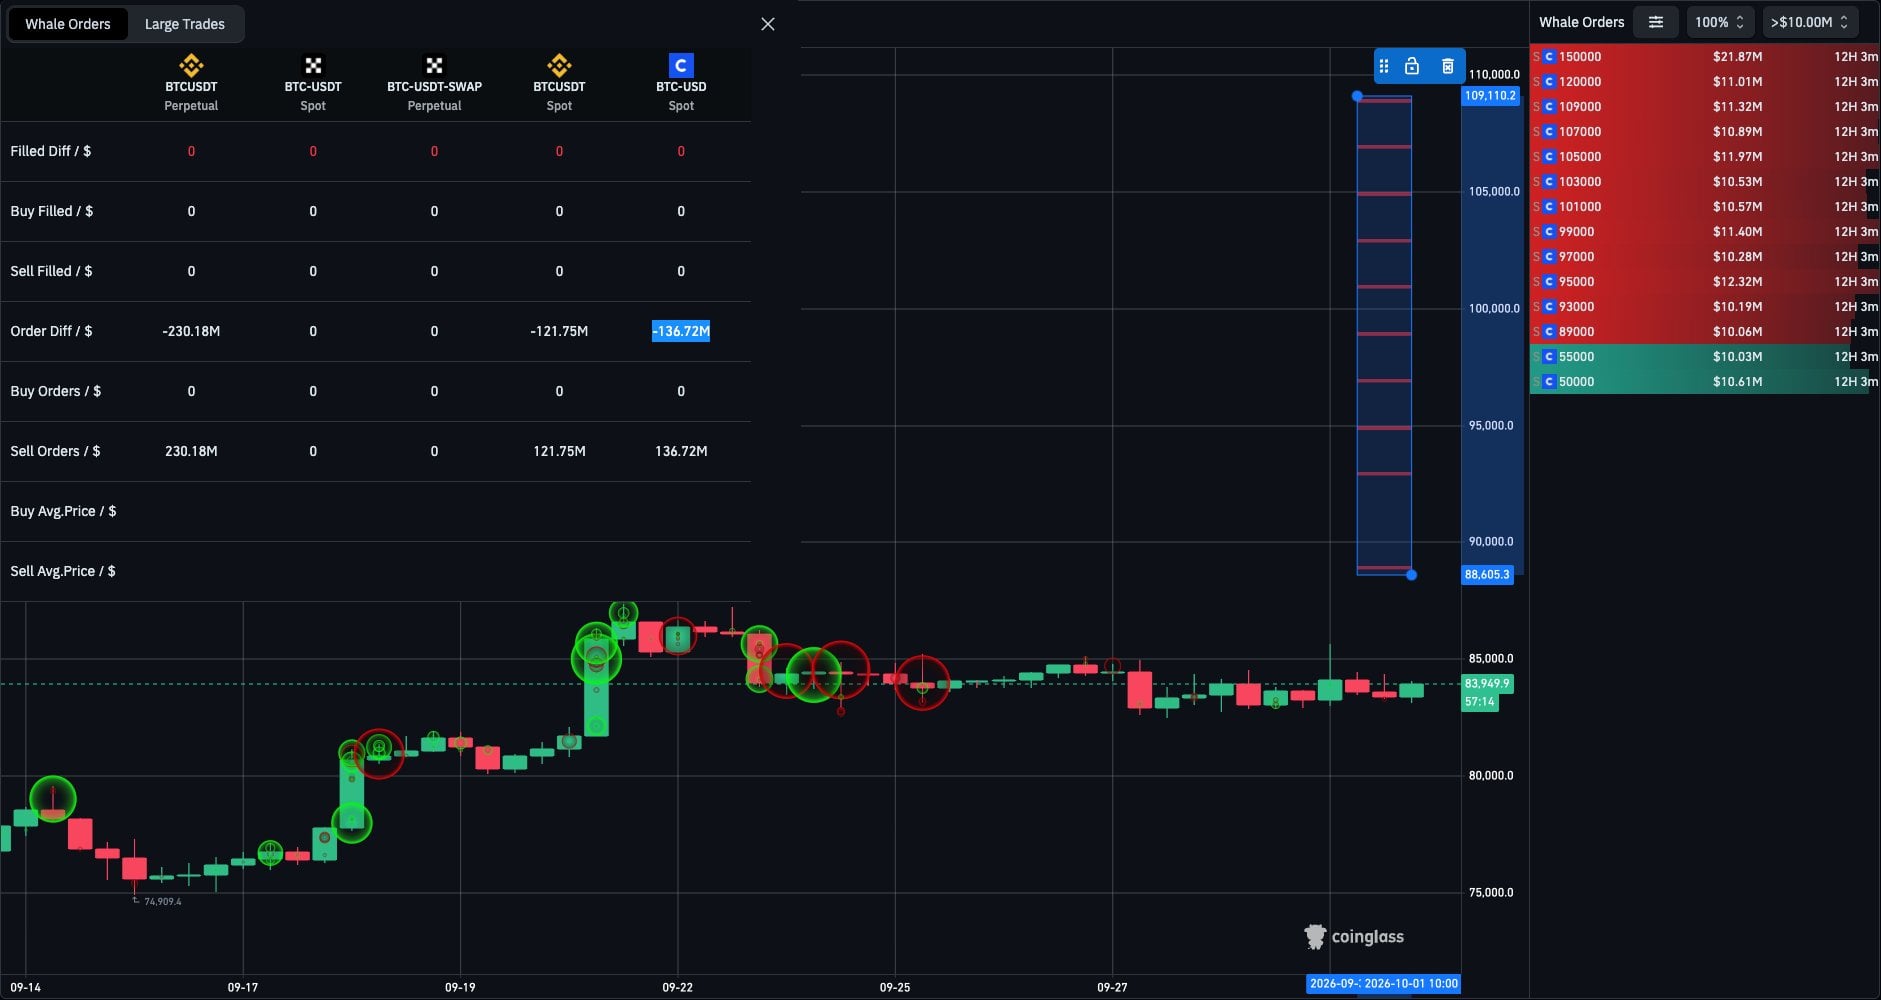
Now, the key question is whether this is the start of sustained outflows. While it’s still too early to confirm a trend, further outflows in this area may put further pressure on Bitcoin. $136.72 million in BTC spot sell orders are stacked between $89K-$109K on Coinbase. This overhead supply could act as resistance if spot buying remains weak, making it harder for Bitcoin to sustain its breakout.
Additionally, the outflows occurred just as rate cut expectations were cooling down, pointing to institutions still not fully pricing in an easier liquidity environment. This, in contrast to the bullish positioning in the Futures market, carving a discrepancy between the spot demand and the derivatives sentiment.
If this situation persists, Bitcoin’s $85K breakout will struggle to sustain itself.
With ETF flows turning red and sell orders building up above, the breakout still needs stronger spot demand to confirm the move. Otherwise, the recent move above $85K can turn into a fakeout, catching late bulls off guard and undermining Bitcoin’s early “Uptober” momentum.
Final Summary
- Low selling and improving liquidity could push Bitcoin higher.
- Weak ETF flows and heavy sell orders could turn the $85K breakout into a fakeout.