Wormhole crypto falls to $0.0138 – Why bulls face THESE downside risks
Without an influx of sizeable buying volume, W prices would likely struggle to keep hold of the $0.0129 anchor.



Wormhole [W] has faced a highly volatile two weeks of trading. Measured from Friday, the 9th of October, to the time of writing, Wormhole crypto prices have faced an 8.21% slide.
During this slide, the altcoin managed to rally 109.78% from $0.0151 to $0.0317, before receding to the current price of $0.0138.
Despite the heavy volatility, the altcoin appeared to hold on to its bullish price structure. There are some levels buyers can keep an eye on, but they also need to be wary of a bearish resumption.
The higher timeframe Wormhole crypto bias
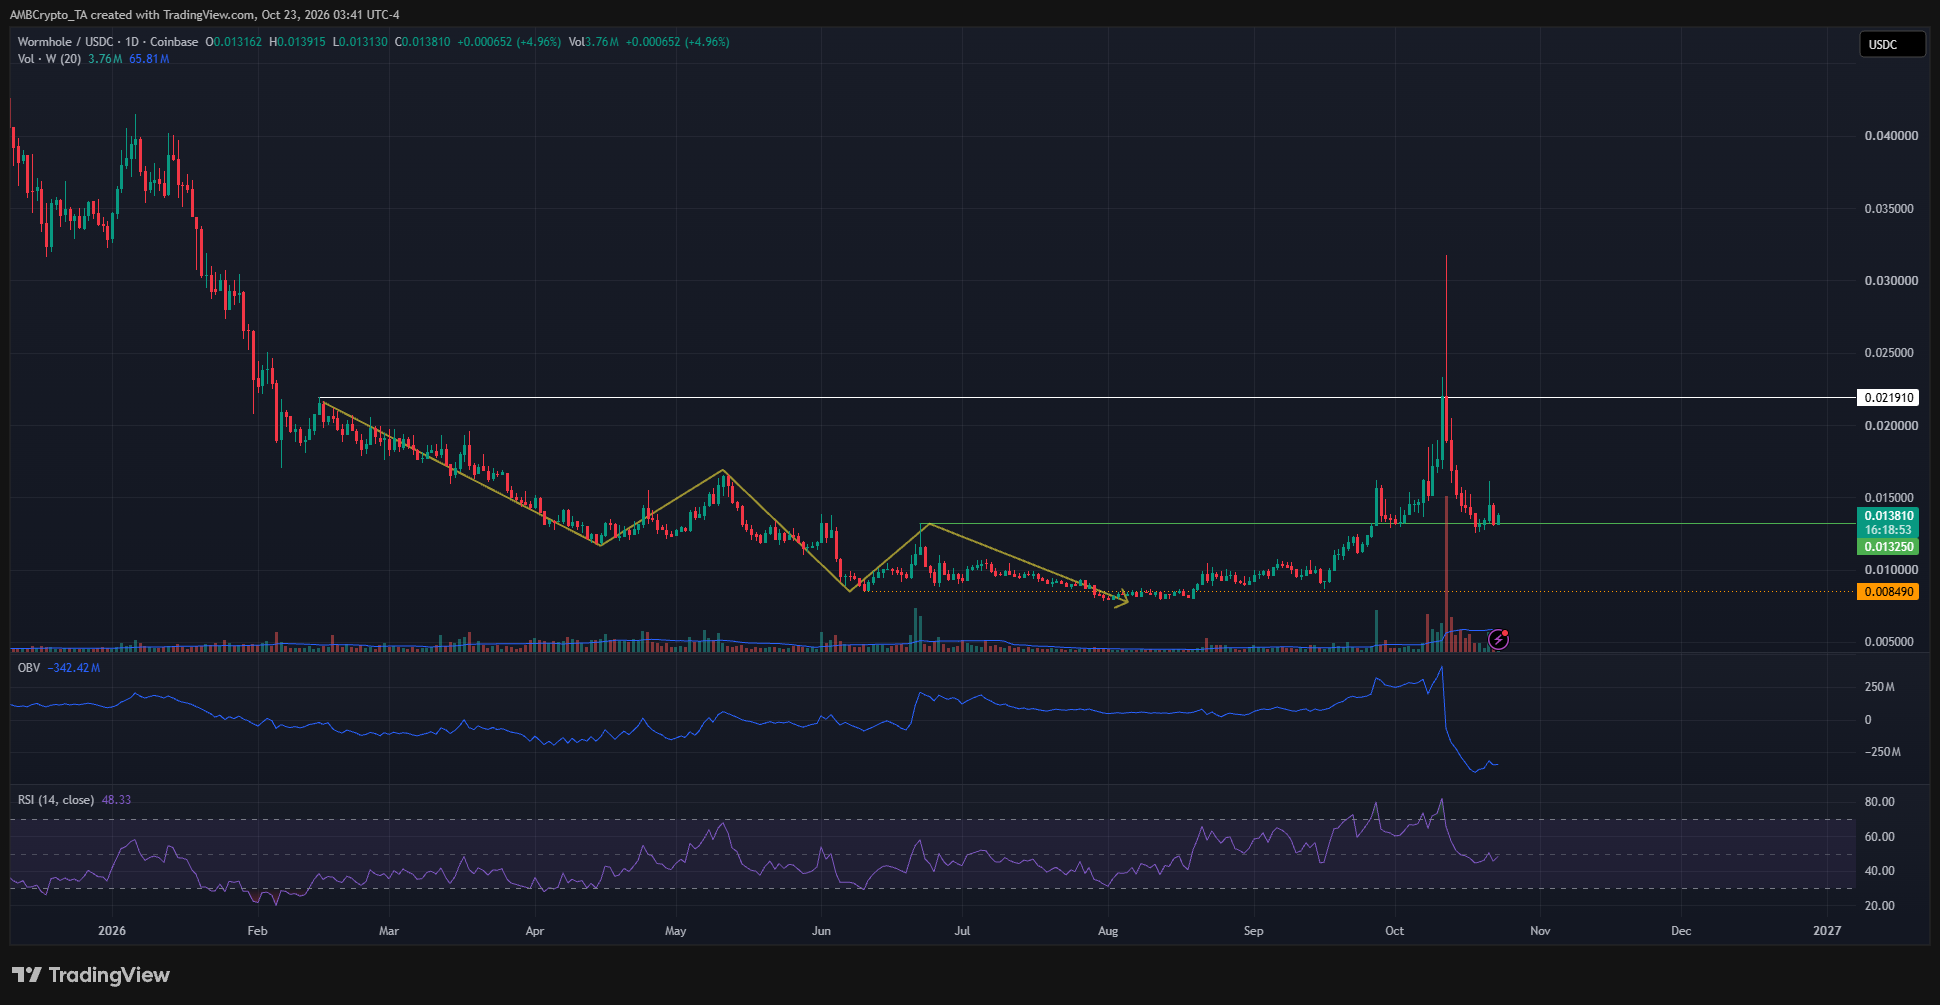
The bearish trend in place for most of 2026 was plotted in yellow. The latest swing high in the downtrend, made in June at $0.0138, was breached in September. This breach of the previous lower high broke the structure and flipped it bullishly.
Since then, the Wormhole crypto price has surged to a new high of $0.0317, a level that the altcoin was last trading at in January 2026.
The surge toward yearly highs and a shift in the price trend was anchored in place by the swing level at $0.0129. The bulls came perilously close to losing this anchor during the recent retracement.
At the time of writing, a daily session close below $0.0129 has not yet occurred. If it does, it would mean that the structure was bearish again.
Swing traders and investors might have to conclude that the recent rally was a liquidity grab, engineered for holders to take profits and exit.
Can W bulls keep the uptrend alive?
The technical indicators on the 1-day chart appeared pessimistic. The OBV took a nosedive after the recent correction and the huge selling volumes after the $0.0317 top was formed.
The RSI on the timeframe also highlighted a bearish bias after it sank below the neutral 50.
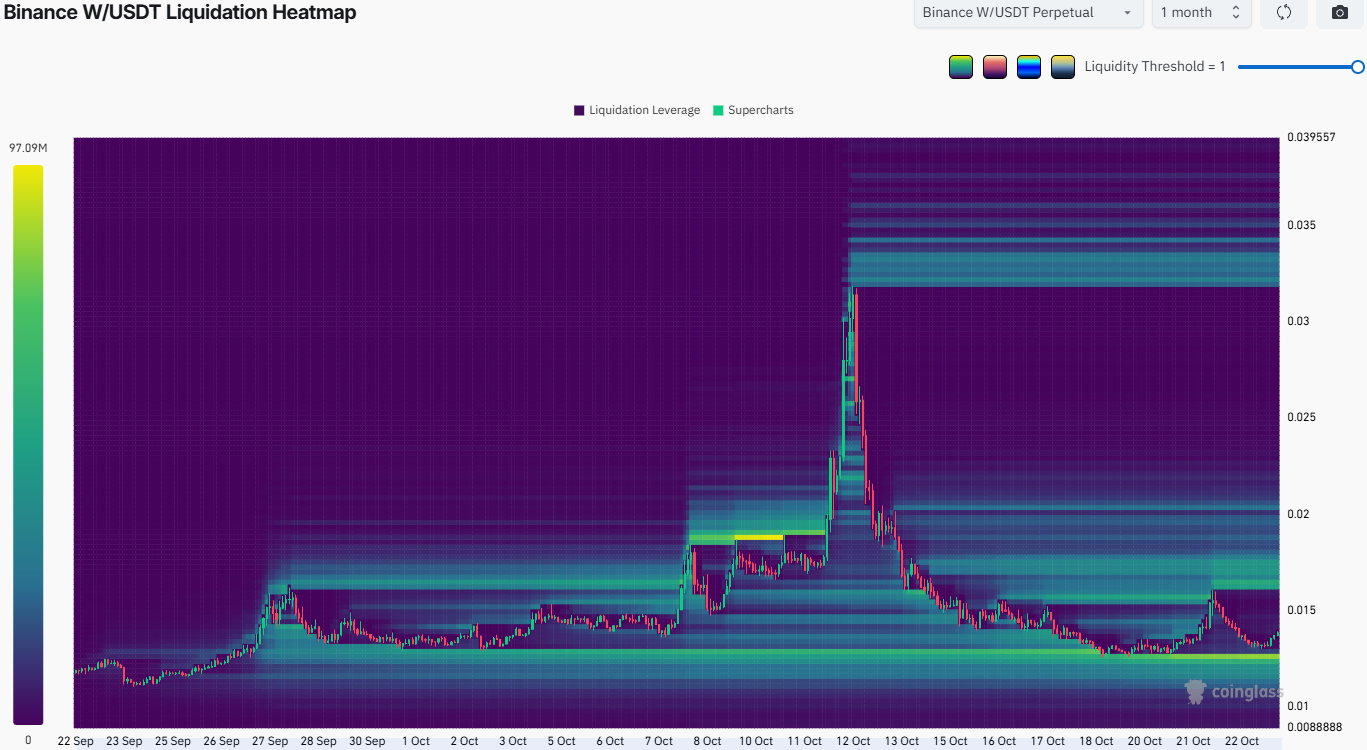
The liquidation heatmap drew attention to the nearest magnetic zones swing traders need to watch. A sweep of the $0.0120-$0.0125 area and a bullish price reaction would be an encouraging sight for the bulls.
Meanwhile, a rally into $0.0161-$0.0177 has the potential to face a setback unless heavy spot demand can keep the impulse move going.
Final Summary
- Wormhole has experienced heavy volatility in the past two weeks, rallying close to 110% in three days before shedding close to 60% over the next eleven days.
- The $0.0161 and $0.0125 levels of supply and demand would be the next key levels for swing traders to watch.