QNT crypto’s price now down 50.5% from September’s high — Should you buy now?
QNT's price slide below $223 and $200, combined with news of the Binance hack, dented market sentiment.



Quant [QNT] has shed 50.5% of its value from the $373-high it made on 27th September. The most recent losses saw QNT crypto’s price fall below the psychological $200-support.
News of the Binance hack to the tune of an estimated $6.3 billion, the largest in history, has also driven markets into a selling frenzy. In fact, Bitcoin [BTC] slipped below the $80k round-number level too, spurring altcoin losses.
In this environment of steady selling and a month-long retracement, Quant might be offering a high-risk short-term buying opportunity. Swing investors might want to wait a bit longer for a momentum shift confirmation before looking to re-enter.
Sizeable September rally keeps current structure firmly bullish
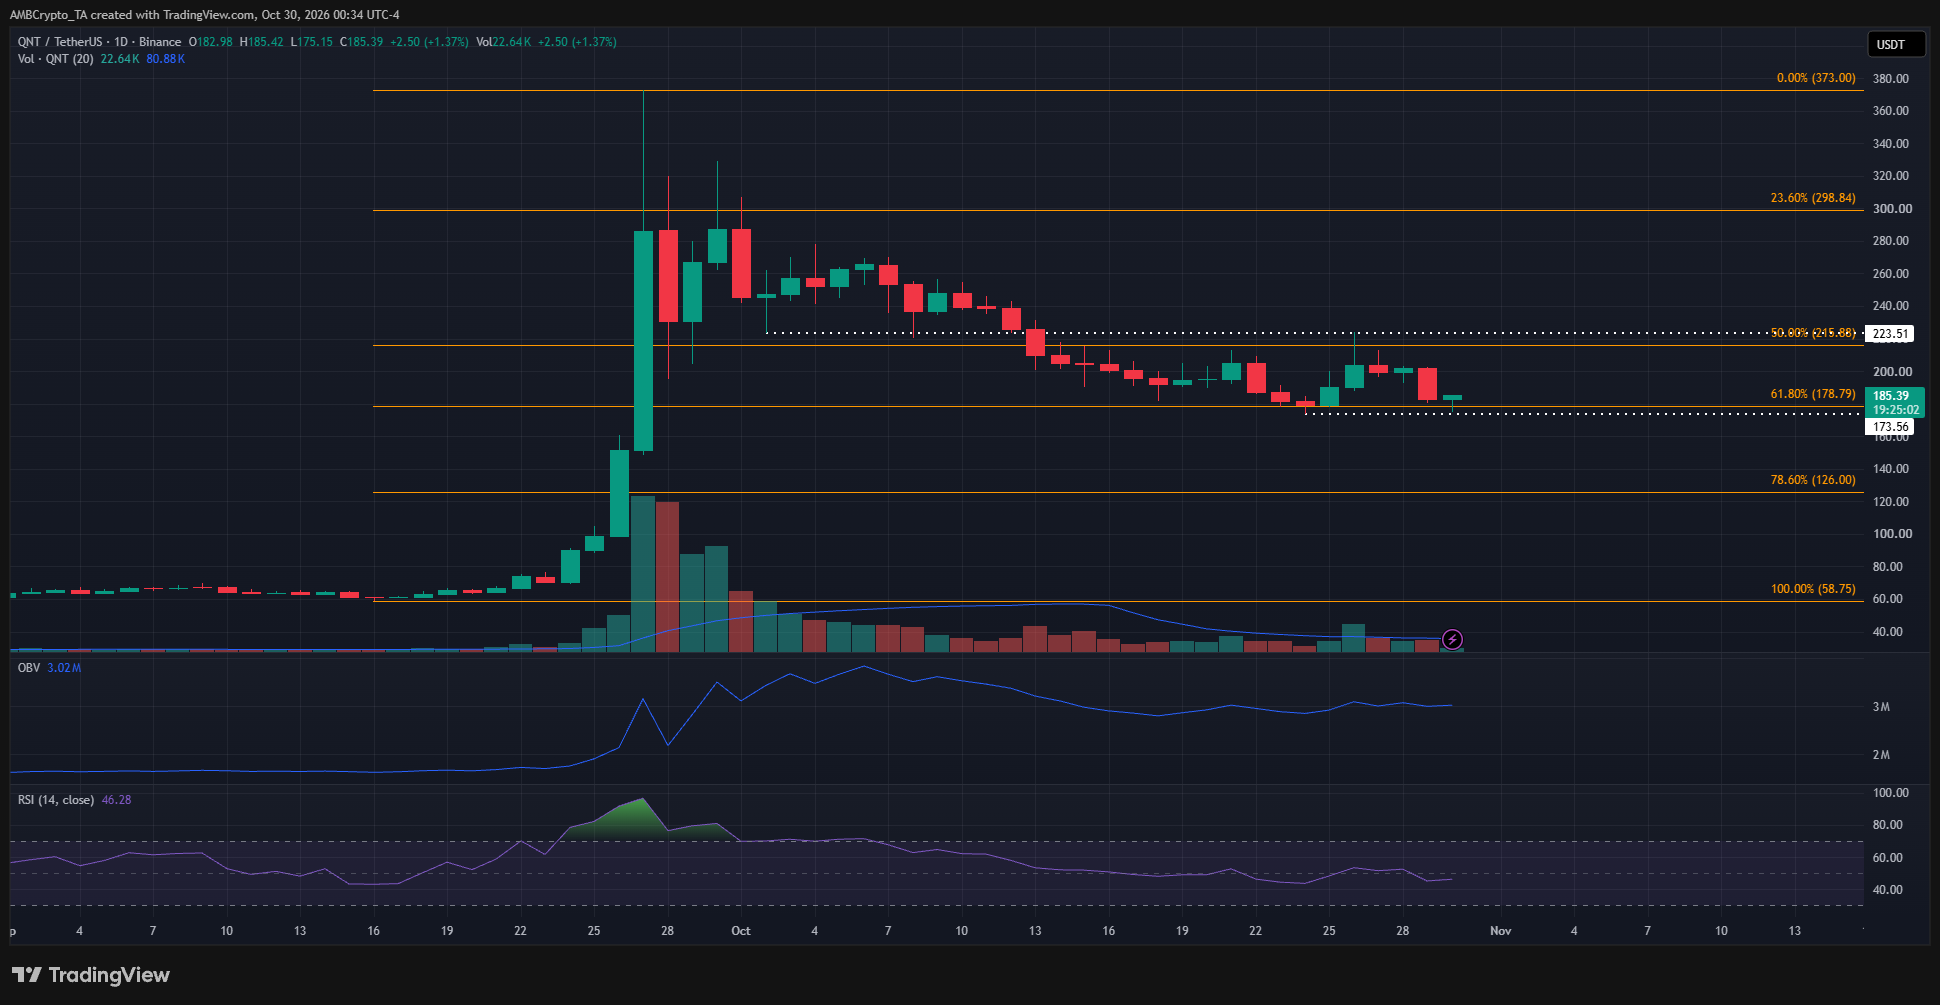
The swing structure on the daily chart was bearish, captured by the Fibonacci retracement levels (orange). At the time of writing, the 61.8% retracement level at $178.8 was being respected as support.
Even so, the internal structure was bearish, as evidenced by the price dip below $223.5 earlier this month to form a new local low at $173.56.
In the coming days, a daily session close below $173.5 would be a sign that QNT’s price was heading towards the 78.6% retracement level at $126.
Traders should remember that sentiment remains fragile following the Binance hack news.
QNT’s price bounce expected due to H4 shift
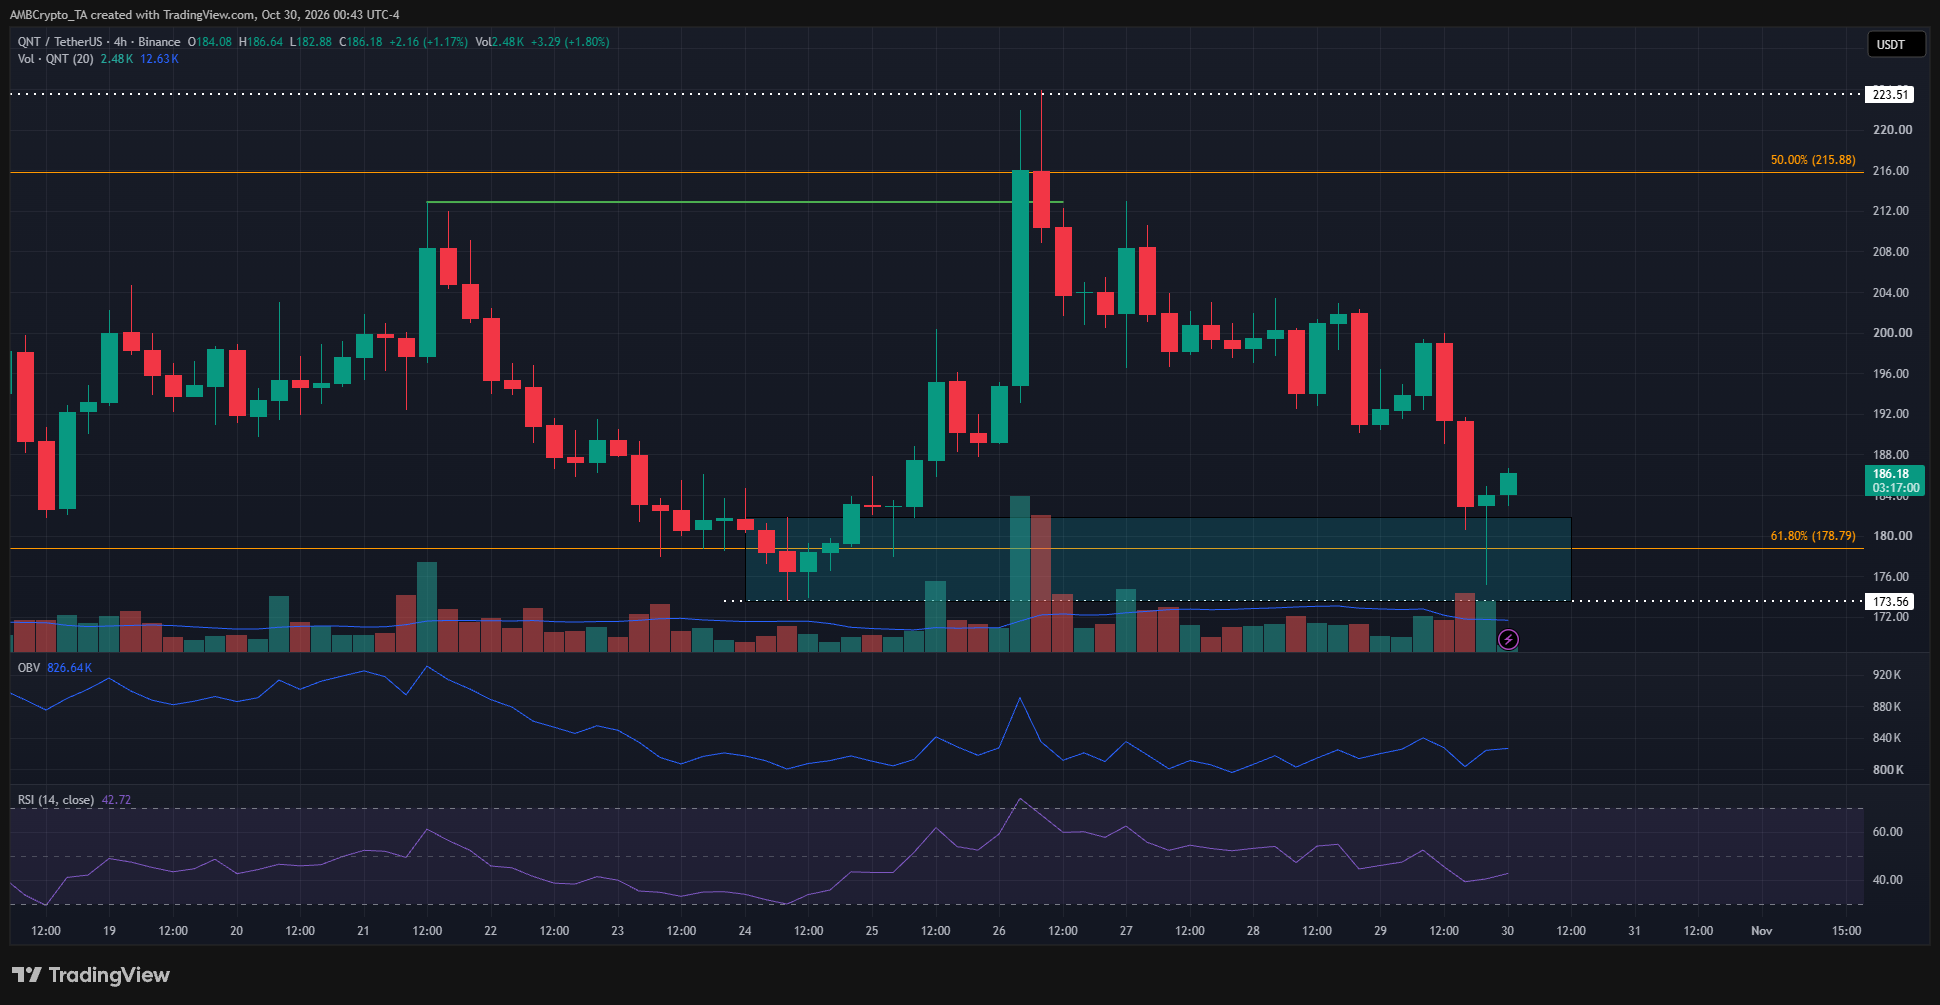
The 4-hour chart seemed to be more encouraging though. The bullish structure shift made earlier this week, when the price broke above the $212.87-swing level, was still intact. The subsequent retracement back towards $180 might be ending.
The technical indicators did not yet show a reversal. The OBV was balanced between buying and selling pressure, and the RSI moved below neutral 50.
Based on the price action, buying QNT at these prices could be feasible. The bullish target would be $223.5, while invalidation lay below $173.56.
As the daily chart showed, a drop below $173.5 could see a QNT price slide all the way down to $126.
Final Summary
- The Clearing House partnership and cascading long squeezes fueled QNT’s bull trend.
- A price drop below $173.5 would signal QNT price weakness, but for now, the narrative could regain strength if the wider market begins to recover.