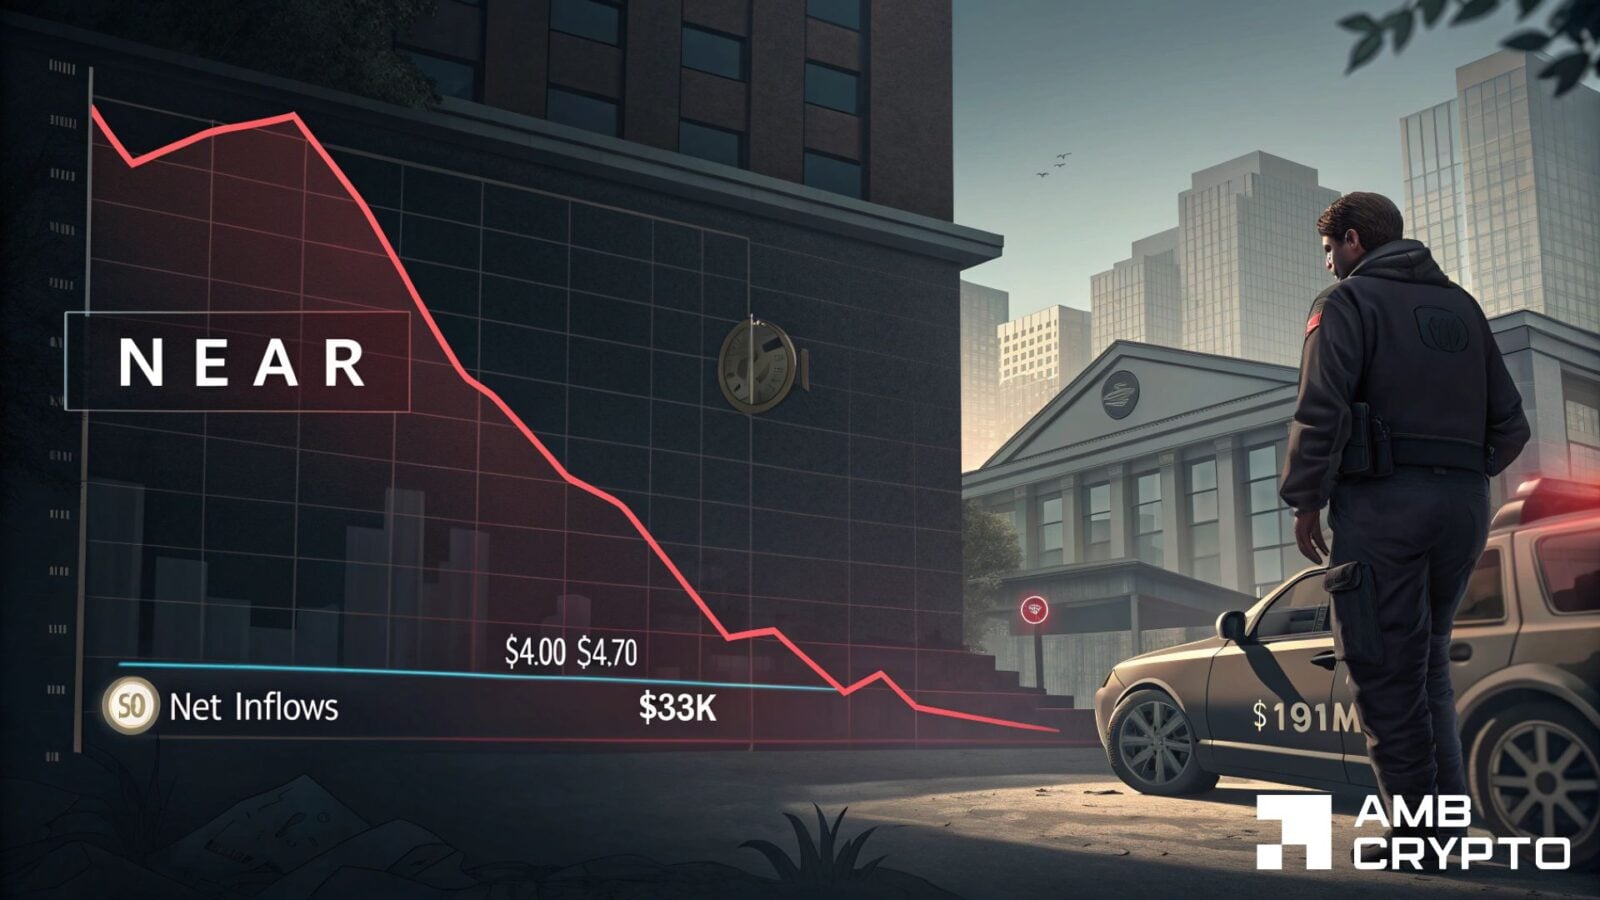
Hyperliquid faces 22% correction threat as H&S pattern tests $76-neckline
Recent liquidity sweep of the $97-zone and the subsequent correction strengthened the idea that the bulls were not in control.



Bitwise CIO Matt Hougan recently highlighted the price performance of top crypto assets in 2026. Among the top 20 crypto assets, he found that the median is down by 15%, while the mean is up 14%.
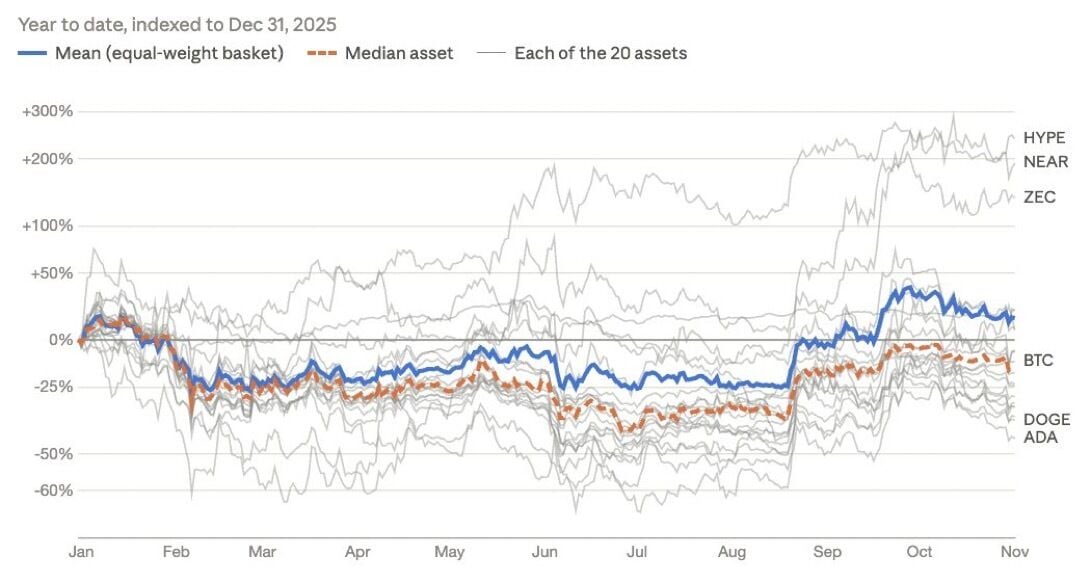
Outliers like Hyperliquid [HYPE], NEAR Protocol [NEAR], or ZCash [ZEC] have comfortably outperformed the mean.
Warning signs for HYPE bulls
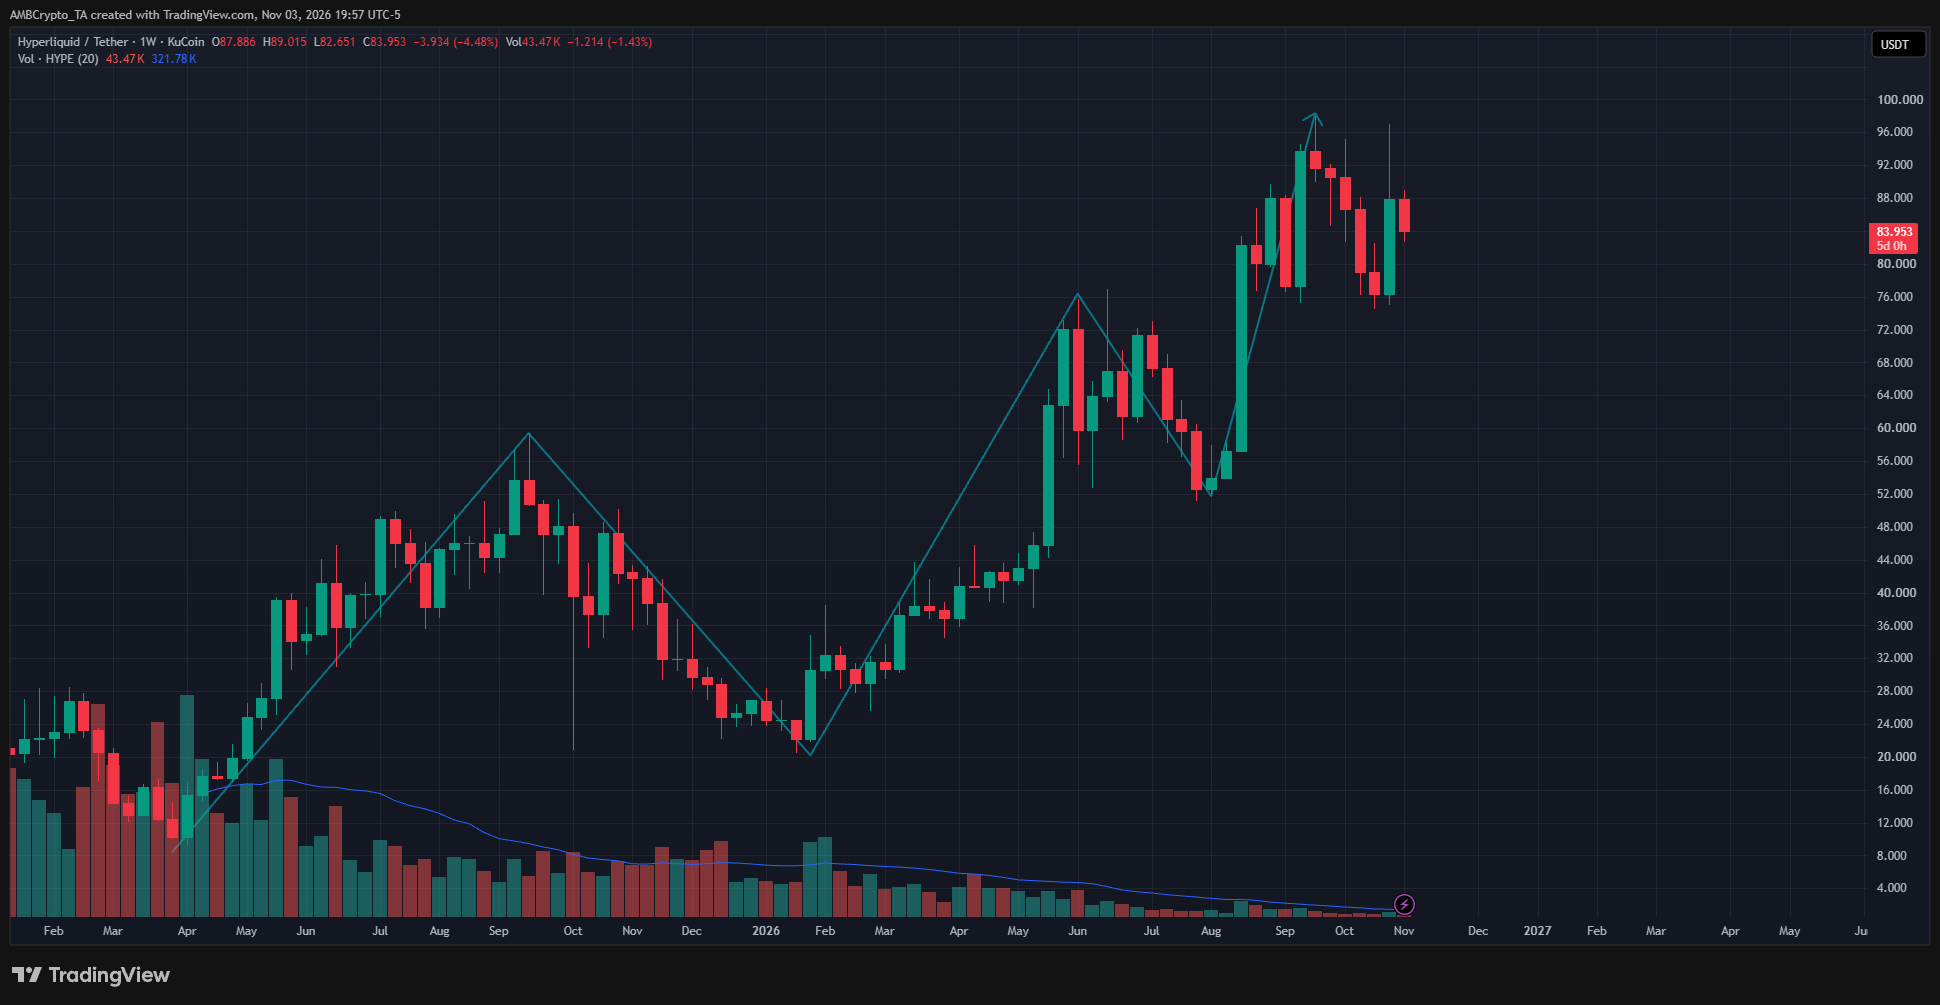
At the time of writing, Hyperliquid’s weekly trend was bullish. In recent weeks, the altcoin has failed to push to new highs past $98, and its dip to $75.17 suggested a retracement might be in play.
The bounce to $97 on Thursday, 29th October, was followed by a 14.19% setback in the six days since. The price spike was a result of the Intercontinental Exchange (ICE) announcement that it would partner with Hyperliquid to introduce a regulated perpetual futures market in the United States.
In fact, crypto market maker Cumberland warned that Hyperliquid’s order book is fully transparent, and trades can be tracked.
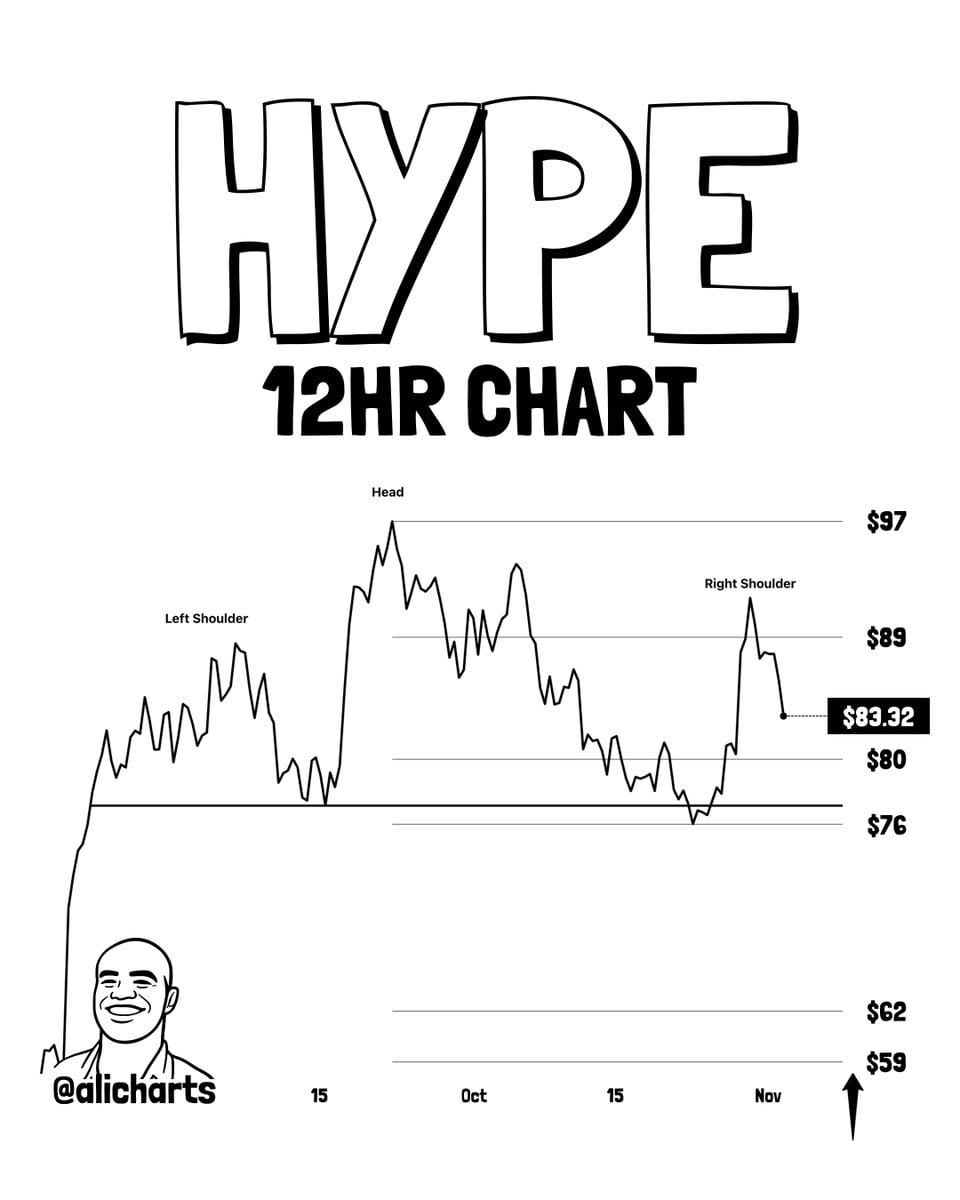
That’s not all either as popular crypto analyst Ali Martinez observed that a potential head and shoulders top pattern may be forming for HYPE. A 22% correction is possible if the pattern is confirmed, which would happen with a 12-hour session close below the $76-$78 neckline.
In that scenario, the next price targets would be $62 and $59.
What about the next magnetic zone to the south?
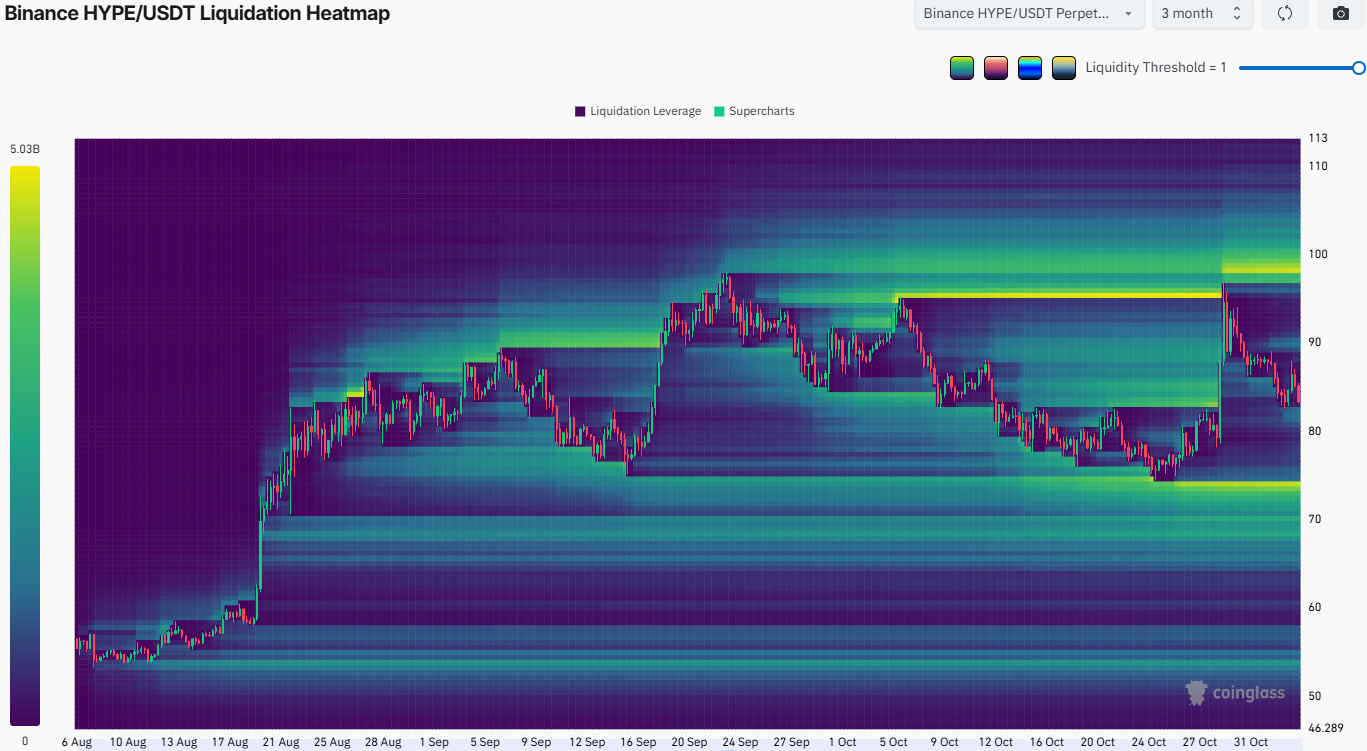
Recent weeks’ price swings from $75 to $98-$99 have built up sizeable pools of liquidity to either side. Key liquidation clusters have been swept too, with the latest being the dense short liquidations at $95.5.
The next pocket of liquidity sat at $74. HYPE’s retracement argument reinforced the bearish price bias too.
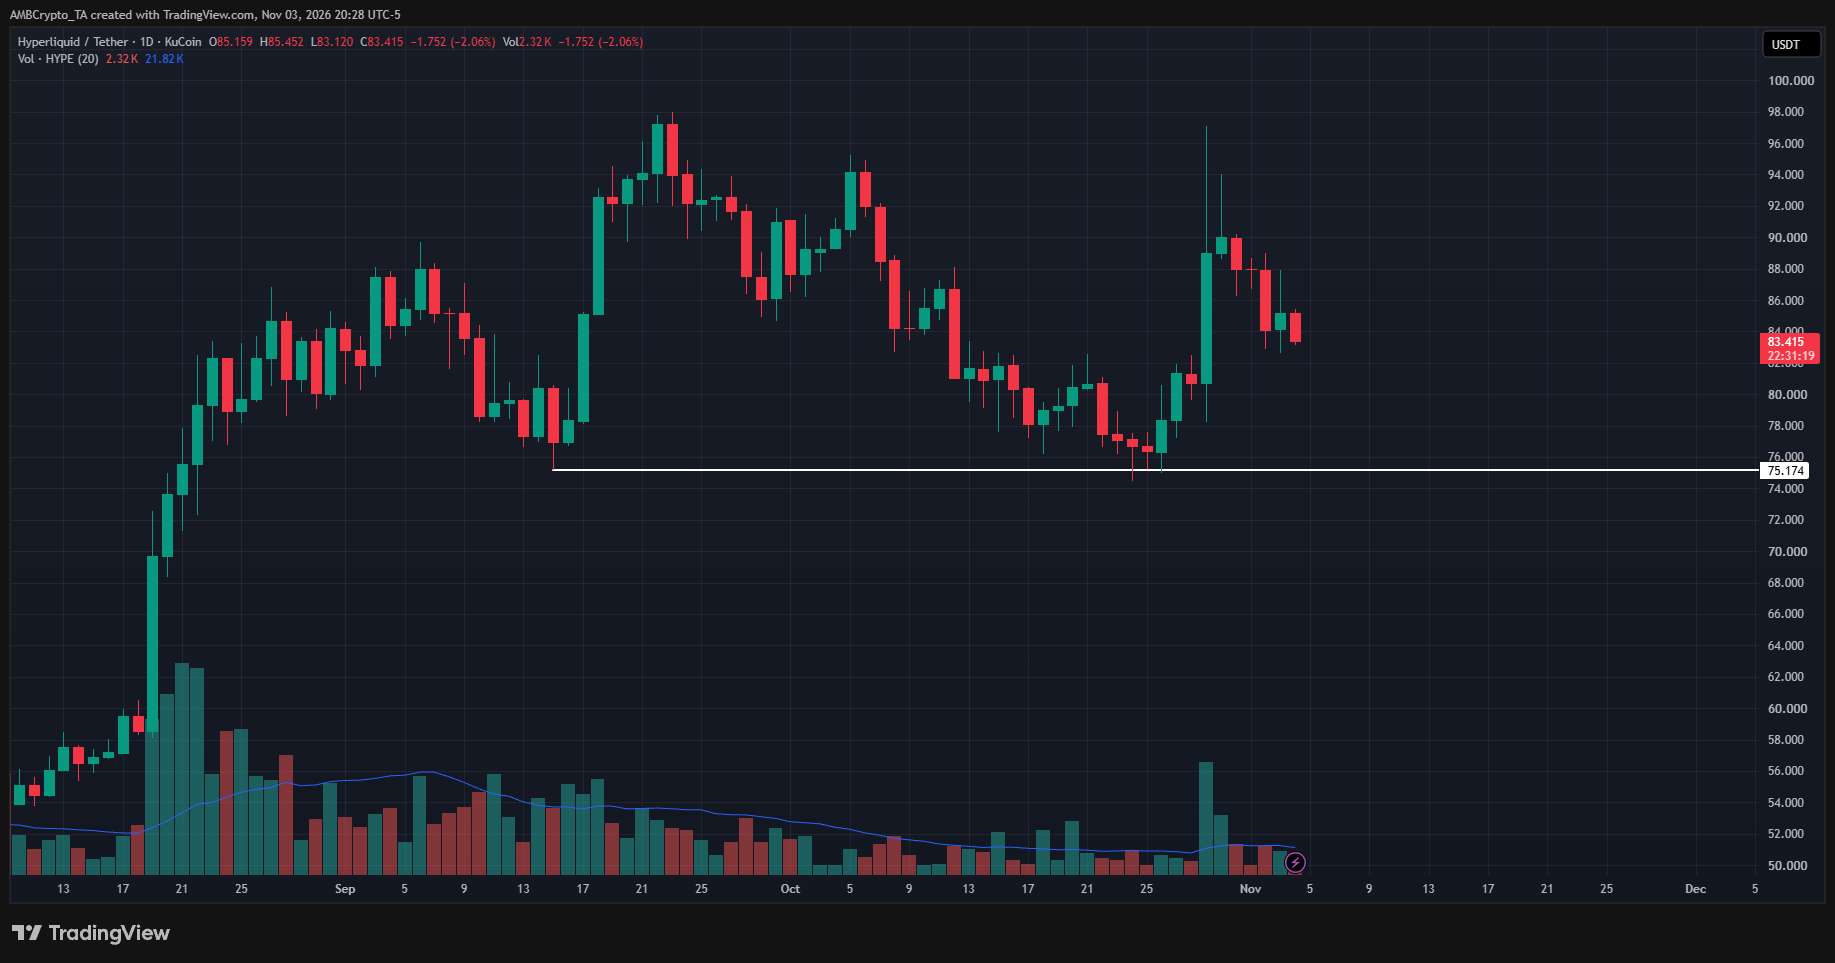
It was pointed out previously that the altcoin has failed to push to new highs on the charts. The recent liquidity sweep of the $97-region and the subsequent correction strengthened the idea that the bulls may not be in control of the market.
Rather, sellers showed clear intent with the recent losses and could succeed in driving a price correction below $75.
As Ali Martinez suggested, a pullback to $59-$62 may be possible. It would still be a healthy retracement within the weekly bullish trend.
Final Summary
- Hyperliquid’s token has been one of the top crypto assets with a bullish performance far beyond the mean asset returns in 2026.
- Price action hinted that a price drop below $74, as low as $59-$62, may be possible.