Chainlink price prediction: How LINK can avoid a breakdown below $8
Chainlink saw an 11.6% slide in Open Interest and a 7.3% price decline in 24 hours.



Many of the large-cap crypto assets were deep in the red amid intense selling pressure in the past 24 hours. Chainlink [LINK] was one of the assets with the most bearish sentiment in the speculative markets.
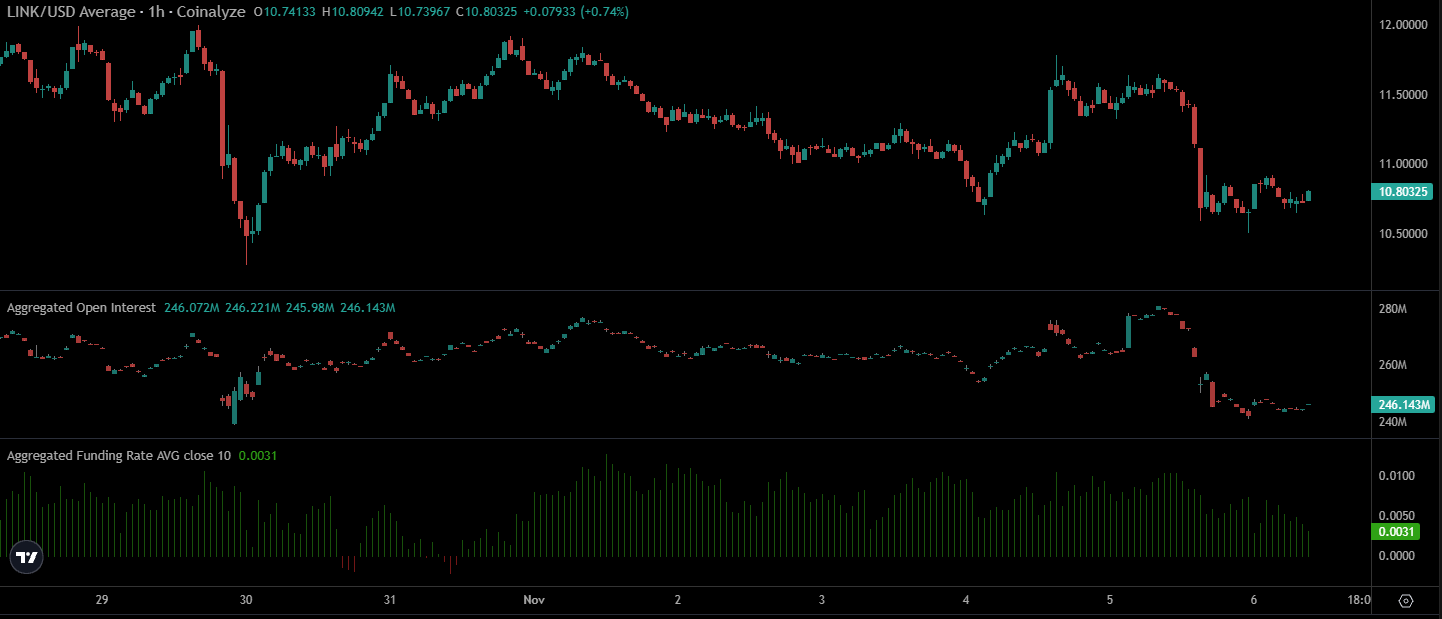
At the time of writing, the Open Interest (OI) fell 11.6% in 24 hours alongside a 7.3% price slump as the The Funding Rates also retreated toward zero but were still positive.
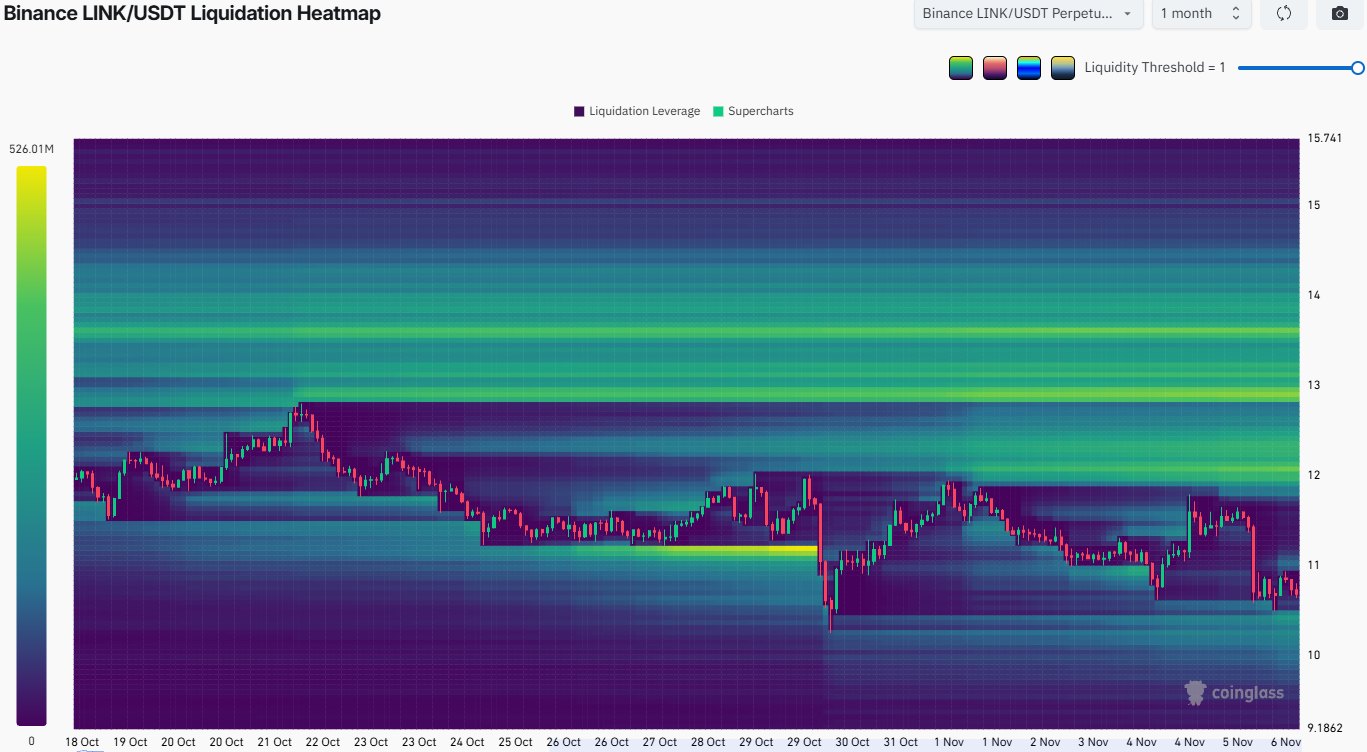
The past month’s liquidation heatmap revealed a notable magnetic zone at $12 and another just under $13. These clusters of liquidity could attract LINK prices higher in the short term before a move lower.
In related news, Chainlink expanded access to Asian stock markets. This tokenization push has not bred new demand for the altcoin.
Examining Chainlink’s higher timeframe movement
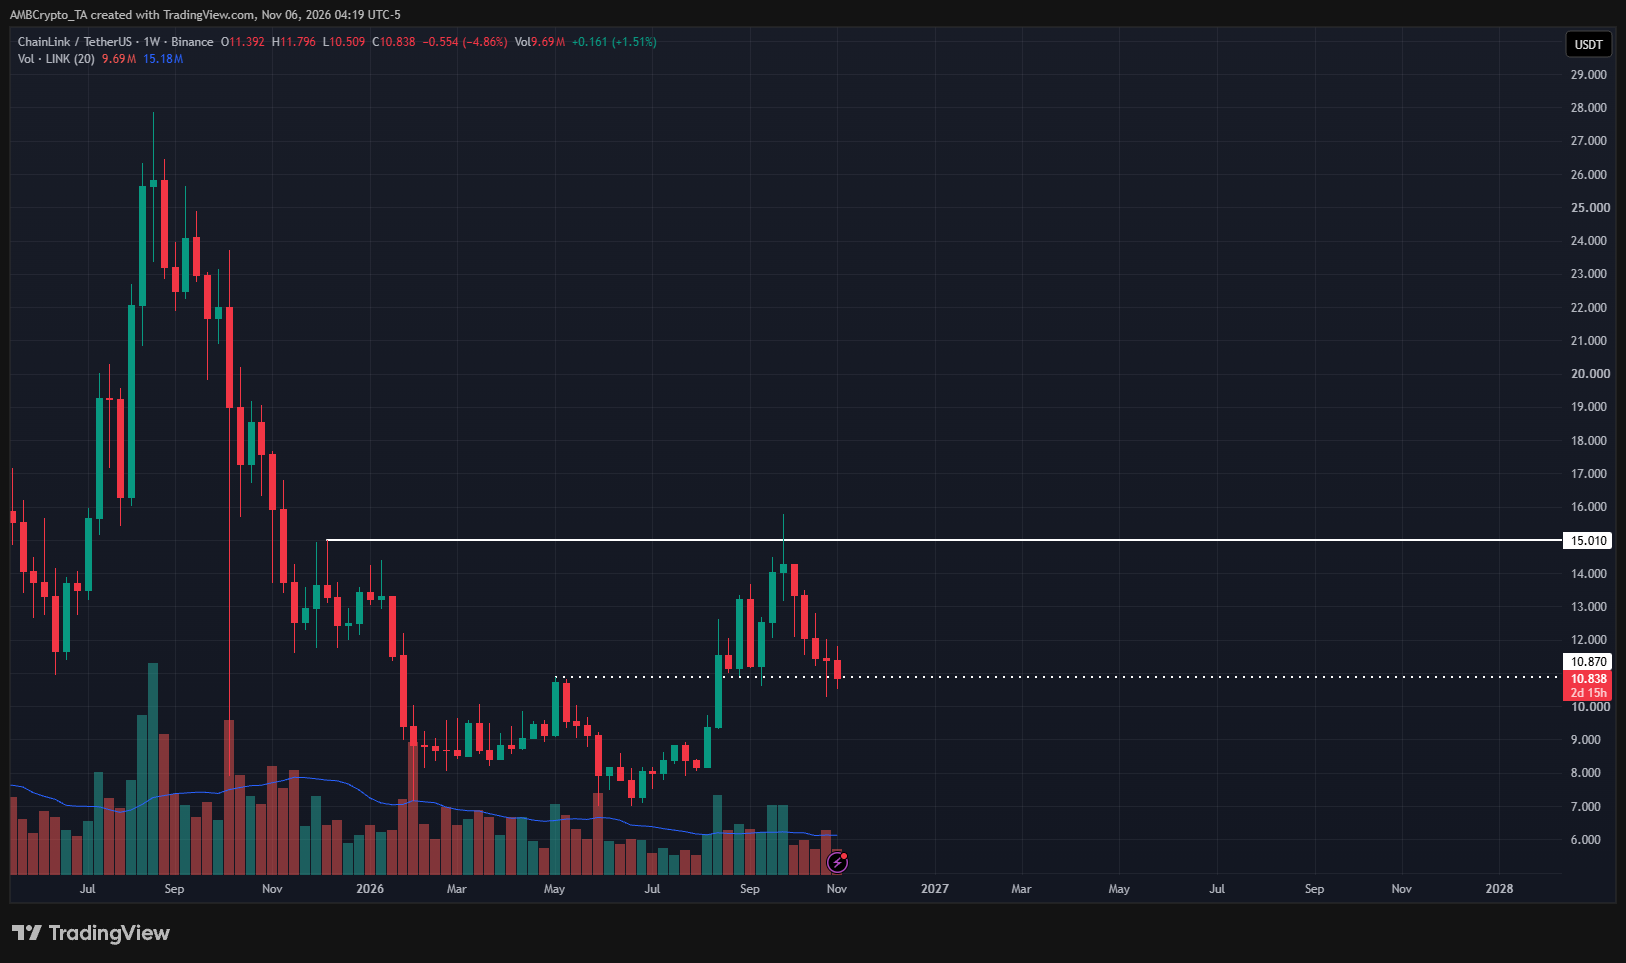
The weekly chart revealed a swing level at $15 that the altcoin swept in September before falling lower. Another swing point at $10.87 was on the verge of being broken.
A weekly session close below this level would suggest a move toward $7.88, and $7 could be the next multi-week price leg.
As the liquidation heatmap showed, there was a smattering of liquidity around $10.30, which had a confluence with a recent weekly low of $10.27. Hence, a bullish short-term scenario would be a price sweep of $10.27 followed by a bounce past $11.80.
Chainlink bulls unable to overcome trendline resistance
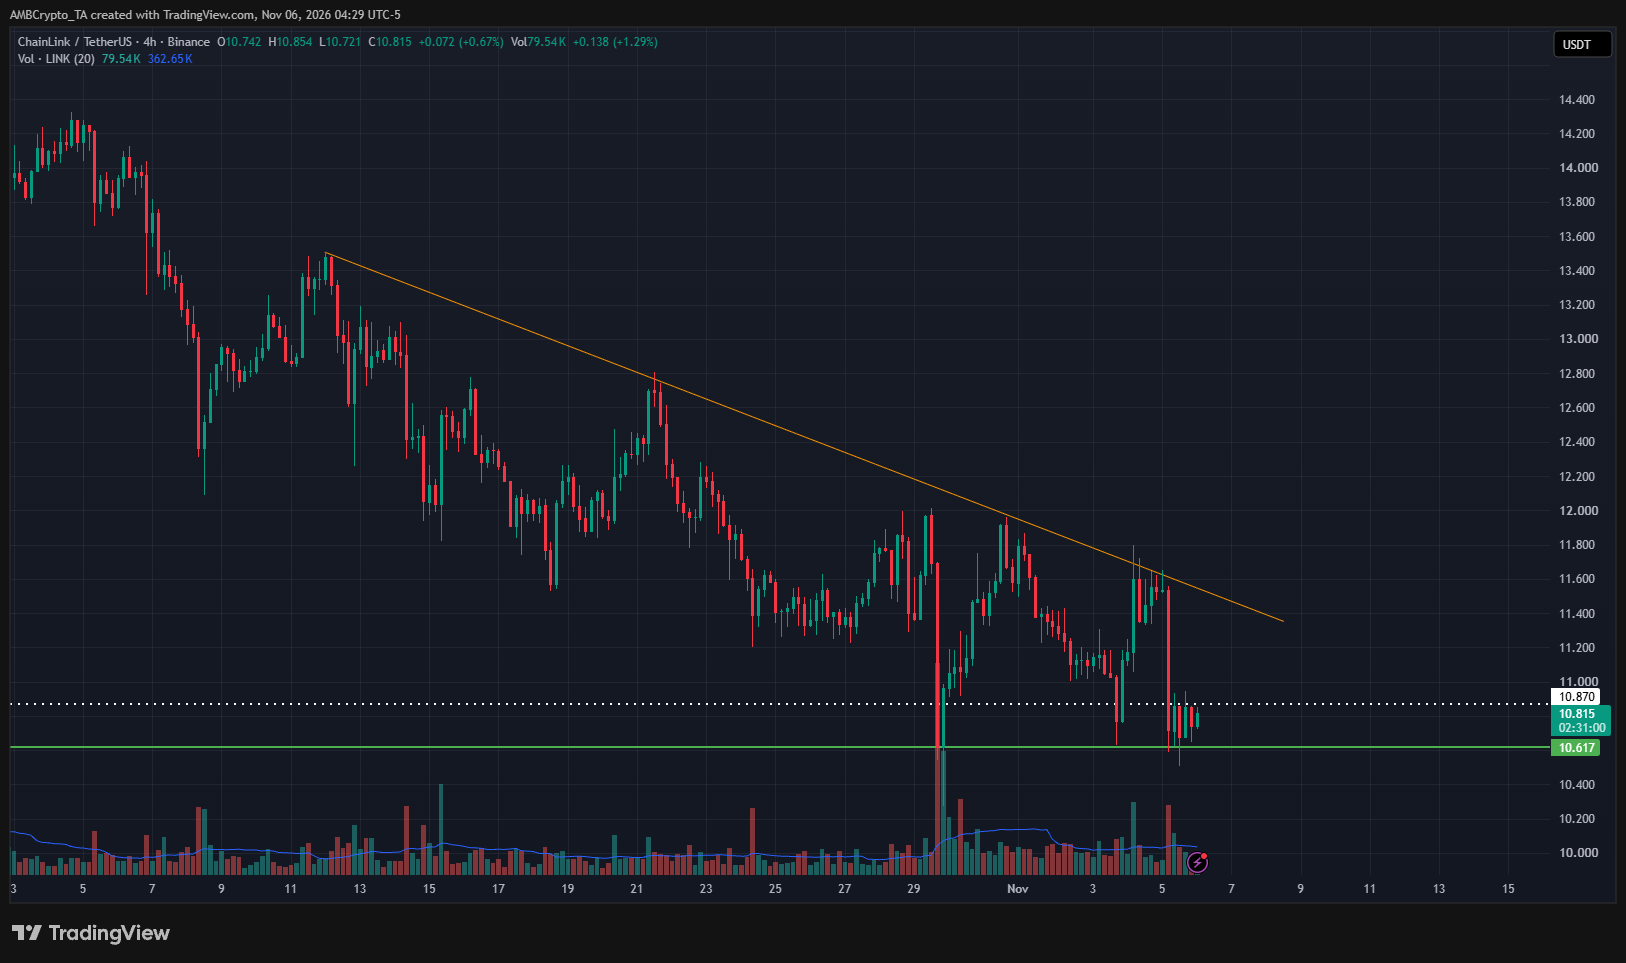
For weeks now, Chainlink has seen a steady bearish trend sustained on the 4-hour timeframe. In particular, the month-long trendline resistance (orange) was a formidable opponent for buyers.
Additionally, it could be decision time for LINK. The $10.61 swing low from mid-September was under increasing pressure from the sellers, evidenced by the lower lows in recent weeks. Moreover, something has to give, and it is likely to be the buyers’ resolve.
Final Summary
- Chainlink saw an 11.6% slide in Open Interest and a 7.3% price decline in 24 hours, making its short-term outlook among the most bearish in the top crypto assets.
- The repeated challenge of the $10.6-$10.8 zone and steady selling pressure meant LINK could be headed towards $7.88 in the coming weeks.