Can PEPE break $0.0000052 while the rest of the crypto market is falling?
The price compression on the 4-hour chart alongside repeated tests of the nearby supply zone signaled a potential upward breakout.



In the past 24 hours, Bitcoin [BTC] and Ethereum [ETH] have shed 1.87% and 5.27%, respectively. Following weakness in stock markets, particularly tech and AI, as well as a broader risk-off market sentiment, crypto has been negatively affected in recent weeks.
Crypto rocked by traditional Futures market volatility
More than $1 billion in leveraged positions across crypto have been wiped out in the past 24 hours due to a sharp sell-off in the stock market.
The S&P 500 Futures showed $300 billion in market cap wiped out a minute after the market opened, and just six minutes later, the losses were reversed.
Bitcoin slipped below the psychological $75k level as a result of the selling. It continued its bearish momentum, as did Ethereum, which was on the verge of sliding below the $2,000 support.
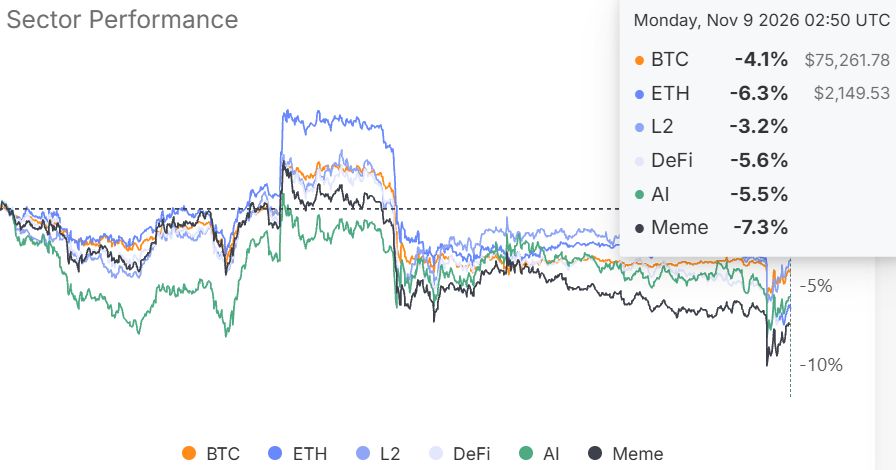
Over the past week, the memecoin sector was one of the worst performers, data from Glassnode showed. The sector’s market cap was down 7.3%, compared to Ethereum’s 6.3% loss or Bitcoin’s 4.1% drawdown.
Even Dogecoin [DOGE] was down 8.1% in a week. By contrast, Pepe [PEPE] was up 5.13% over the past week, although it has struggled to push itself convincingly beyond the $0.0000050-$0.0000052 supply zone.
Relative PEPE strength is a positive sign
In the past 24 hours, PEPE saw a 212% increase in daily trading volume and has bounced by 5.45%. The popular memecoin has been unable to climb above the $0.0000052 resistance.
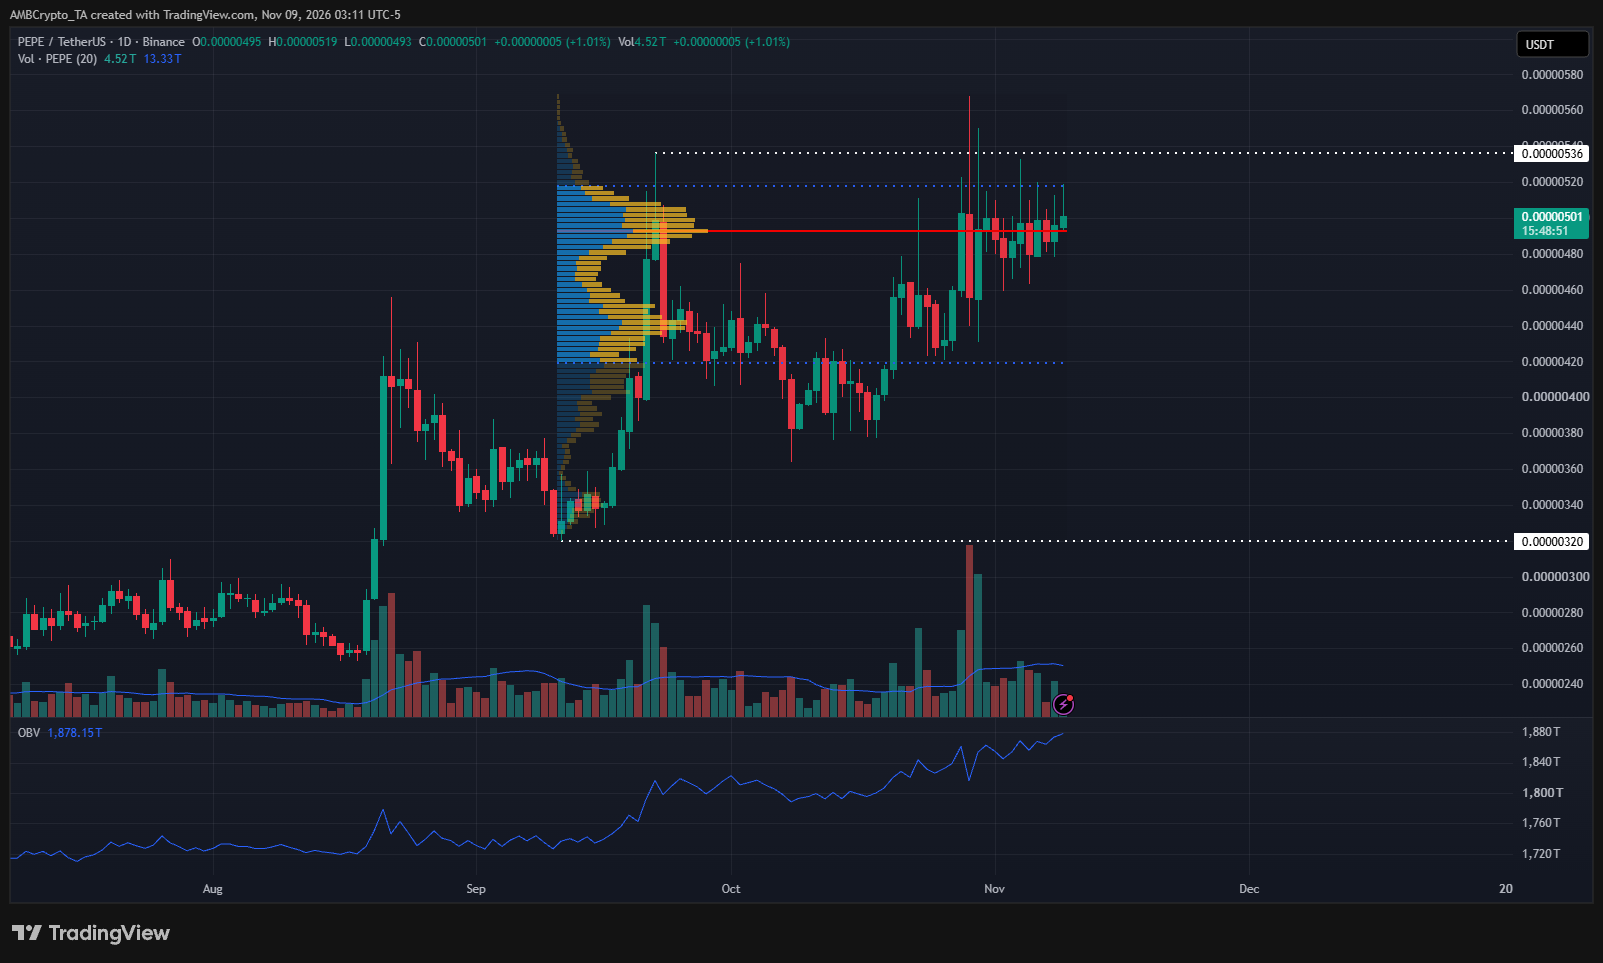
In an earlier report, AMBCrypto pointed out that the Value Area High was an important resistance level. It has moved higher from $0.00000491 to $0.00000518 due to the price action and volume trends of the past ten days.
The memecoin was yet to break out past this supply zone and beyond the $0.00000536 swing high from September.
The OBV maintained its upward trajectory, showing steady buying pressure on PEPE.
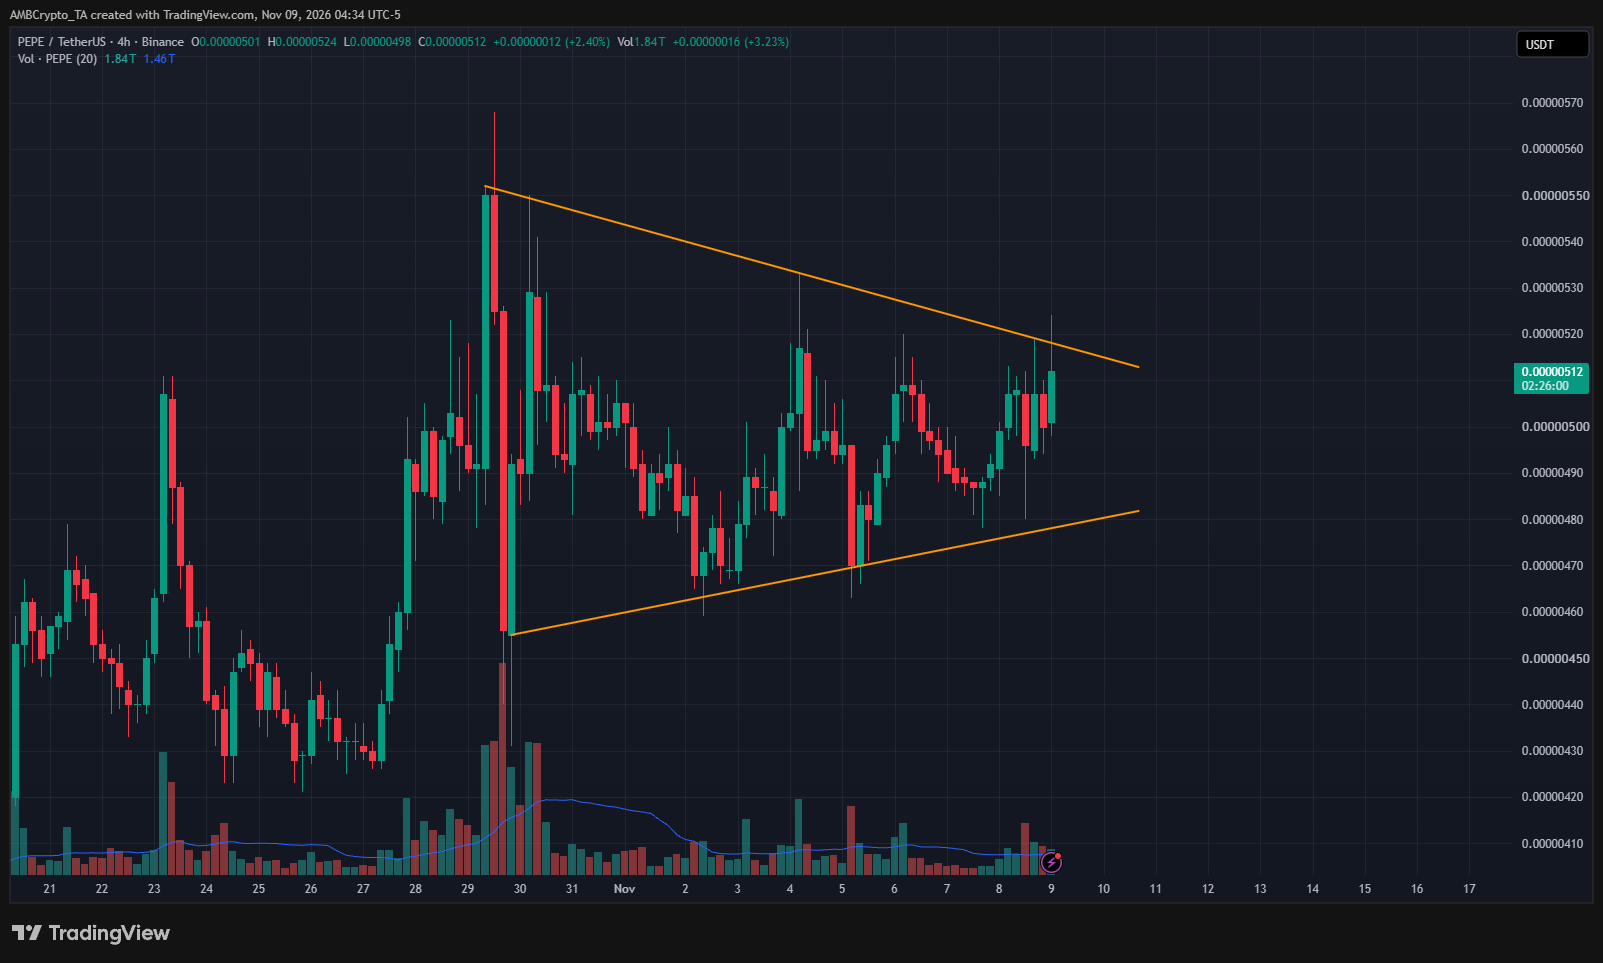
The 4-hour chart showed a price compression in progress, while the wider price structure on this timeframe retained a bullish bias. In light of this compression, swing traders can expect a breakout to the upside in the coming days.
Final Summary
- Pepe showed relative strength against popular crypto assets such as BTC, ETH, and DOGE.
- The price compression on the 4-hour chart, alongside repeated tests of the nearby supply zone and steady buying, indicated a bullish breakout could be brewing.