
- BNB’s falling wedge pattern and MACD crossover signalled a potential 40% price breakout
- On-chain activity, including active addresses and transactions, supported this hypothesis
Binance Coin [BNB] surged by 6.58% in the last 24 hours, hitting $544.48 on the charts, at the time of writing. As expected, this has sparked speculation about a potential breakout.
In fact, a post on X (formerly Twitter) by The Moon Carl suggested that BNB could see a price pump of at least 40%. This, if it breaks out of a 6-month-long falling wedge pattern. Hence, the question – Is this a buying opportunity?
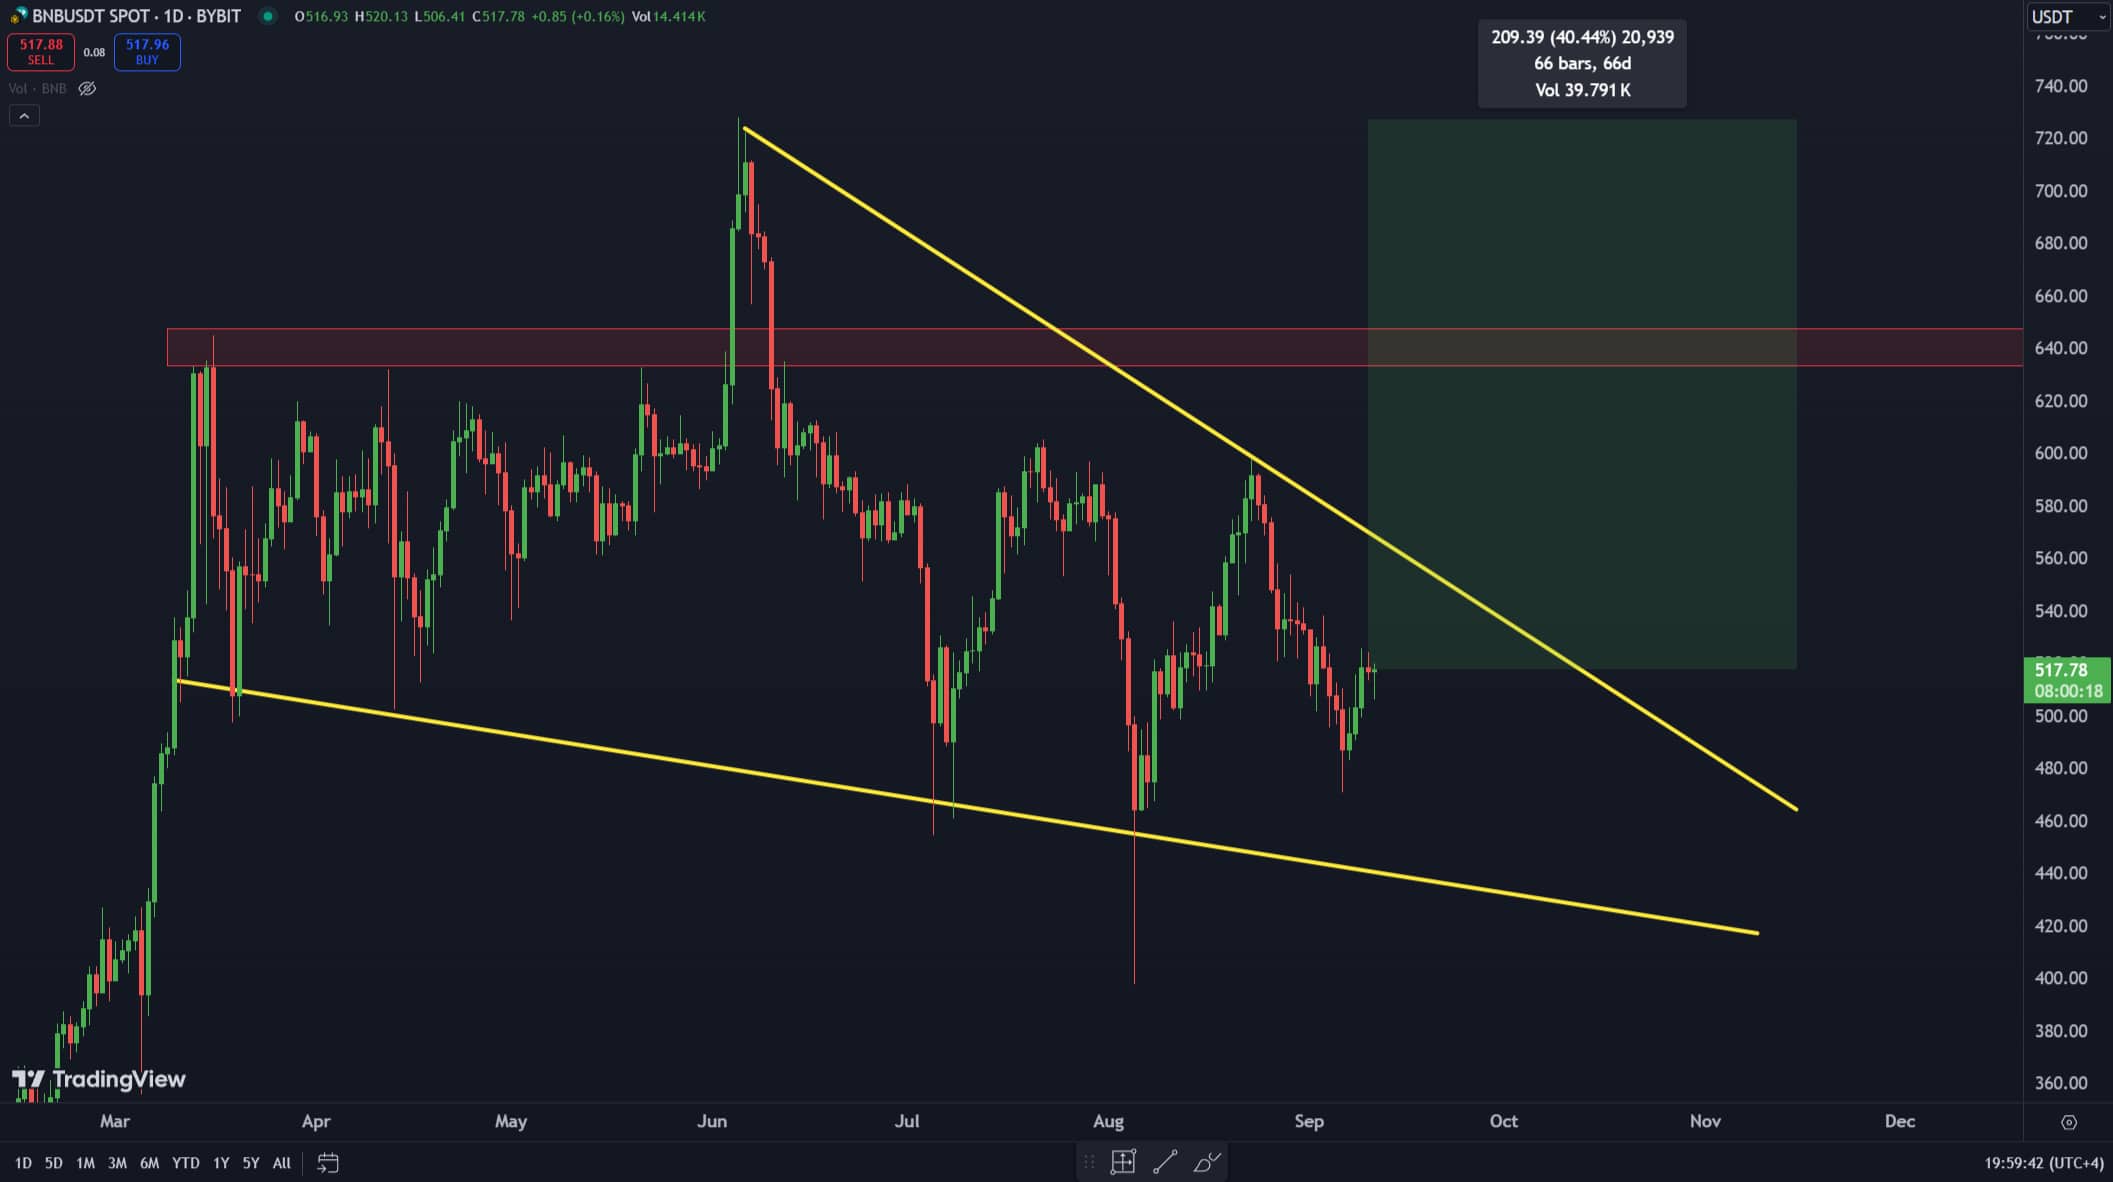
BNB’s chart highlighted a falling wedge pattern, a classic bullish indicator. This is what has led analysts to predict a potential 40% upside.
Source: X
On the chart, the Moving Average Convergence Divergence (MACD) flashed a bullish crossover. The MACD line at 6.4 crossed above the signal line at 6.3 – A sign of upward momentum.
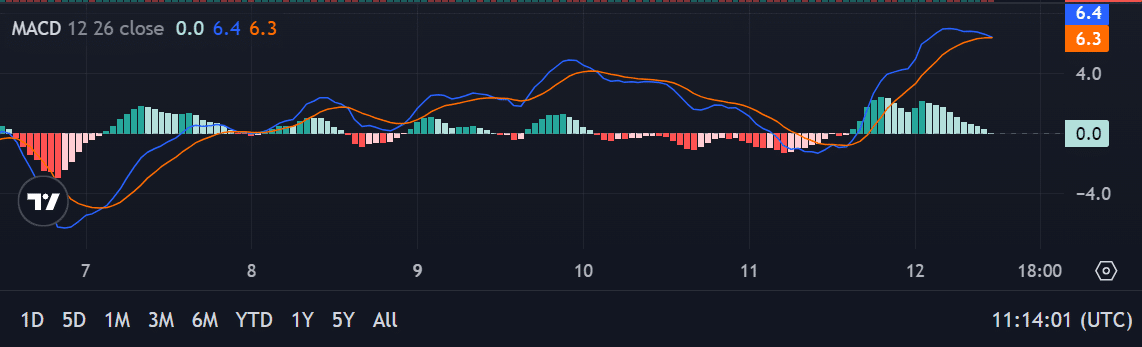
Source: TradingView
Additionally, BNB’s trading volume surged by 25.29%, hitting $1.8 billion in the past 24 hours. This is further confirmation of growing market interest. Hence, traders may be keeping an eye on the resistance near $580 as the critical point for a breakout.
What do on-chain metrics suggest?
On-chain data offered additional insights into BNB’s strength. The number of active addresses rose by 4.03%, reaching 925.07K. Also, transactions spiked by 15.8%, totaling 4.20 million within just 24 hours.
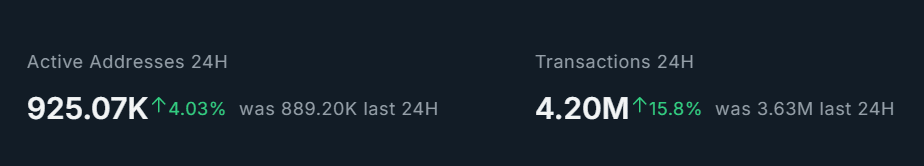
Source: Nansen
These figures highlight growing user activity and interest in Binance Smart Chain. Whale accumulation may also be a factor in the current rally, with large holders potentially positioning ahead of a major price move.
Could BNB face a pullback?
Despite these positive signals, however, traders should remain cautious. The Relative Strength Index (RSI) seemed to be nearing overbought territory, sitting at 69.01 – A sign that BNB could face resistance soon.
Failure to break above $580 could lead to a pullback, with support levels around $500 and $460 acting as potential downside targets.
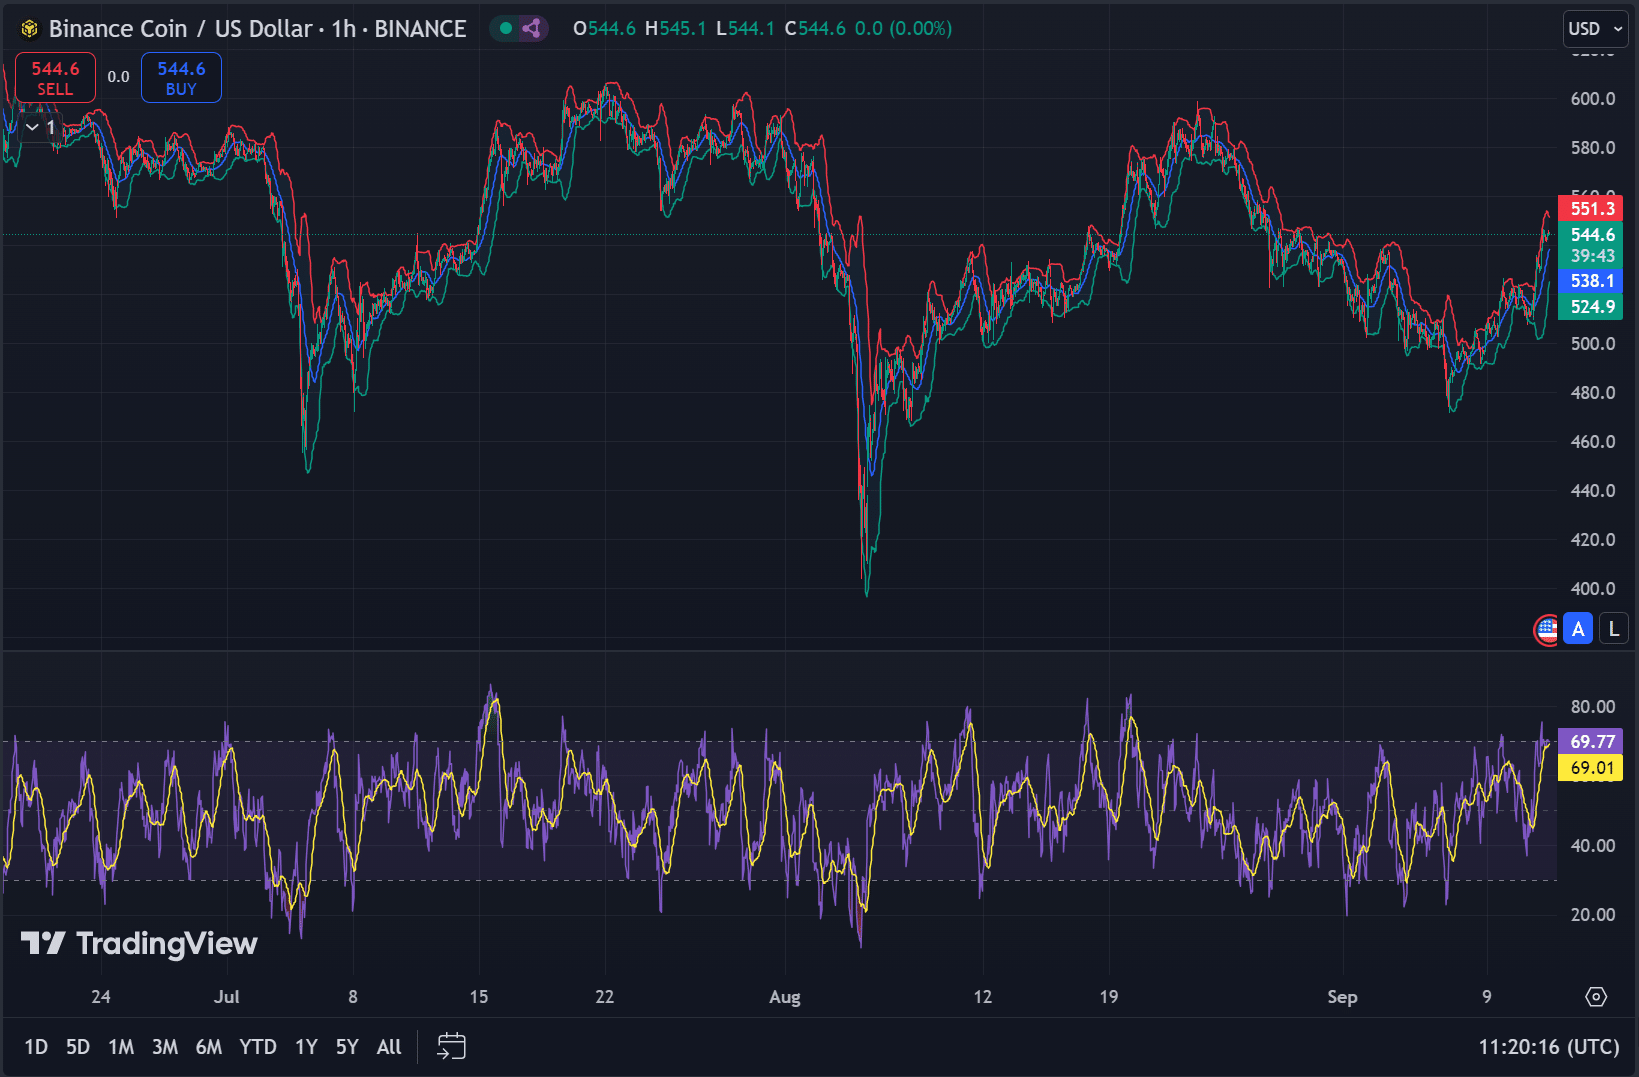
Source: TradingView
Additionally, a drop in active addresses or transaction volumes could signal declining interest. This would undermine the bullish outlook.
Should traders buy BNB now?
While the technical patterns and on-chain metrics indicated that BNB may be poised for a significant move, caution is still warranted. Overbought conditions and the potential resistance at $580 mean that the market could see volatility in the short term.
However, BNB remains at a critical juncture. This makes it a key token to monitor in the coming days.