A bull run is round the corner for MATIC, thanks to these developments

Ever since the wider market sell-off on 7 September, MATIC has been trying to rediscover the momentum that it achieved during its previous bull run. Lower highs did outline its bullish progress, however, buyers were unable to sustain prices beyond certain levels.
Its current run up from $1.20 can have positive implications, if another higher high is formed. Conversely, bulls would lose their advantage in case of a close below the 23.6% Fibonacci level. At the time of writing, MATIC traded at $1.38, down by 6.8% over the last 24 hours.
MATIC 4-hour Chart
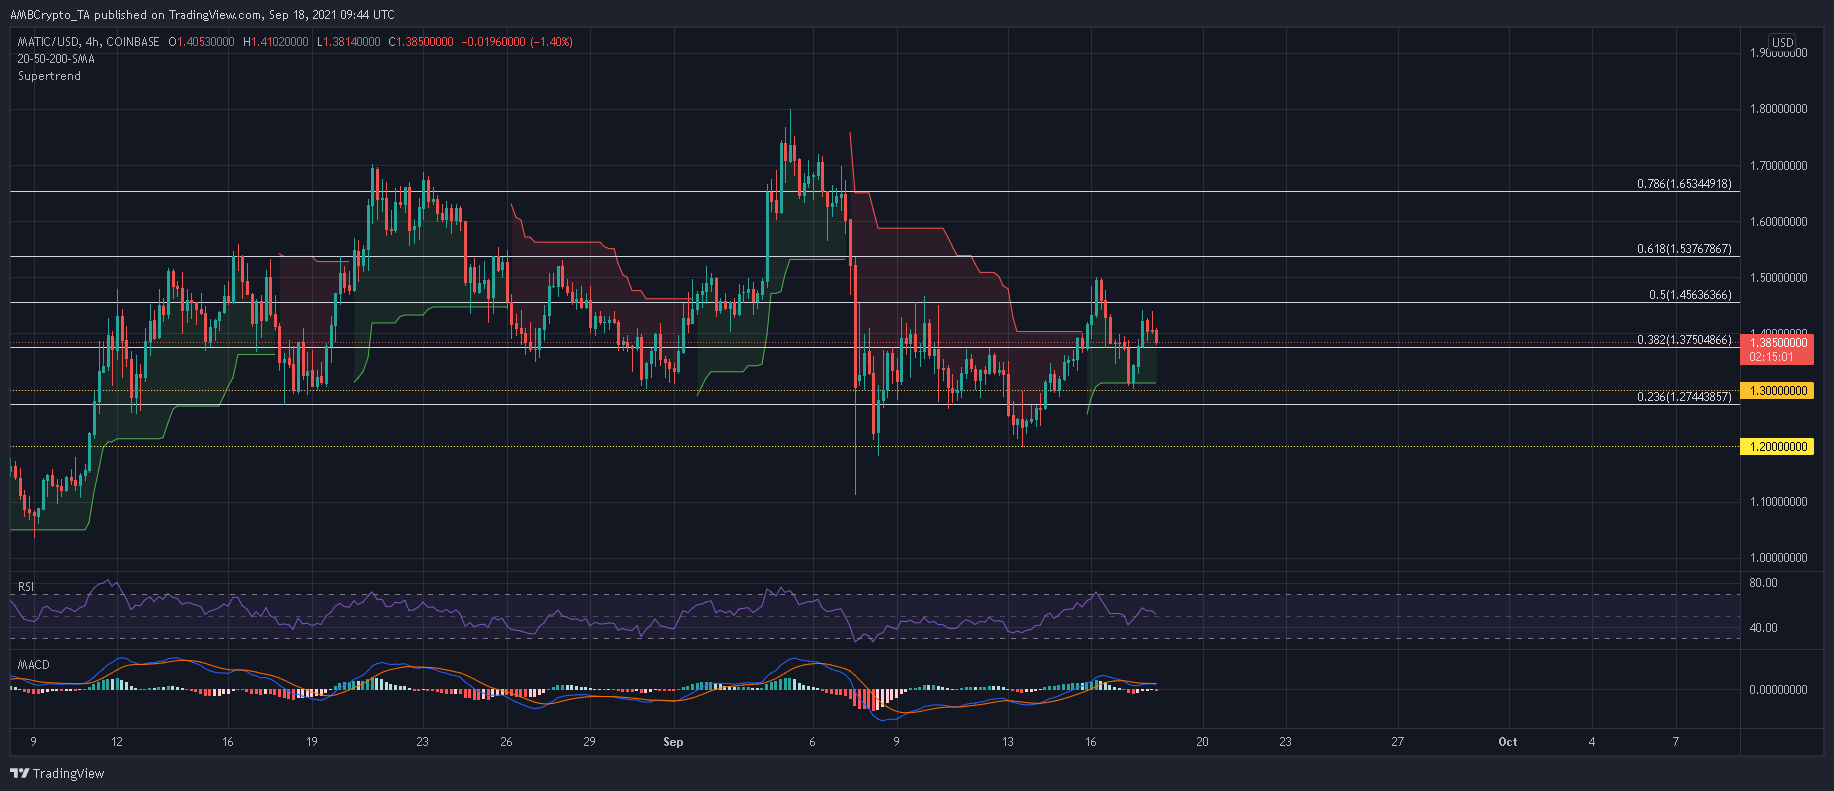
A double bottom formed around $1.20 allowed MATIC to climb back up on the charts and break through its 50% Fibonacci level. From there, an impulsive wave was felt immediately, as MATIC retraced to a defensive line of $1.30 and bounced back once again.
Ideally, MATIC needed to close above its previous peak of $1.50, to solidify an uptrend but that was not the case just yet. A couple of red candlesticks lined up on the charts which signified an abrupt halt to MATIC’s next upcycle.
However, a favorable outcome would still be possible if MATIC is able to reverse trajectory from the 38.2% Fibonacci level, and register a close above $1.50. Piercing above the 61.8% Fibonacci level would be the best-case outcome. Conversely, a drawdown back to $1.20 would negate this outlook and heighten the chances of another low.
Reasoning
While MATIC’s trajectory may be somewhat puzzling, the indicators have made decent progress. For instance, the RSI managed to climb above the half-line on 15 September and even touched the overbought zone at one point, signaling a bullish resurgence. With the RSI now finding support around the mid-line, bulls did maintain an upper hand over proceedings.
Same was the case with the MACD, which flattened above the half-line after a steady recovery over the past week. Moreover, the Supertrend Indicator flashed a buy signal and placed a stop-loss at $1.31, below which short-sellers would be interested.
Conclusion
MATIC was attempting to establish an uptrend after a double top pattern, however, it was yet to fully convince market observers. Either way, bulls still had an edge and a favorable outcome cannot be discounted just yet. If MATIC bounces back from 38.2% Fibonacci level and manages to form a higher peak above $1.50, a bullish trend can be expected.