
- Bitcoin’s Funding Rates on DyDx and Deribit have turned positive.
- The coin’s “flat” Open Interest signals that market participants are unsure of its short-term price direction.
Bitcoin’s [BTC] brief rally above $63,000 has led to a spike in its Funding Rates on derivatives exchanges like DyDx and Deribit, Santiment noted in a post on X (formerly Twitter).
? #Bitcoin's funding rate is rising on exchanges like #DyDx and #Deribit. To avoid history repeating itself after last week's top, those #bullish on #crypto want to see $BTC #FOMO staying low, with #shorts opening at the same (or higher) rate than longs. https://t.co/xlipAPHZPL pic.twitter.com/oD2qglaWvb
— Santiment (@santimentfeed) May 13, 2024
According to the on-chain data provider, as of the 13th of May, BTC’s Funding Rates on DyDx and Deribit were 0.0012% and 0.037%, respectively.
These have continued to rise despite the coin’s slight price retracement from the $63,000 level in the past few days. At press time, BTC exchanged hands at $61,928, per CoinMarketCap’s data.
Funding Rates are used in perpetual futures contracts to ensure that the contract price stays close to the spot price.
When an asset’s Futures Funding Rate witnesses a positive surge, it suggests a strong demand for long positions. It is considered a bullish signal and a precursor to an asset’s continued price growth.
Conversely, negative Funding Rates suggest a high demand for short positions. This is a bearish signal that shows market participants are betting against an asset’s price.
Not all BTC traders are convinced
While its Funding Rates have risen, BTC’s Futures Open Interest has oscillated between $29 billion and $30 billion since the beginning of May, according to Coinglass’ data.
An asset’s Futures Open Interest measures the total value of its futures contracts that have not been settled yet.
When it oscillates in a narrow range like this, traders are not aggressively adding or exiting their positions. This often happens during periods of low market volatility.
An assessment of BTC’s volatility markers on a daily chart confirmed this.
For example, the coin’s Average True Range (ATR)—which measures market volatility by calculating the average range between high and low prices over a specified number of periods—has been in a downtrend since the 19 of April.
When an asset’s ATR declines this way, it suggests that the likelihood of price swings is lessening. As of this writing, BTC’s ATR was 2618.68.
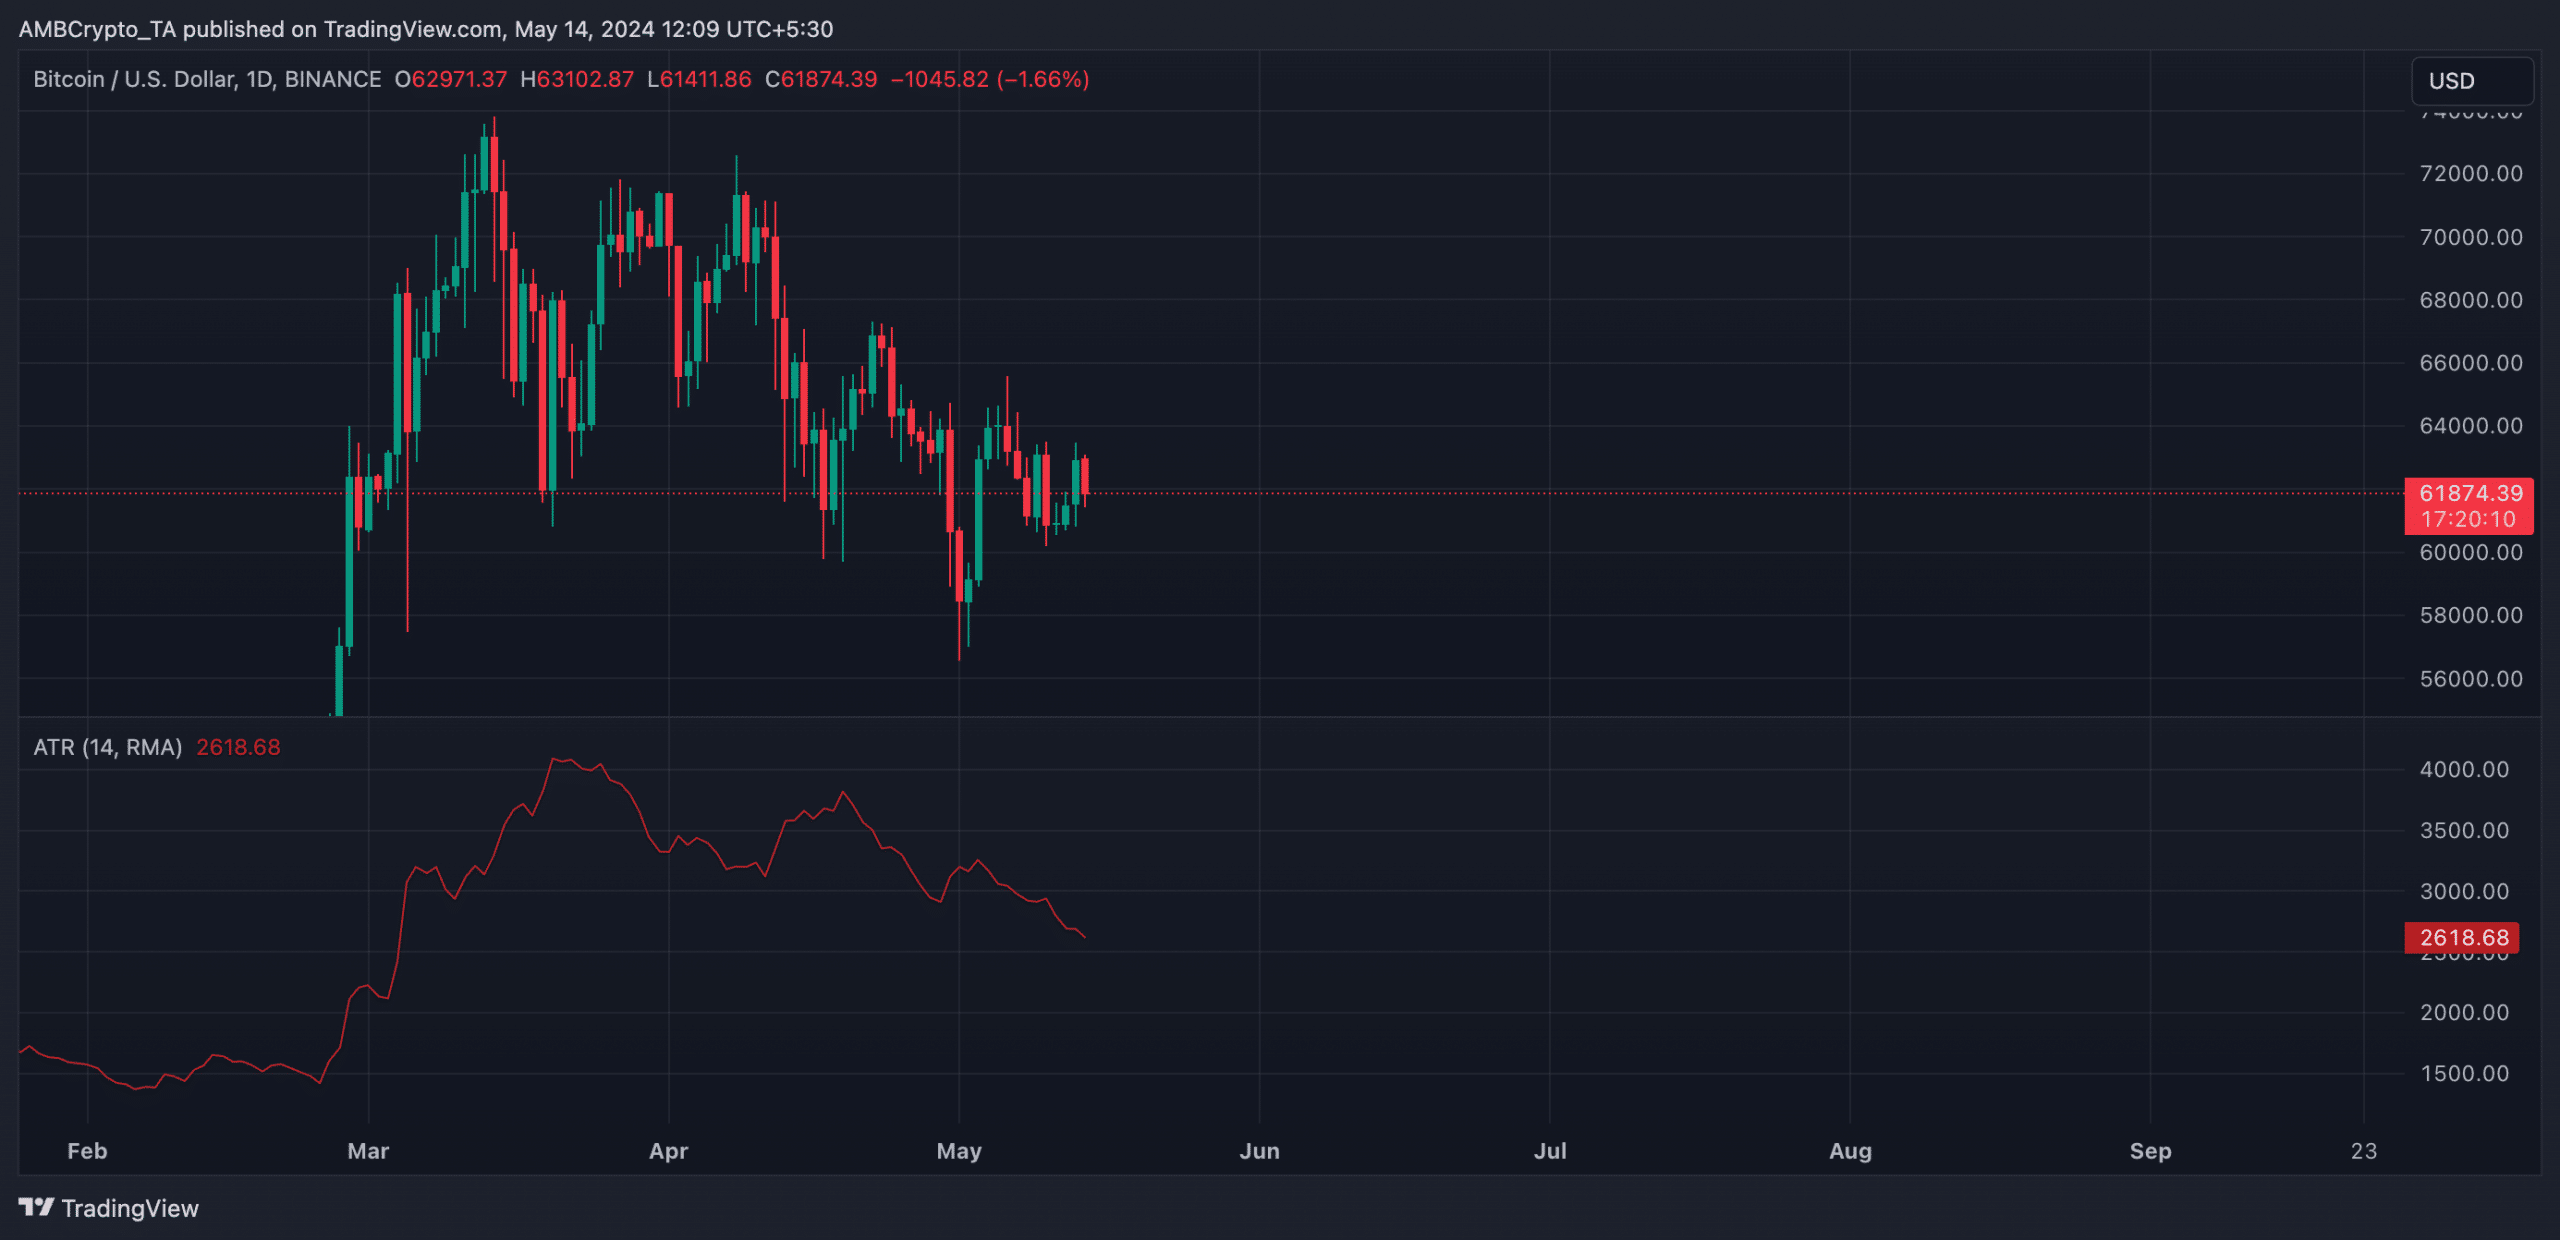
Source: BTC/USDT on TradingView
BTC’s “flat” Open Interest might have been due to traders’ lack of strong conviction regarding its short-term direction.
Read Bitcoin’s [BTC] Price Prediction 2024-25
However, with its temporary rally above $63,000 a few days ago and the ensuing surge in Funding Rates, the market is regaining its confidence.
As more traders take long positions, the coin’s Futures Open Interest is expected to spike.
![Bittensor [TAO] tops the AI charts once again, but 3 hurdles loom](https://ambcrypto.com/wp-content/uploads/2025/04/420567A0-9D98-4B5B-9FFF-2B4D7BD2D98D-400x240.webp)


