Analysis
A new break for Tron on the charts will take it…
The Open Interest declined along with the price, with the same hinting at discouraged Tron buyers in the market.
Disclaimer: The information presented does not constitute financial, investment, trading, or other types of advice and is solely the writer’s opinion.
- Intense selling pressure saw bulls lose key support levels
- Declining OI and Spot CVD hinted at more shorting opportunities
The break of the trendline and support confluence by Tron’s [TRX] bears could signal a shift in momentum for TRX. The altcoin dropped by 12% over the past 24 hours, as intense selling pressure saw the price break through the $0.0711-price zone.
Read TRON’s [TRX] Price Prediction
2023-24Tron’s price movement was in sharp contrast to Bitcoin [BTC] which posted 1% gains over the same period. Especially as the king coin looked to reclaim $26k.
Bullish momentum curtailed at $0.0857-resistance
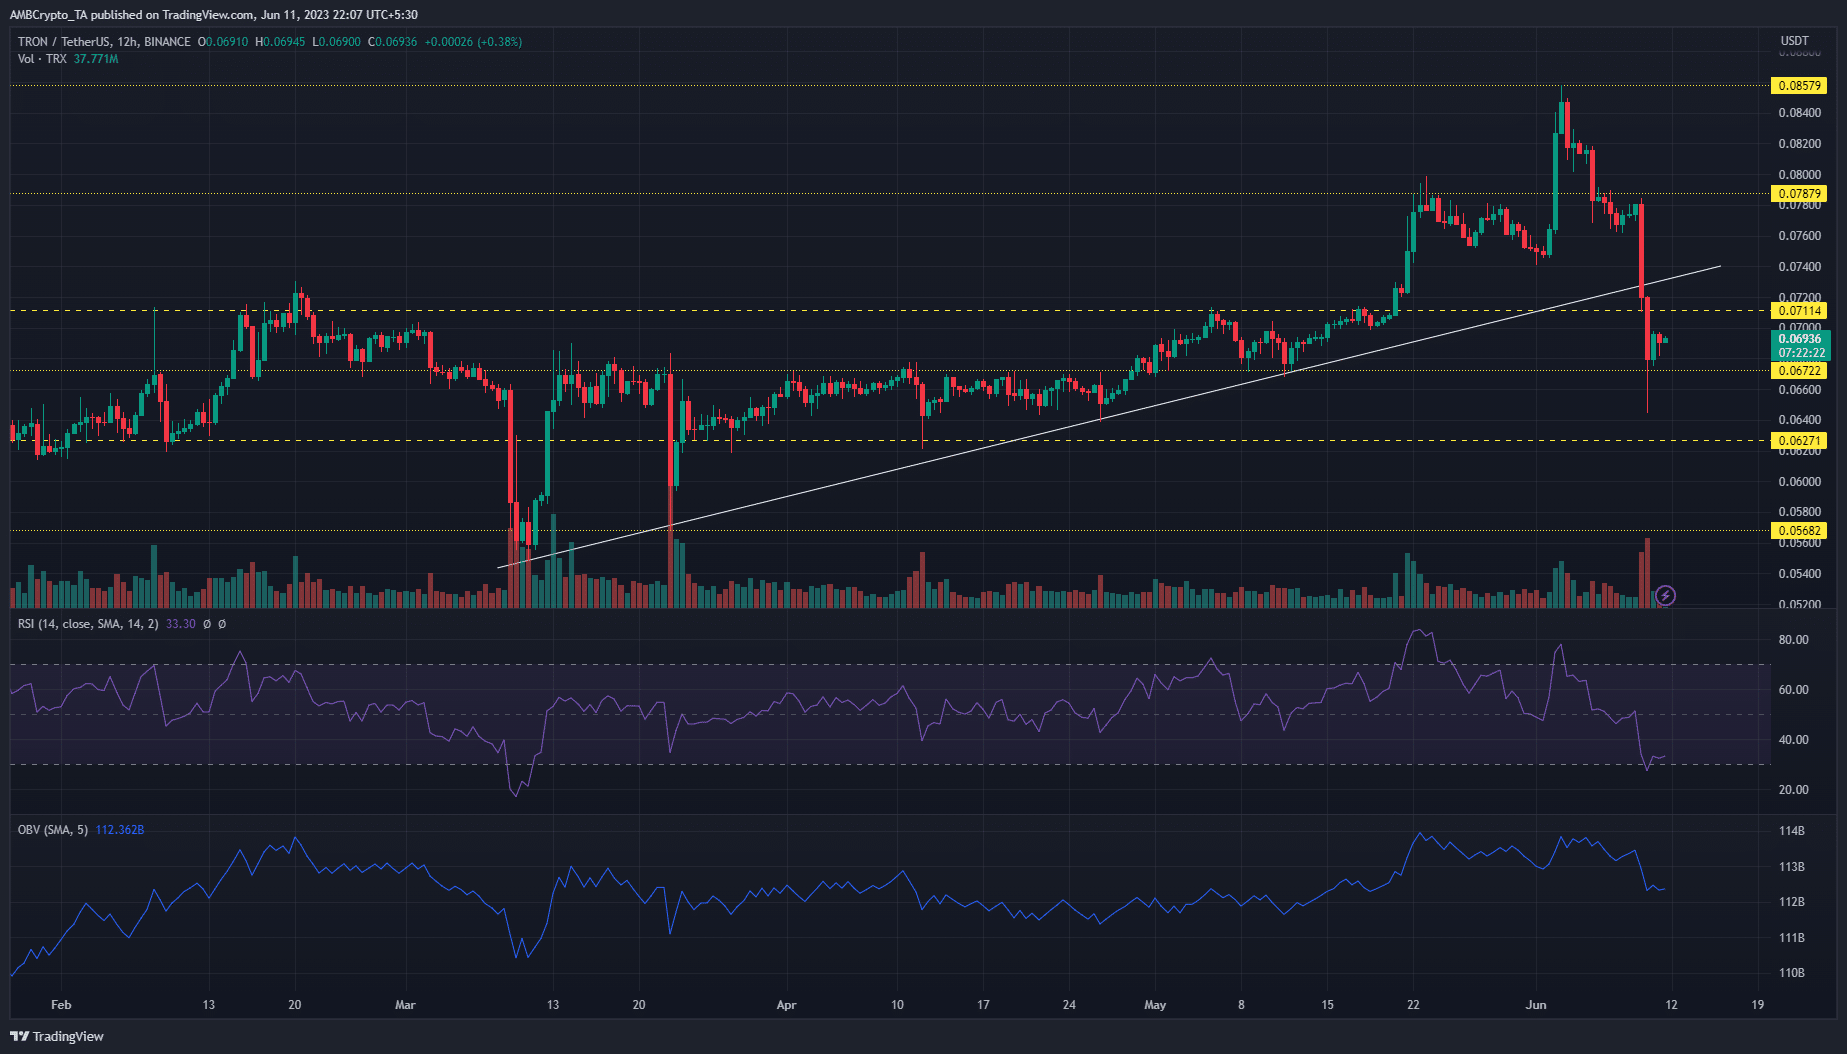
Source: TRX/USDT on Trading View
Tron’s strong bullish momentum since 26 April saw it smash year-long resistance levels at $0.0711 and $0.0787. However, the $0.0857-resistance level proved one step too high for bulls. The price rejection at the resistance level ushered in a wave of selling pressure.
Bears immediately reclaimed the $0.0787-resistance level on 5 June. A retest of the reclaimed resistance level produced more downside for Tron with two large bearish candles on the 12-hour timeframe breaking the bullish support confluence at the $0.0711-price zone. However, bulls were able to find support at the $0.0672-support level with the price at $0.0697, as of press time.
Based on Tron’s recent price action, sellers could look to extend their gains with a retest of the $0.0711-level. More dips for TRX will flip its market structure bearish in the long term with bears targeting $0.0672 and $0.0627 as support levels.
On the flip side, bulls could rebound from the support level and push to quickly reclaim the $0.0711 and $0.0787-levels. This could see the price consolidate in a range before another significant price movement.
Declining Open Interest showed discouraged bulls
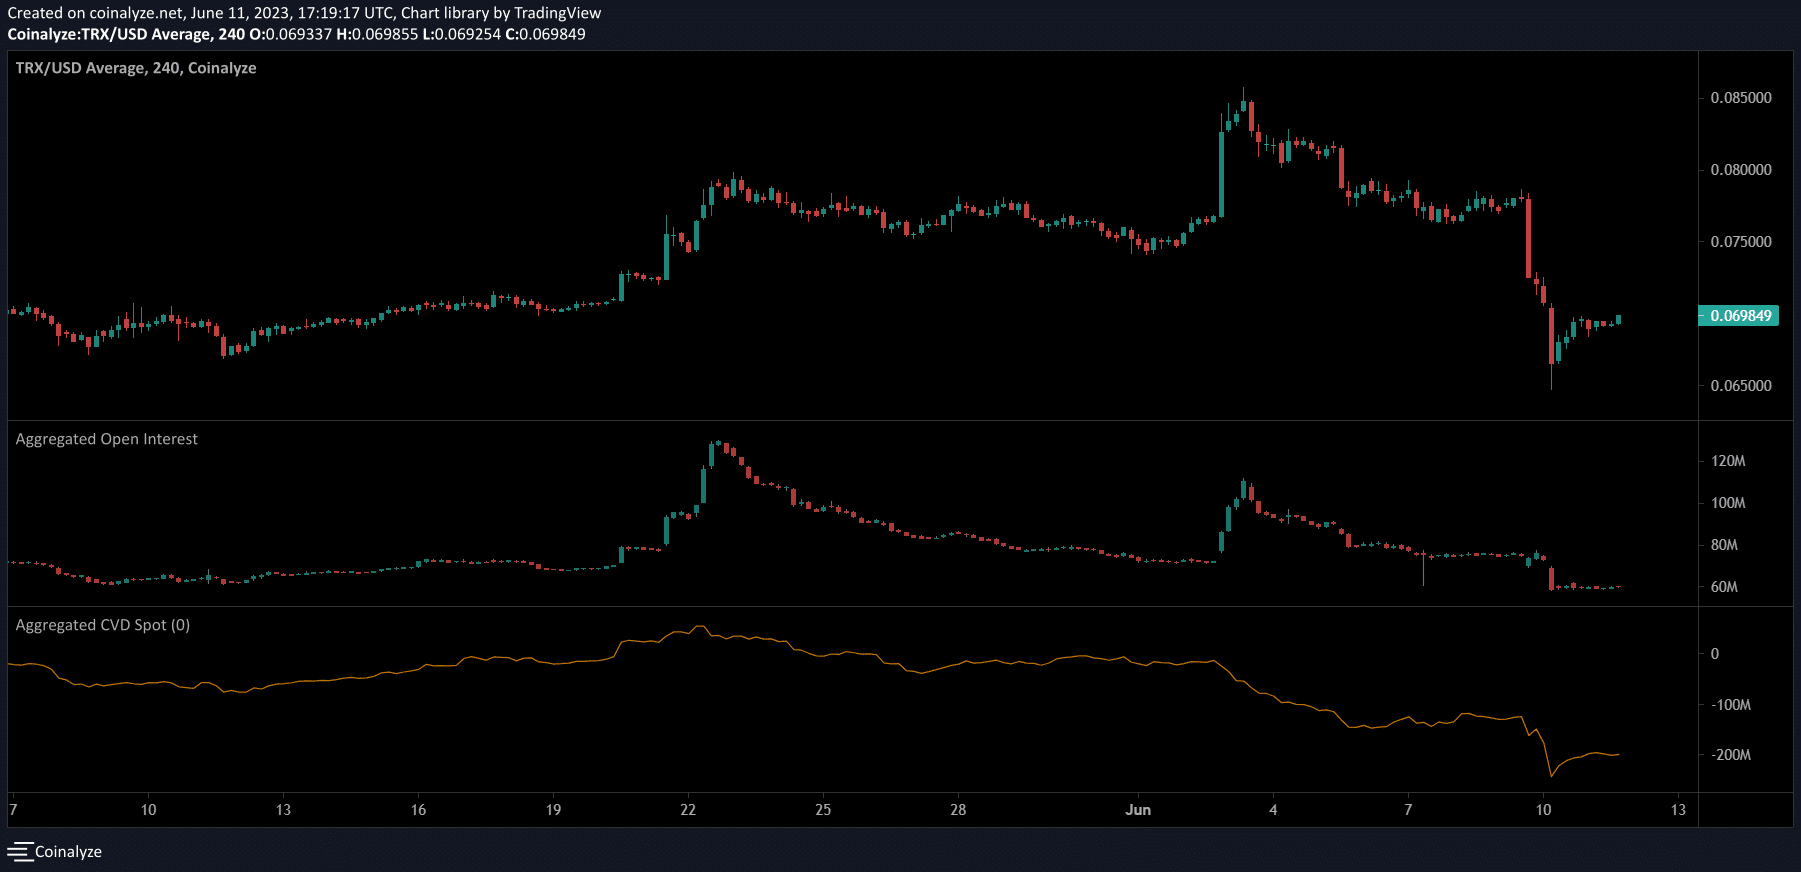
Source: Coinalyze
A look at the Open Interest (OI) data from Coinalyze revealed that buyers could be exhausted. The OI maintained a steady decline from 3 June as the price dipped aggressively.
How much are 1, 10, or 100 TRX worth today?
A decline in price and open interest hinted at discouraged traders with long positions. This is a sign that a continuation of the bearish trend could be imminent. The Spot CVD also echoed the market sentiment with a significant decline over the same period. This highlighted waning demand behind TRX.