A potential entry trigger for XRP investors, traders may be found here

Disclaimer: The findings of the following analysis are the sole opinions of the writer and should not be considered investment advice
XRP steeply reversed into its long-term oscillation range after breaching its nine-month resistance at the $1.3-mark. With this fall, the alt fell below the vital $1-mark and flipped the 200 SMA (yellow) from support to resistance.
A compelling close above the $0.77-$0.82 range would set XRP up for a re-test of its 200 EMA, before flipping its Point of Control (POC, red) to immediate support. However, this range represented a confluence of multiple hurdles, including the 50 EMA and its immediate supply zone.
At press time, XRP was trading at $0.7585, down by 2.92% in the last 24 hours.
XRP Daily Chart
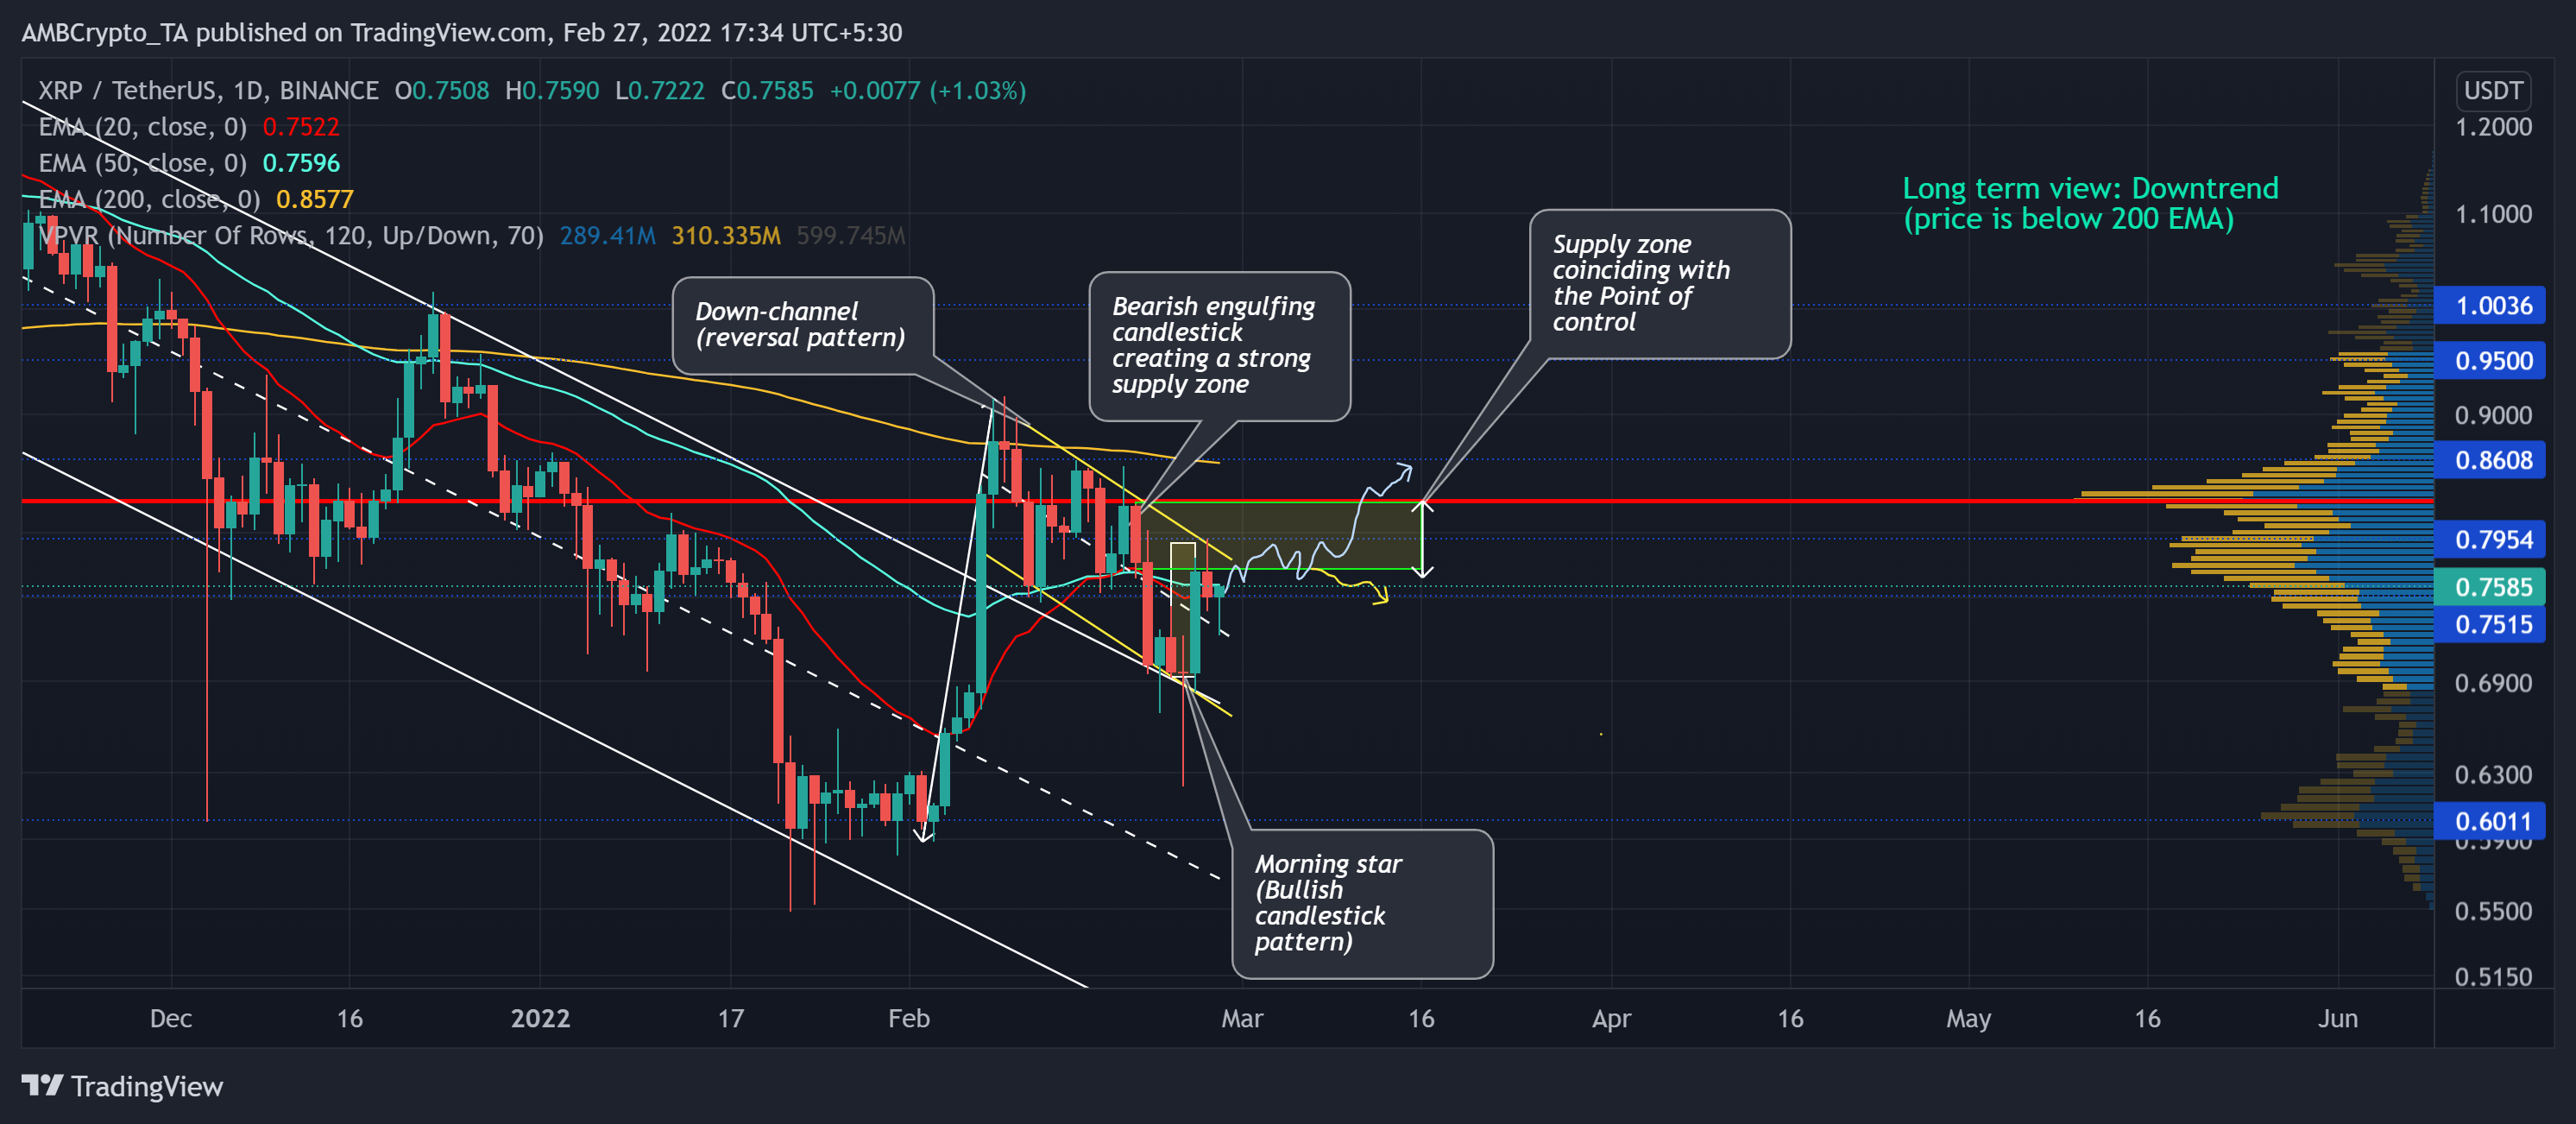
During the latest bearish phase, XRP fell below the 20-50-200 EMA and pierced through some crucial levels. But the $0.6-support stood sturdy for the past 11 months. Thus, it saw a 53.5% ROI from 3 to 8 February as it broke out of the channel.
Since then, the altcoin has noted a steep pullback, one that led to the first retest of the upper trendline channel (white). Over the past few days, the bearish engulfing candlestick has created a strong supply zone in the $0.77-$0.82 range. Also, this level coincided with the POC.
Keeping in mind the morning star candlestick pattern since 24 February, XRP hinted at a strong rejection of lower prices. Accordingly, the chances of testing the $0.79-mark resistance have heightened. A close above this level would open up gates to a test of the $0.86-mark. This trajectory would be possible only if the bulls sustain the clash with the bears in the supply zone.
Rationale
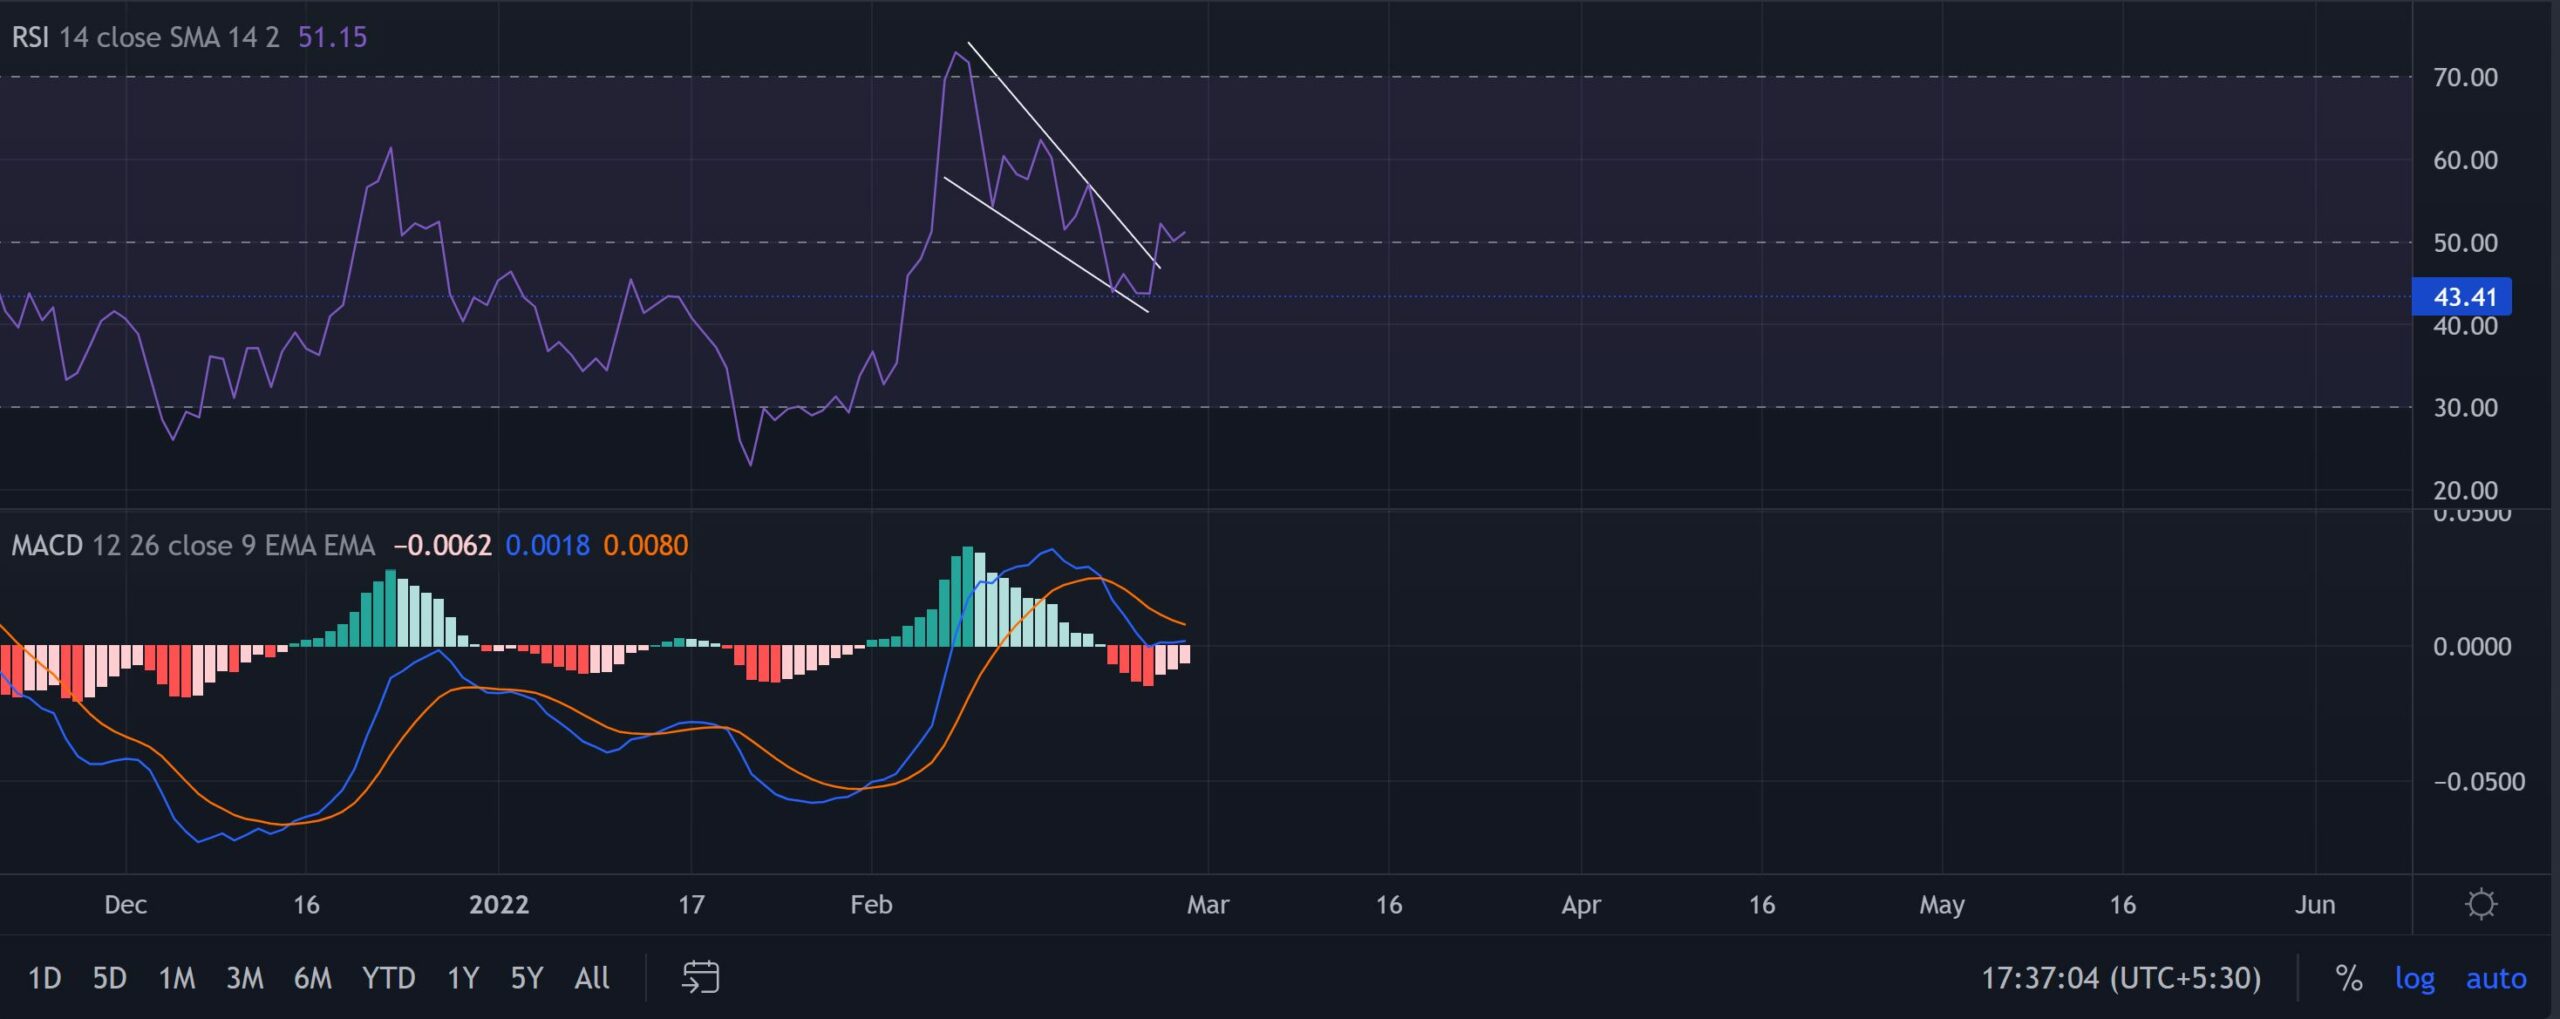
After reaffirming the 43-support, the RSI saw a falling wedge breakout, one that propelled it to cross the equilibrium. A sustained close above this level is needed to confirm the resurgence of bulls.
Also, the MACD lines seemed to be on the verge of a bullish crossover. The investors/traders must watch out for the first green signal on the histogram for a potential entry trigger.
Conclusion
Considering XRP’s proximity to its near-term EMAs, the chance of a volatile move in the days to come is high. Any close above the current down-channel (yellow) could lead to a POC retest followed by the 200 EMA in the long term. Should the bulls dwindle, XRP could enter into a tight phase near its supply zone.
Moreover, keeping an eye on Bitcoin’s movement and the broader sentiment would be important to complement the aforementioned analysis.


