Aave, Chainlink, Litecoin Price Analysis: 07 May

Aave needed to defend $430-support from an extended sell-off. Chainlink traded within a down channel and a bounce back from $45.6-44.2 could lead to a northbound breakout. Finally, Litecoin’s uptrend needed some stabilization to continue its trajectory.
Aave [AAVE]
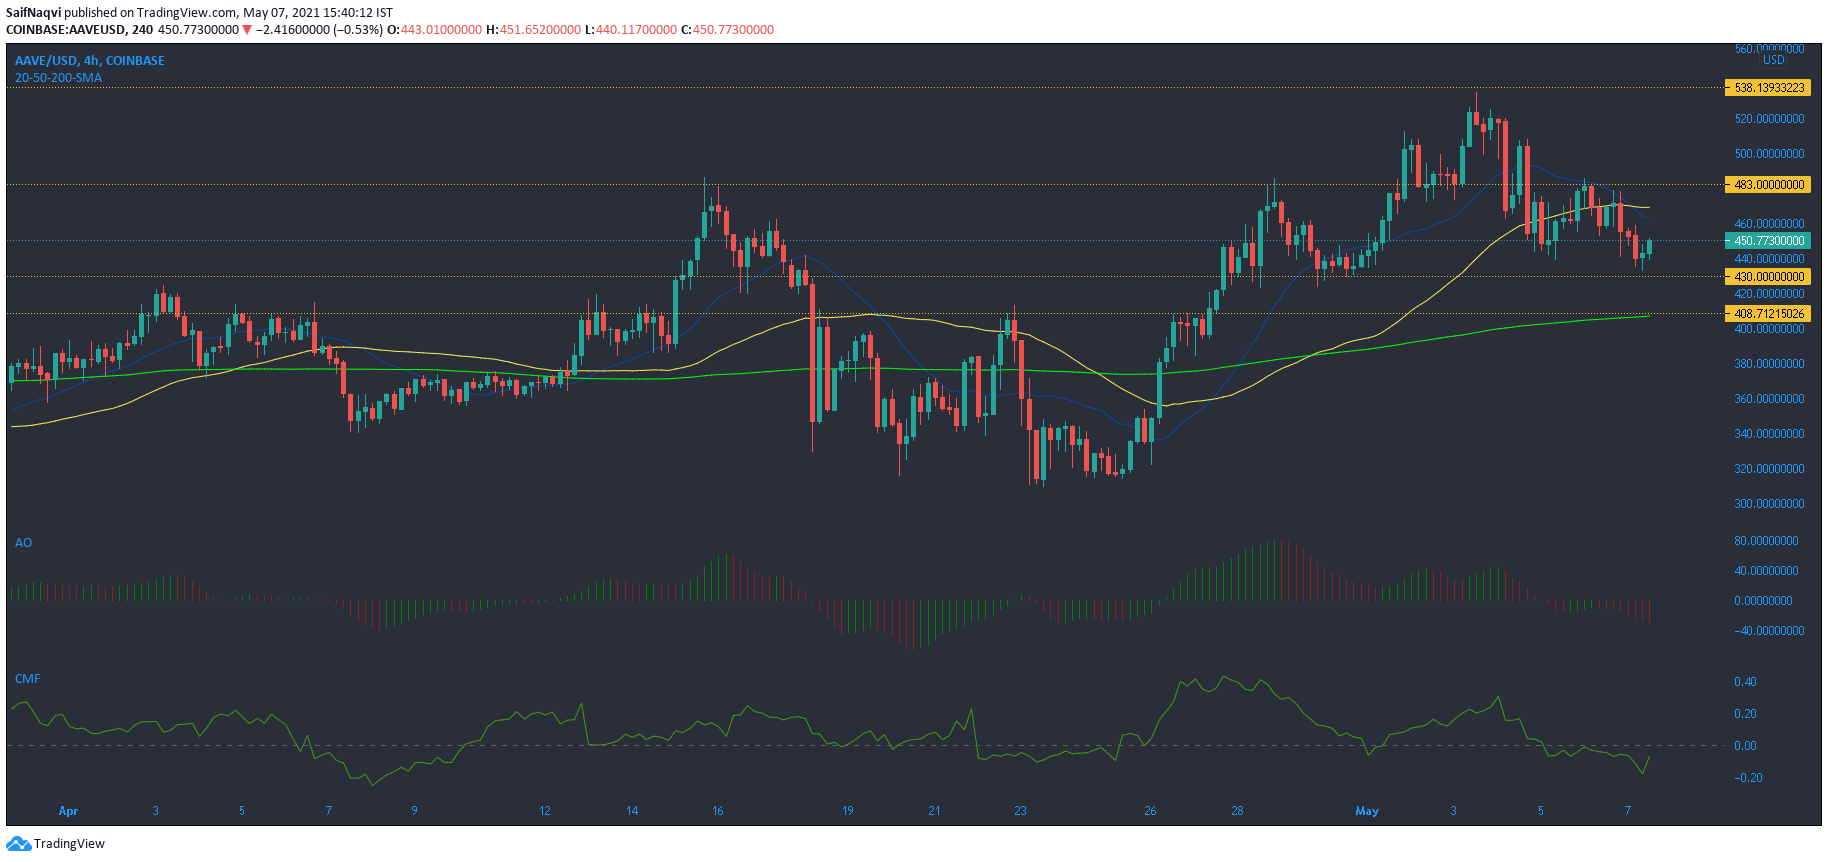
Buyers stepped in around $310-315 and drove Aave’s value by over 60% between April 25 and May 3. However, the price was unable to break above $537-resistance and that’s when the sellers took control. The selling pressure dropped AAVE below $483-support and cryptocurrency was below its 20-SMA and 50-SMA at the time of writing. Awesome Oscillator highlighted selling pressure as it continued its descent below the half-line.
While the price could bounce back from $430-support, the $538-upper ceiling was unlikely to be toppled over the coming sessions. In fact, a break below $430 could even lead to an extended sell-off towards $408. Meanwhile, capital inflows were on the weaker side according to Chaikin Money Flow, but the index did attempt a comeback above equilibrium at press time.
Chainlink [LINK]
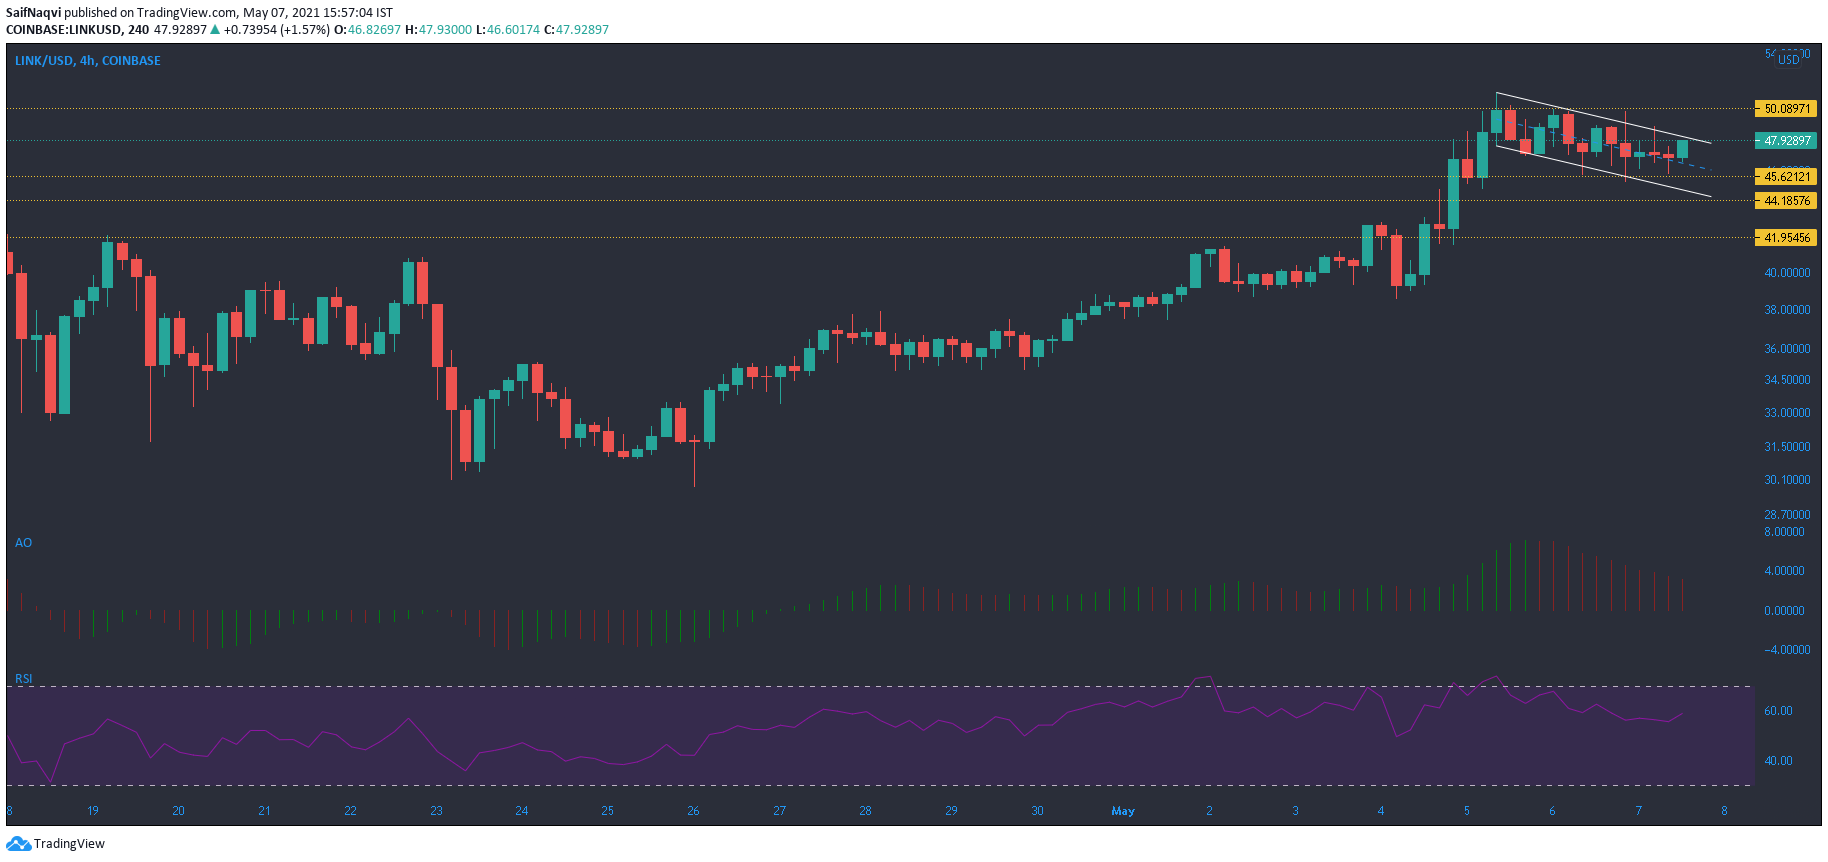
An ascending triangle breakout helped Chainlink achieve its target above $50 as the price registered a new ATH. Since snapping this level, LINK noted some downward movement within a descending channel on the 4-hour timeframe. A series of red bars on Awesome Oscillator highlighted selling pressure in the market. However, the current pattern usually indicates a breakout to the upside and the same can be expected moving forward.
A bounce back from between $45.6-44.2 could allow LINK to break north from its upper sloping trendline. A move above $50 could even see the price head above the $53-mark. Despite bearish conditions in the market, RSI maintained a bullish territory above 55. A recent analysis mentioned that LINK’s network activity and price action make it one of the hottest altcoins in the top 25.
Litecoin [LTC]
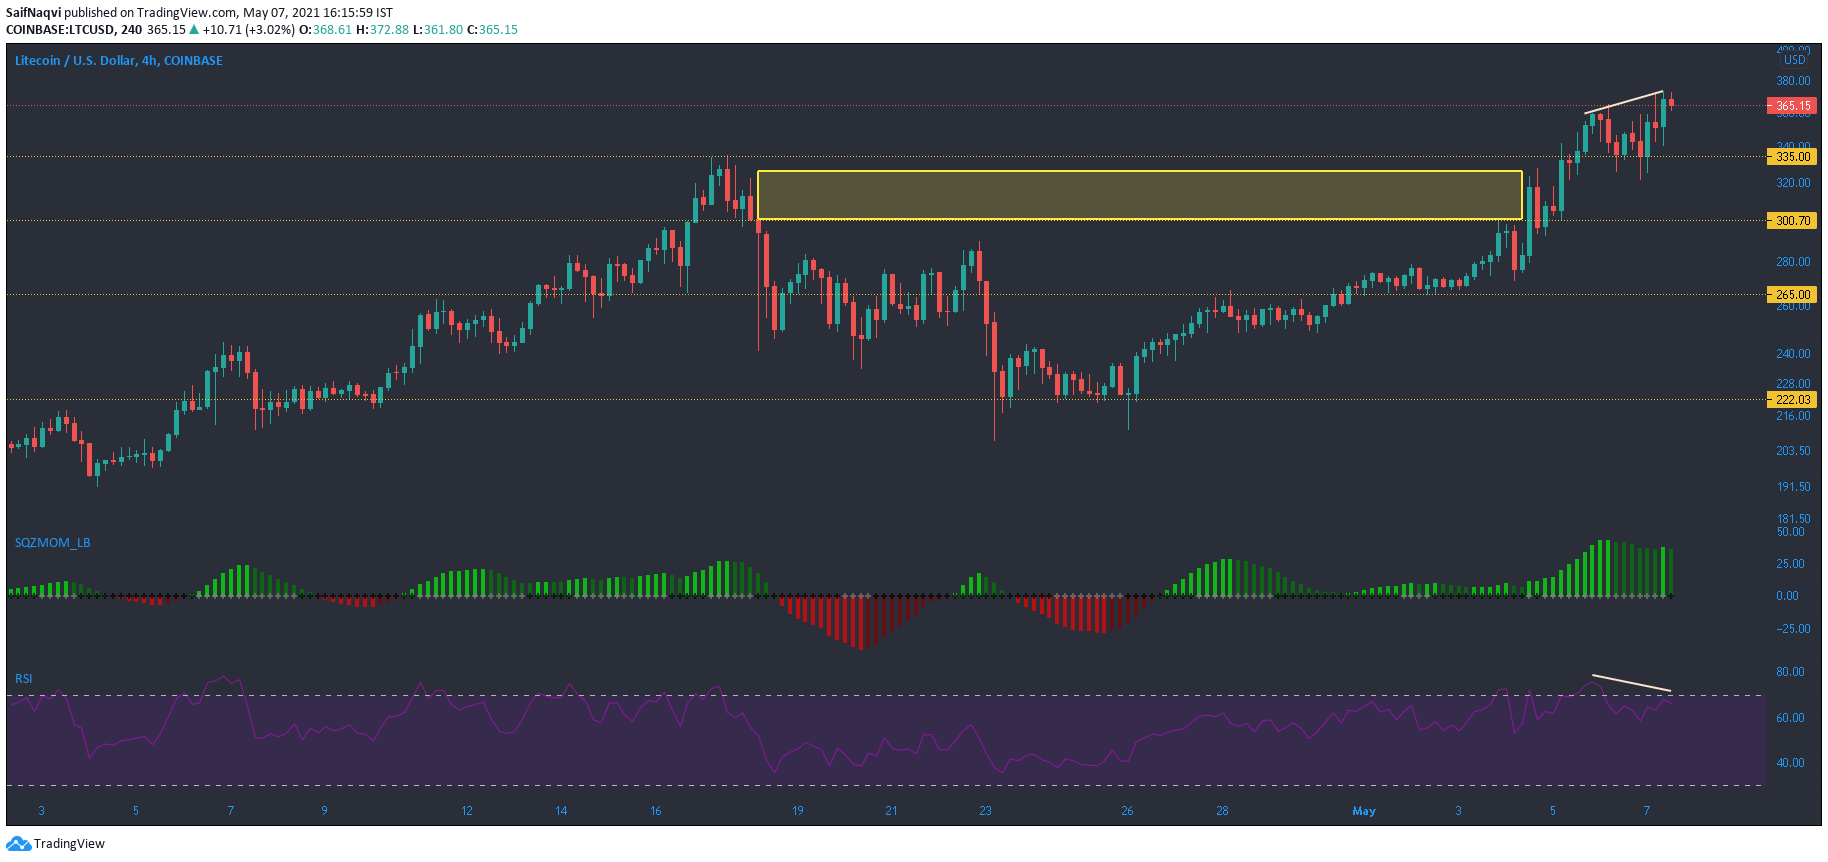
A rise above $300 allowed Litecoin to shoot north on the charts and form a new record level at $365. While the last few days have been quite bullish for the world’s tenth-largest cryptocurrency, a few of its technicals hinted at a pullback over the coming sessions. RSI formed several peaks in the overbought zone and suggested stabilization before the next upswing. A bit of bearish divergence was also spotted on the index.
Squeeze Momentum Indicator showed a dip in bullish momentum. If the index notes a series of black dots, lower volatility would likely indicate some sideways movement for LTC. In case of a minor pullback, the first support lay around $330-335.