
Disclaimer: The information presented does not constitute financial, investment, trading, or other types of advice and is solely the writer’s opinion.
- The drop below short-term range lows reinforced the bearish pressure.
- The $65 region could provide a relief bounce.
Aave’s [AAVE] TVL reached a YTD high on 24 March, while the NFT volume surged in the last week. The rejection of Bitcoin [BTC] near the $28k resistance region shifted sentiment to the bearish side across the market.
Read Aave’s [AAVE] Price Prediction 2023-24
The one-day price charts of Aave showed a downtrend could begin once again after the token’s inability to climb above $80-$83 in March. The $65 and $60 regions are expected to act as support during the downtrend.
The breakdown from the range meant $66 is the next target

Source: AAVE/USDT on TradingView
The aforementioned short-term range lasted ten days and was highlighted in yellow. It extended from $73.2 to $81.7. In the past few days, the lower bounds of the range were retested as resistance, and AAVE dropped lower on the charts.
The daily market structure was also bearish after prices fell below $73.7 on 8 March. The price could not climb to the lower high at $83.3, and the move below $73 showed the downtrend remained strong.
Realistic or not, here’s AAVE’s market cap in BTC’s terms
The RSI fell beneath neutral 50 once again to highlight a bearish trend was in progress. The OBV had been flat when the price traded within the $73-$81 range but began to slide in recent days. Therefore, the inference was that Aave bears were regaining strength.
Volatility picks up again to indicate a trending AAVE
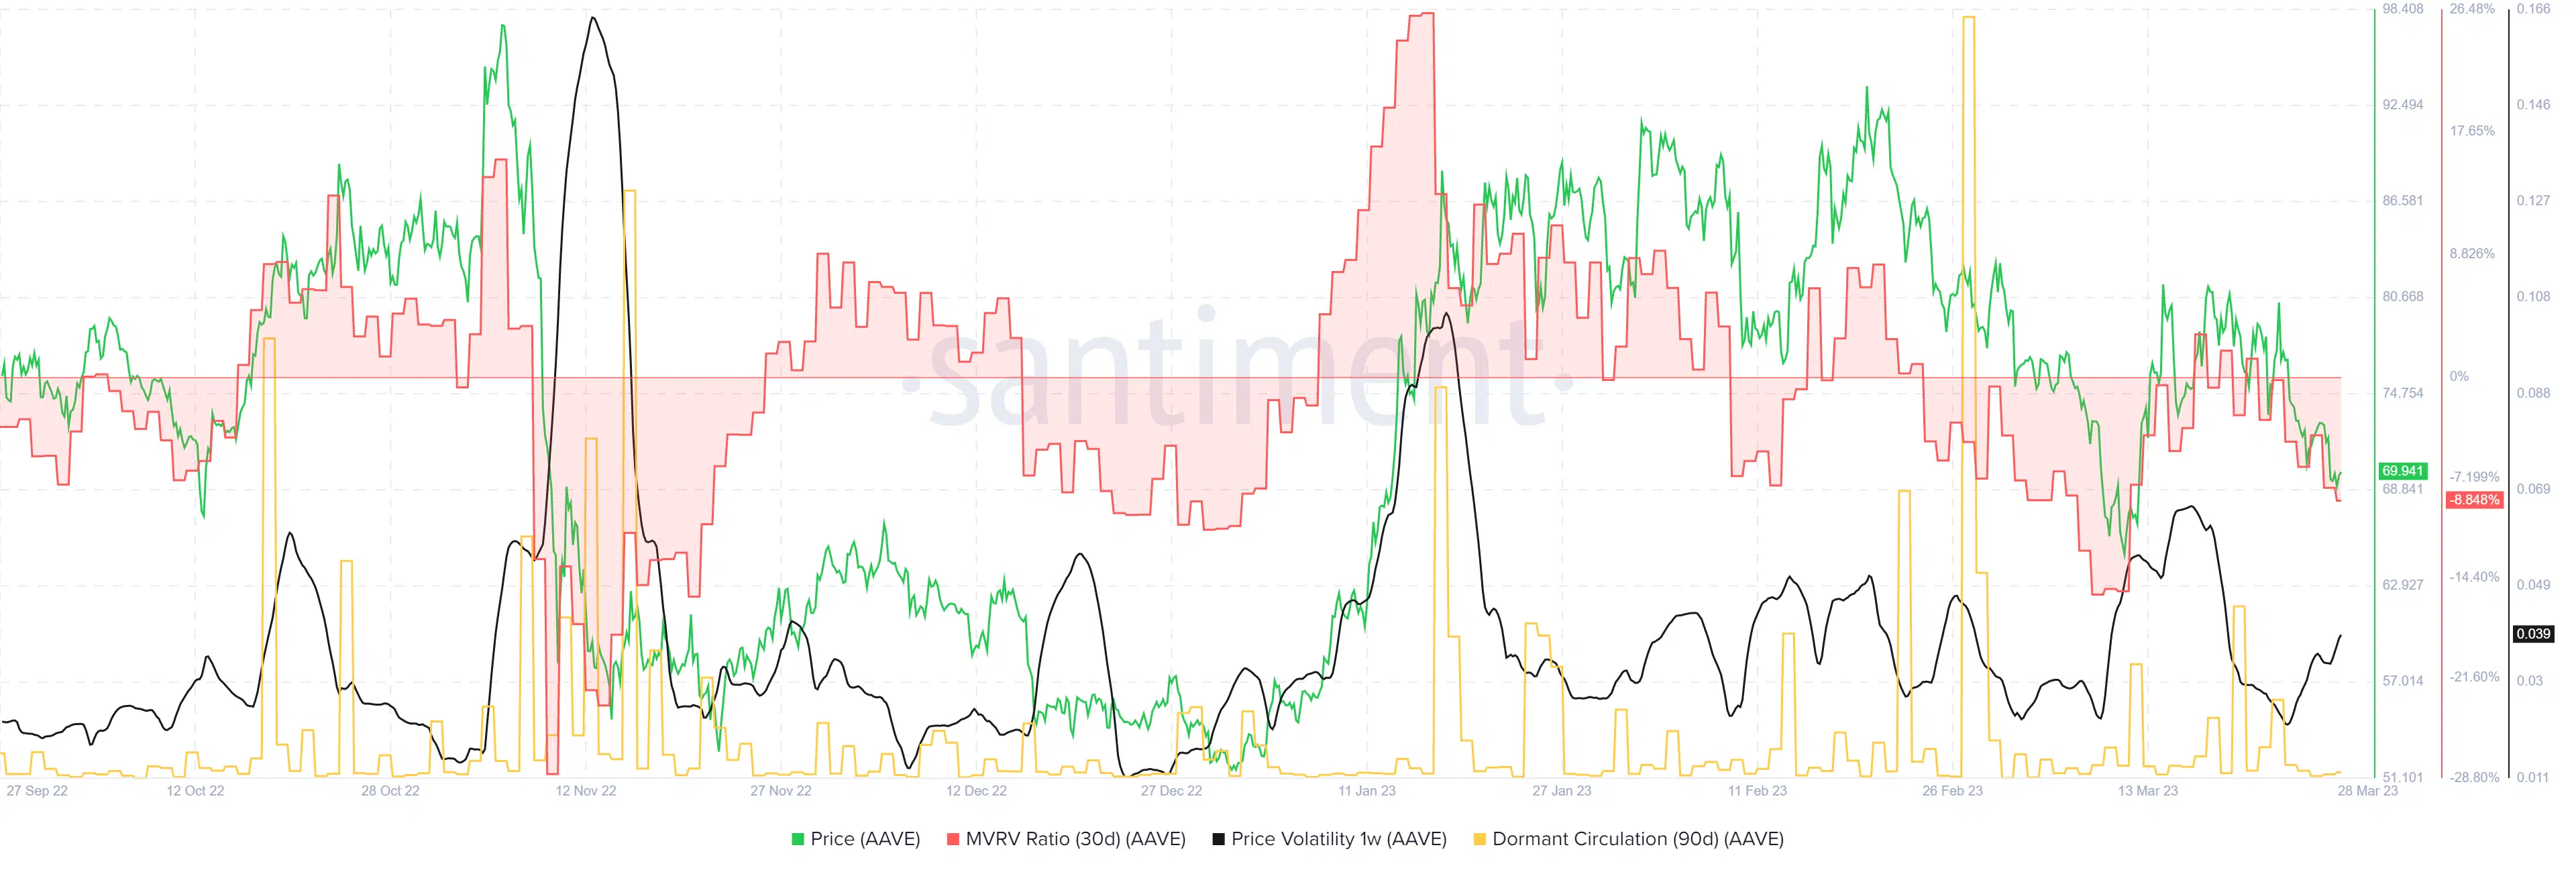
Source: Santiment
The 30-day MVRV ratio briefly resurfaced above 0 but was quickly pushed back down in response to the increased selling pressure. It showed that short-term holders were not at a profit. Moreover, they could be selling at a loss because of past week’s slide on the price charts.
The 1-week price volatility began to pick up again, which supported the idea of a strong trend behind AAVE headed south. The 90-day dormant circulation saw spikes on 21 and 23 March when prices touched the $80 mark.