AAVE: How declining investor confidence may impact your holdings

- A large holder of AAVE reduced its holdings to a two-year low on 27 February.
- AAVE price declines further as investors lose confidence.
According to the on-chain analytics platform Santiment, during the intraday trading session on 27 February, a large holder of Aave [AAVE] tokens significantly reduced its holdings by sending 363,796 AAVE tokens to two addresses that previously held zero coins. This move caused the amount of AAVE held by the whale address to drop to its lowest level since May 2021.
🐳 A long-time #Aave whale has dramatically decreased its holdings 7 hours ago, dropping to its lowest amount held since May, 2021. 363,796 $AAVE was sent to two addresses (both that were holding 0 coins). This could be a sign of diminished confidence. https://t.co/BnR8syVXYN pic.twitter.com/RJQrv3Z9XG
— Santiment (@santimentfeed) February 27, 2023
How much are 1, 10, 100 AAVE worth today?
The AAVE whale’s decision to reduce its holdings followed a 14% decline in the value of AAVE over the past week, suggesting that the whale may not be optimistic about the potential for further price growth in the short term.
How has this move impacted AAVE’s performance in the last 24 hours?
AAVE price declines as accumulation wanes
At press time, AAVE exchanged hands for $79.06. While the alt’s price declined by 3% in the last 24 hours, its trading volume rallied by almost 30% during the same period, data from CoinMarketCap revealed.
This sort of price/trading volume divergence often indicates that there are more sellers than buyers in the market. It could be because there are more traders taking profits or an isolated incident that has caused traders to liquidate their positions quickly. If there is no change in conviction and confidence is not restored, this often results in a further decline in the price of an asset.
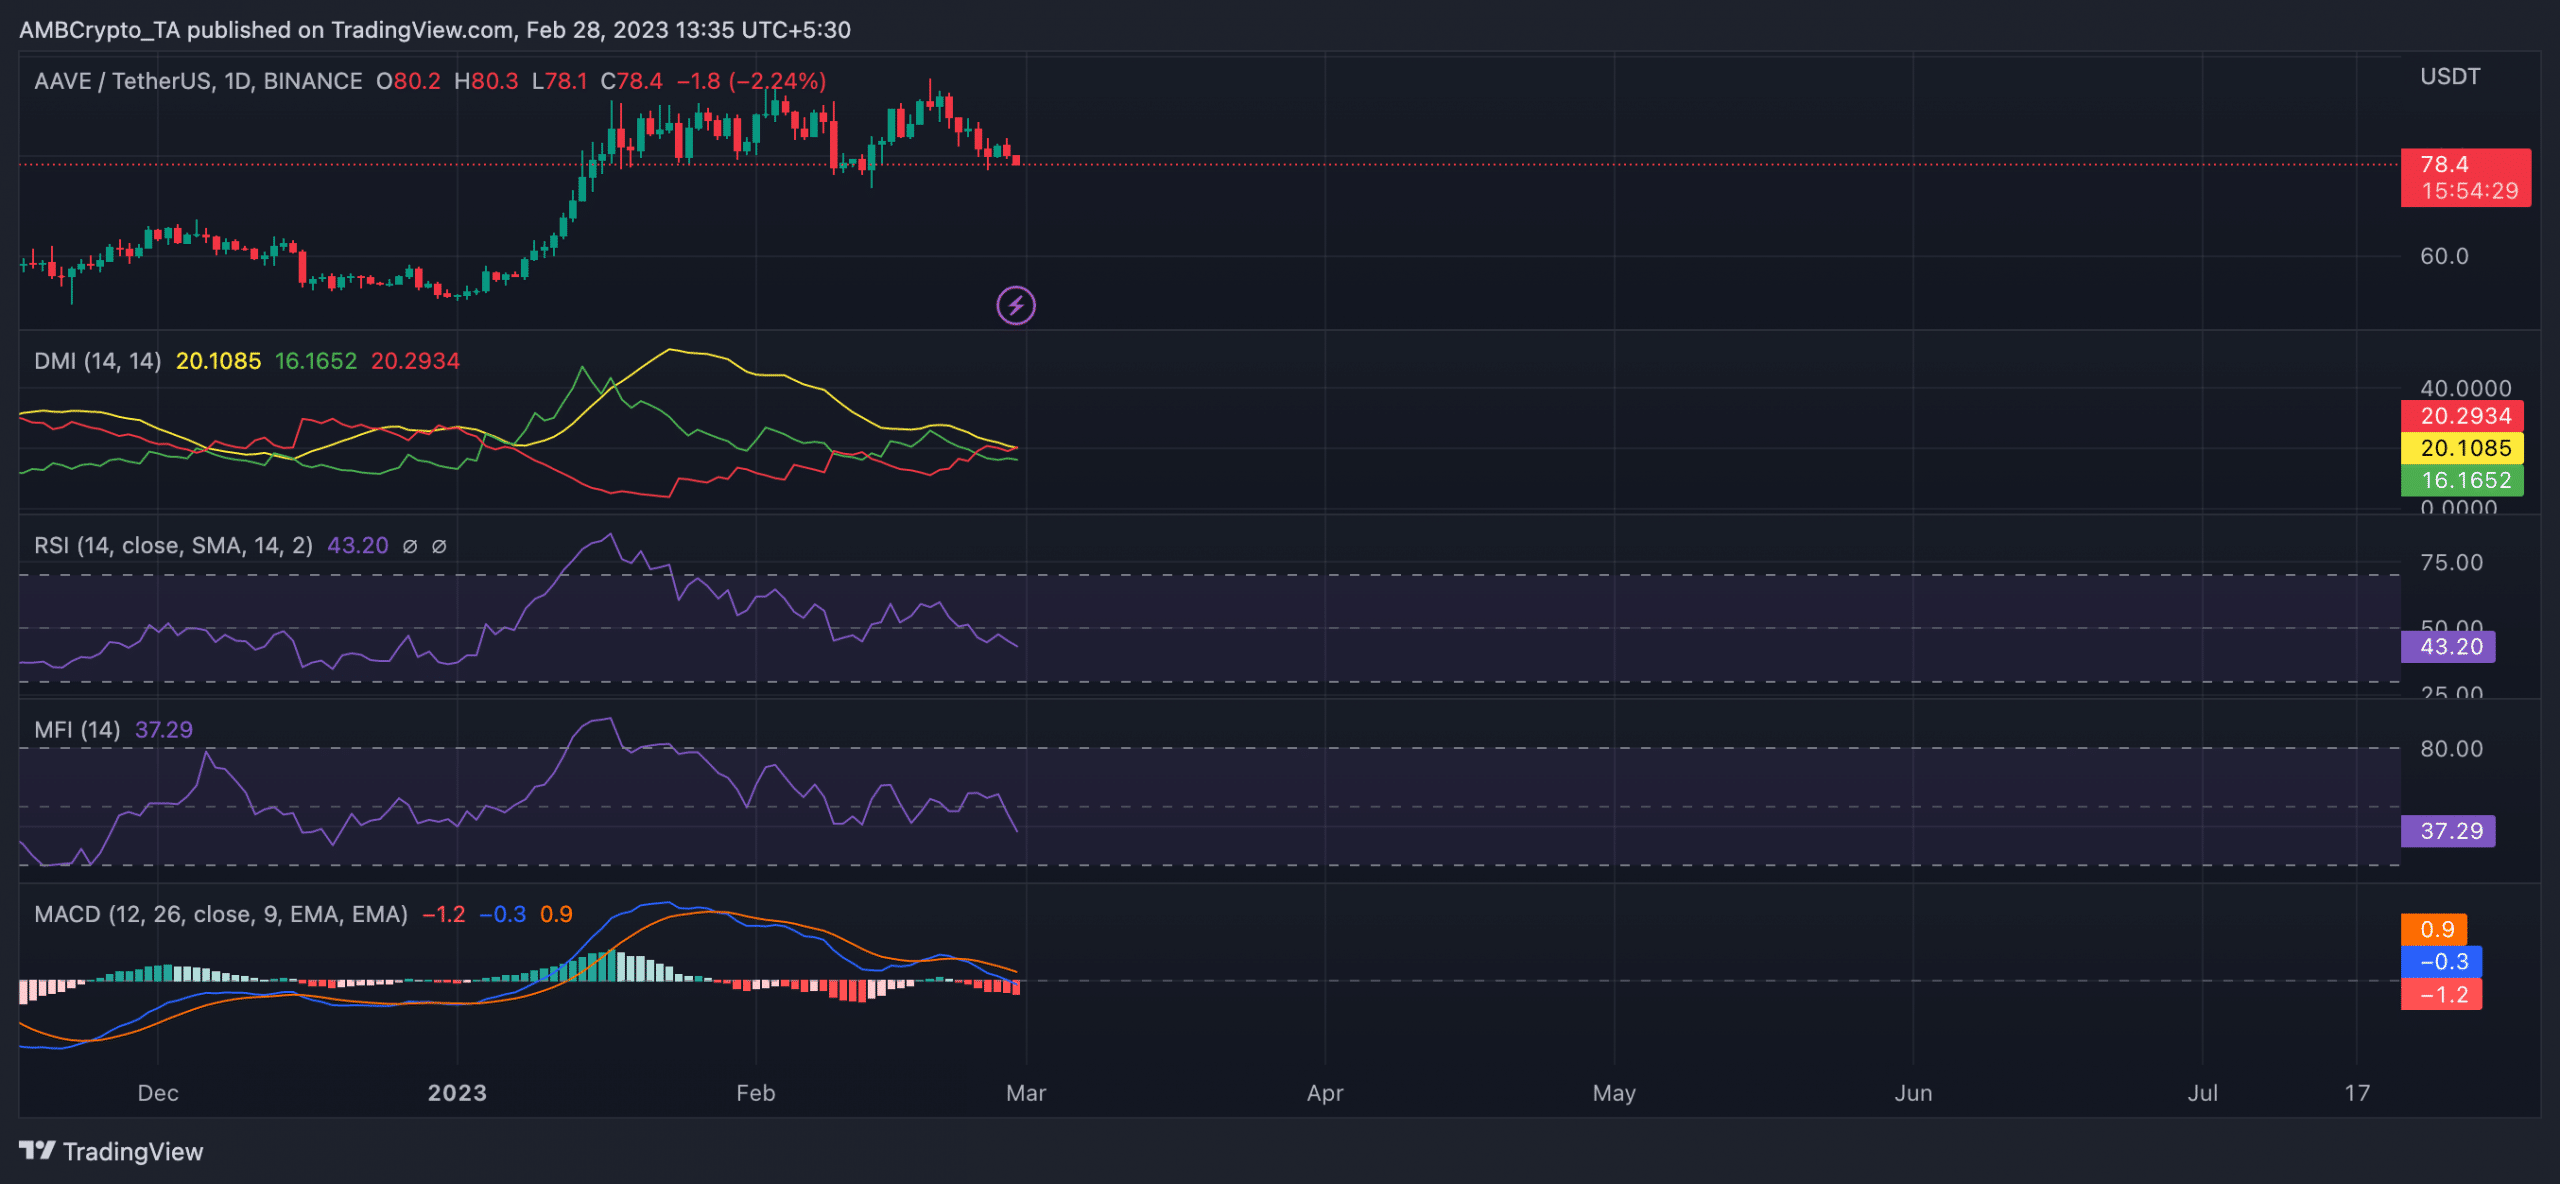
On a daily chart, the significant decline in buying pressure resulted in the commencement of a new bear cycle on 22 February, putting the bears back in control of the market. A look at AAVE’s moving average convergence/divergence (MACD) showed that the indicator has since been represented by red histogram bars, signaling a wane in buying momentum.
Moreover, key momentum indicators were spotted below their respective neutral zones at press time. For example, AAVE’s Relative Strength Index (RSI) trended downwards at 43.20, while its Money Flow Index (MFI) reached for oversold zones at 37.29.
Realistic or not, here’s AAVE’s market cap in BTC’s terms
The positions of the RSI and MFI showed the state of liquidity exit from the AAVE market, as buying pressure declined significantly since the bear cycle started. Should this continue, AAVE’s price is expected to dip further.
AAVE bears had control of the market at press time. This was evident from the token’s Directional Movement Index (DMI) readings. As of this writing, the sellers’ strength (red) at 20.29 rested above the buyers’ (green) at 16.16.