Analysis

AAVE recovers over $200 level, but critical resistances still lie up ahead
Posted:
Journalist

Throughout the whole of 2021, Aave had visited the $160 area only twice (after climbing past it in early January), until December. In December alone, the price tested this area on two separate occasions, a candlewick on a strong sell-off and a more rounded test of this demand region in mid-December. At the time of writing, Aave was rejected at trendline resistance but had managed to climb above $228. Has Aave begun to reverse its trend?
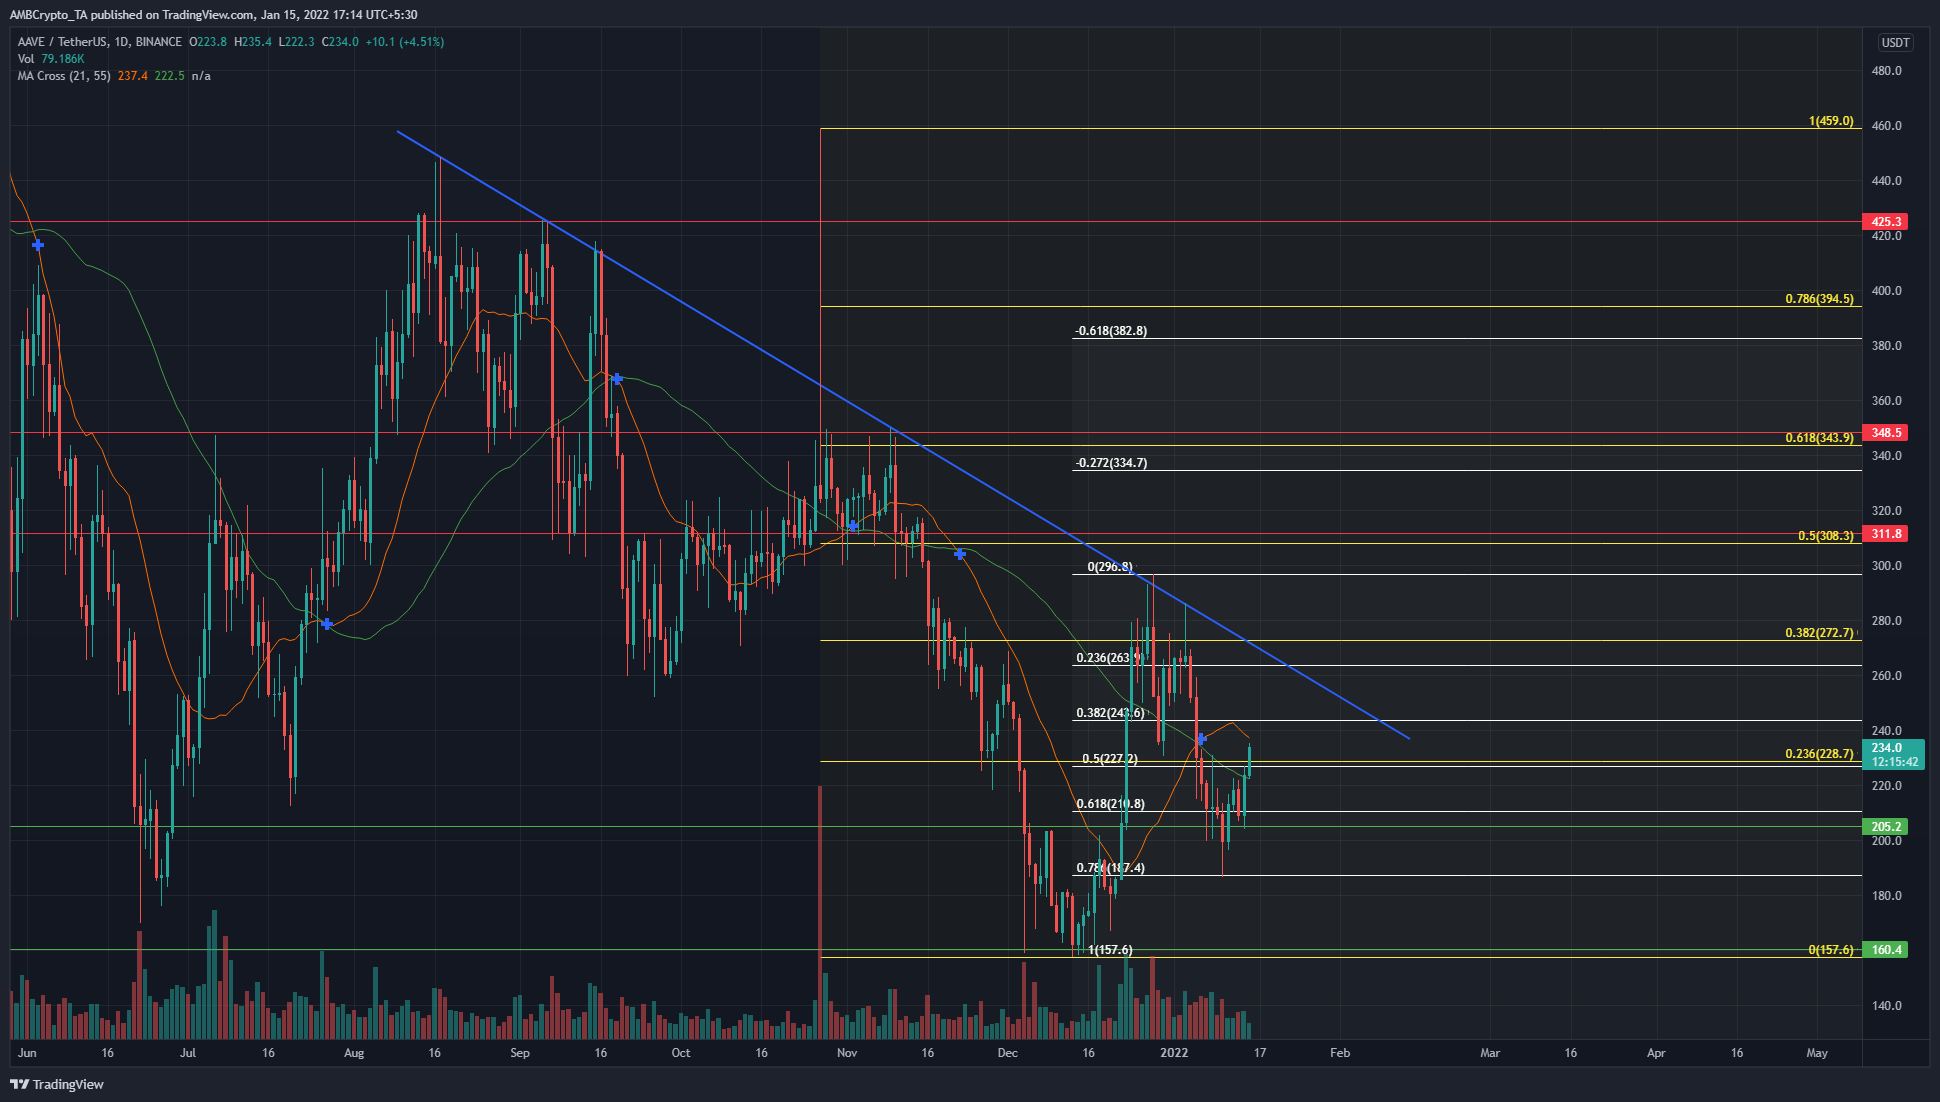
Source: AAVE/USDT on TradingView
Two sets of Fibonacci retracement levels were plotted, one from $459 to $157.6, the drop in November and early December (white). The other was the impulse move above $200, from $157.6 to $296.8 (yellow) at the trendline resistance (blue).
The price has tested the 78.6% retracement level at $187.4 and bounced, with the 61.8% level also being a hotly contested level. The bounce following the deep retracement has risen above $228 once more.
There was confluence between the two sets of retracement levels at $228. At the time of writing, the price had pushed above this level, and a daily close above this level would be a bullish development for the next few days. A retest of this level would be a buying opportunity.
The price has made a higher low in the past couple of weeks, which has followed a daily close above $270. This move should give bulls some hope, but there were several resistance levels above to battle past.
Rationale
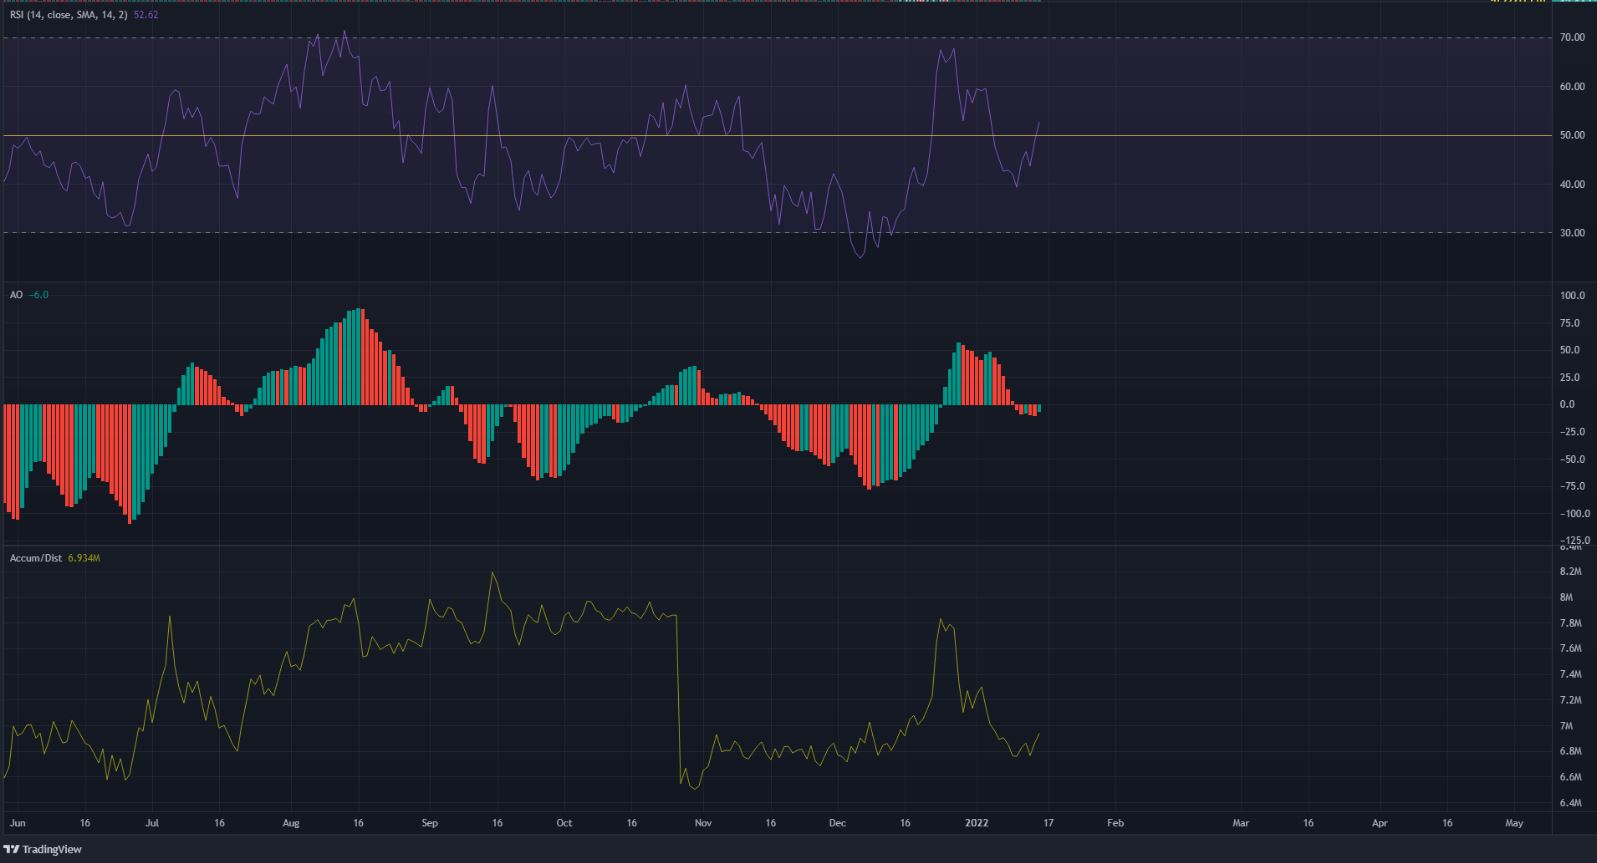
Source: AAVE/USDT on TradingView
The daily RSI went from oversold, almost all the way to the 70 mark on the back of the strong upward move in mid-December. At the time of writing, the RSI was back below neutral 50. In the past, the 40 value and its vicinity have seen the daily RSI bounce, and this was repeated once more in recent days.
The Awesome Oscillator was beneath the zero line, but only weakly so. This indicated that, rather than bearish momentum, it was more of a result of the deep pullback.
The Accumulation/Distribution line has followed the price movement and showed no divergence. The past few days have seen buying volume outweigh the selling volume.
Conclusion
The trendline resistance had its beginning in August and was a level that needed to be broken before the long-term trend can flip. The formation of a higher low after $160, at the $200 area, was encouraging. A daily close above $228, followed by a retest, appeared to be a possible route for AAVE in the coming days. Breaking above the $260-$270 liquidity pocket could see AAVE climb to $300 and $340.