After rally to $720, BNB could drop to $574: Here’s why
The bearish bias toward BNB has skyrocketed since it rallied to an all-time high of $720.67 on the 6th of June.

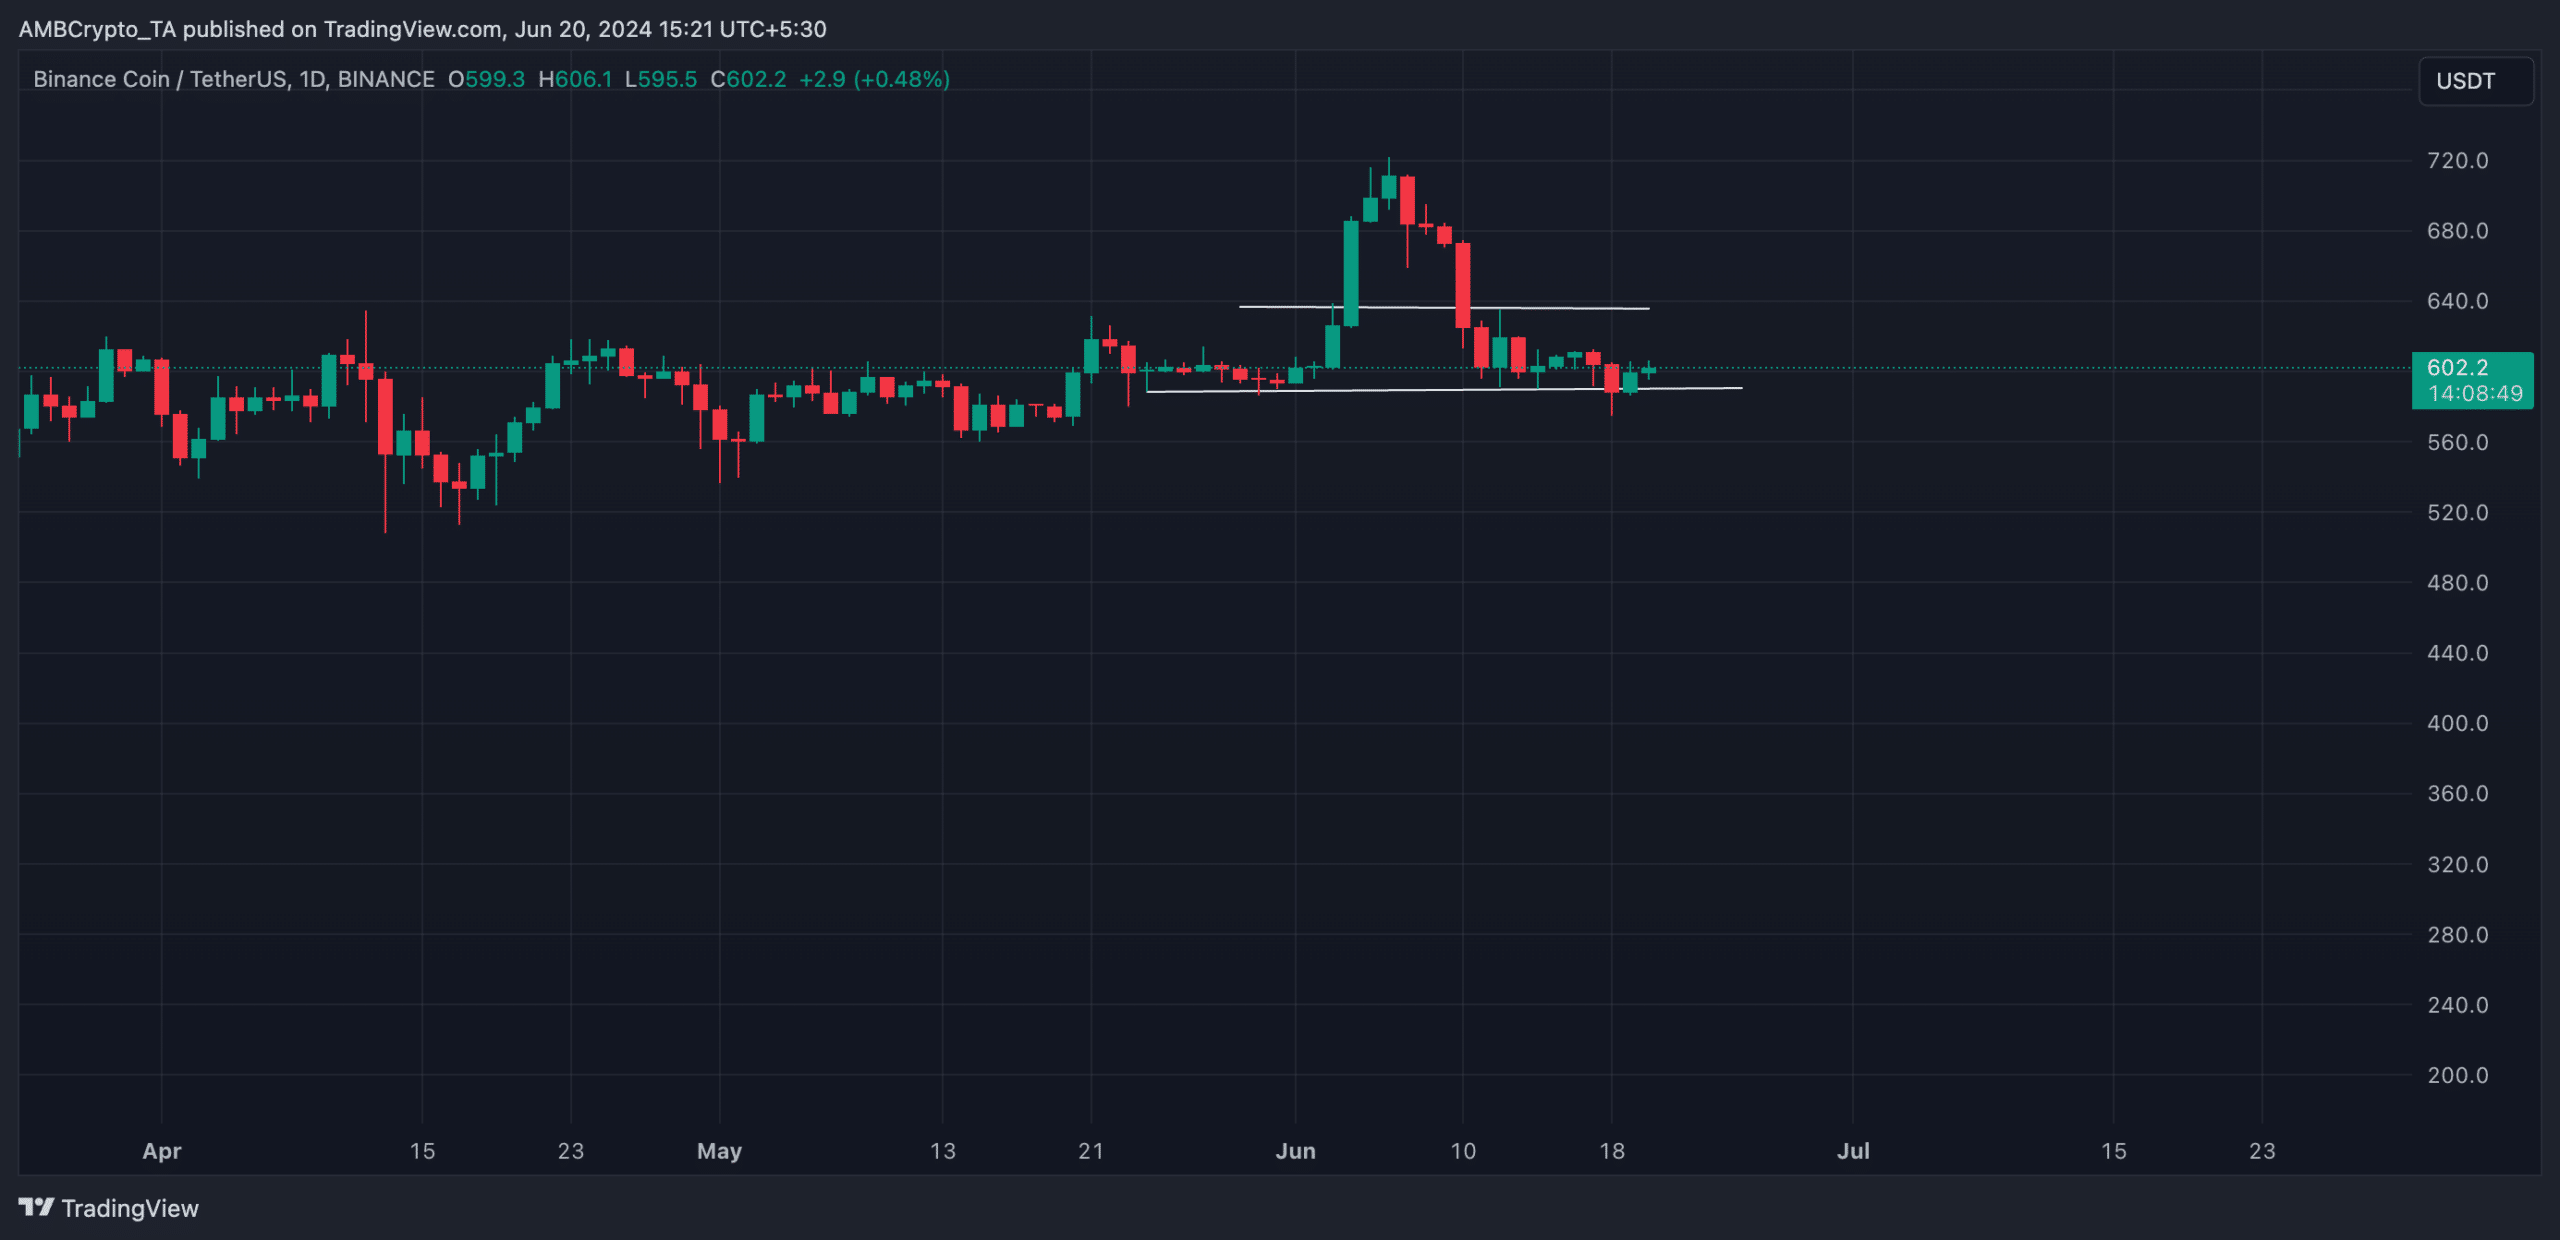
- BNB’s price trended within a range at press time.
- Its momentum indicators signaled a decline in demand for the altcoin.
Binance Coin [BNB] rallied to an all-time high of $720.67 on the 6th of June and has since declined due to the surge in profit-taking activity.
The altcoin’s price even fell below the breakout point of $626 on the 10th of June. Since then, it has trended within a narrow range and formed a horizontal channel.
This channel is formed when an asset’s price consolidates within a range for a period.
It manifests when there is a relative balance between buying and selling pressures, which prevents the price from trending strongly in either direction.
The upper line of this channel forms resistance, while the lower line forms support.
Since BNB fell below the breakout level and began trending sideways, the bears have formed resistance at $635, while the bulls have defended the coin’s price at $591, creating a support level.
BNB bears dominate
Readings from BNB’s Directional Movement Index (DMI) confirmed the current bearish bias toward the altcoin. At press time, its negative directional index (red) at 26.99 rested above its positive index (green) at 16.30.
An asset’s DMI measures the strength and direction of its price trend. When the positive index lies below the negative index, the market’s downtrend is stronger than the uptrend.
This setup suggests that the sellers have more control over the market than the buyers during the period under consideration.
The value of ADA’s Aroon Down Line lent credence to the position above. As of this writing, the indicator’s value was 85.71%.
The Aroon indicator identifies an asset’s trend strength and tracks its potential price reversal points.
When its Down Line is at or returns a value close to 100%, it signals that the market’s downtrend is strong and that the most recent low was reached relatively recently.
Further, BNB’s key momentum indicators signaled traders’ preference for selling their coin holdings.
For example, BNB’s Relative Strength Index (RSI) and Money Flow Index (MFI) were 45.75 and 26.58, respectively.
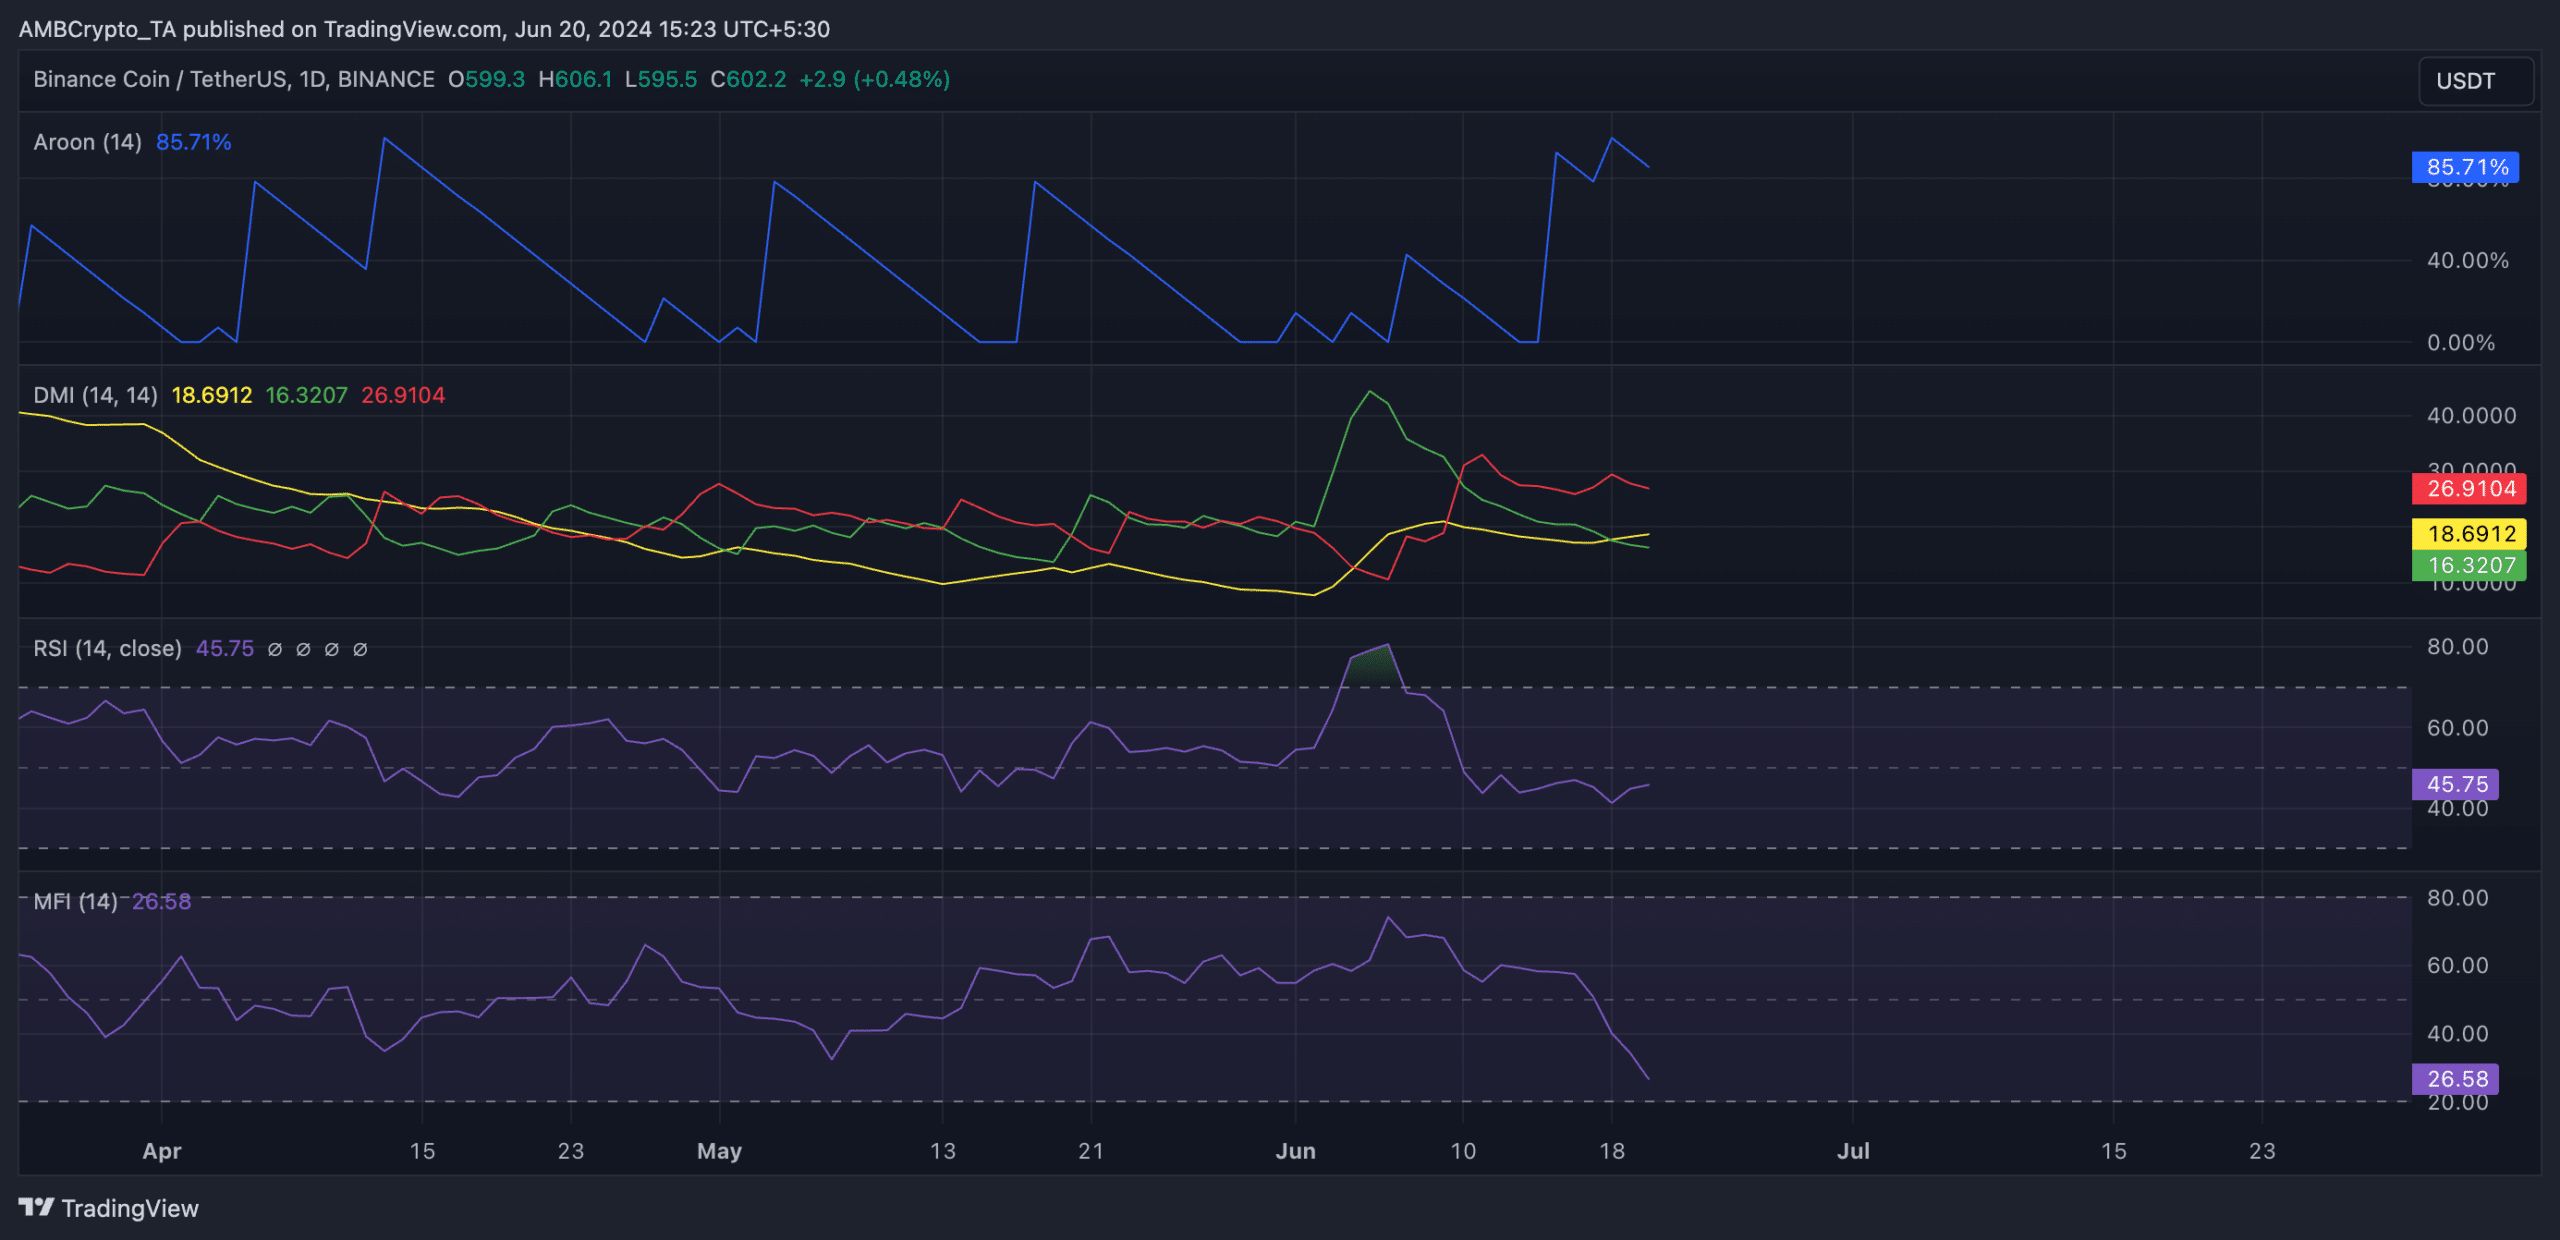
These indicators measure the coin’s overbought and oversold conditions. At their values at press time, they showed that ADA sell-offs outweighed accumulation efforts among its traders.
Realistic or not, here’s BNB’s market cap in BTC’s terms
Should this trend continue, BNB may fall under the $600 price region to trade at $574.
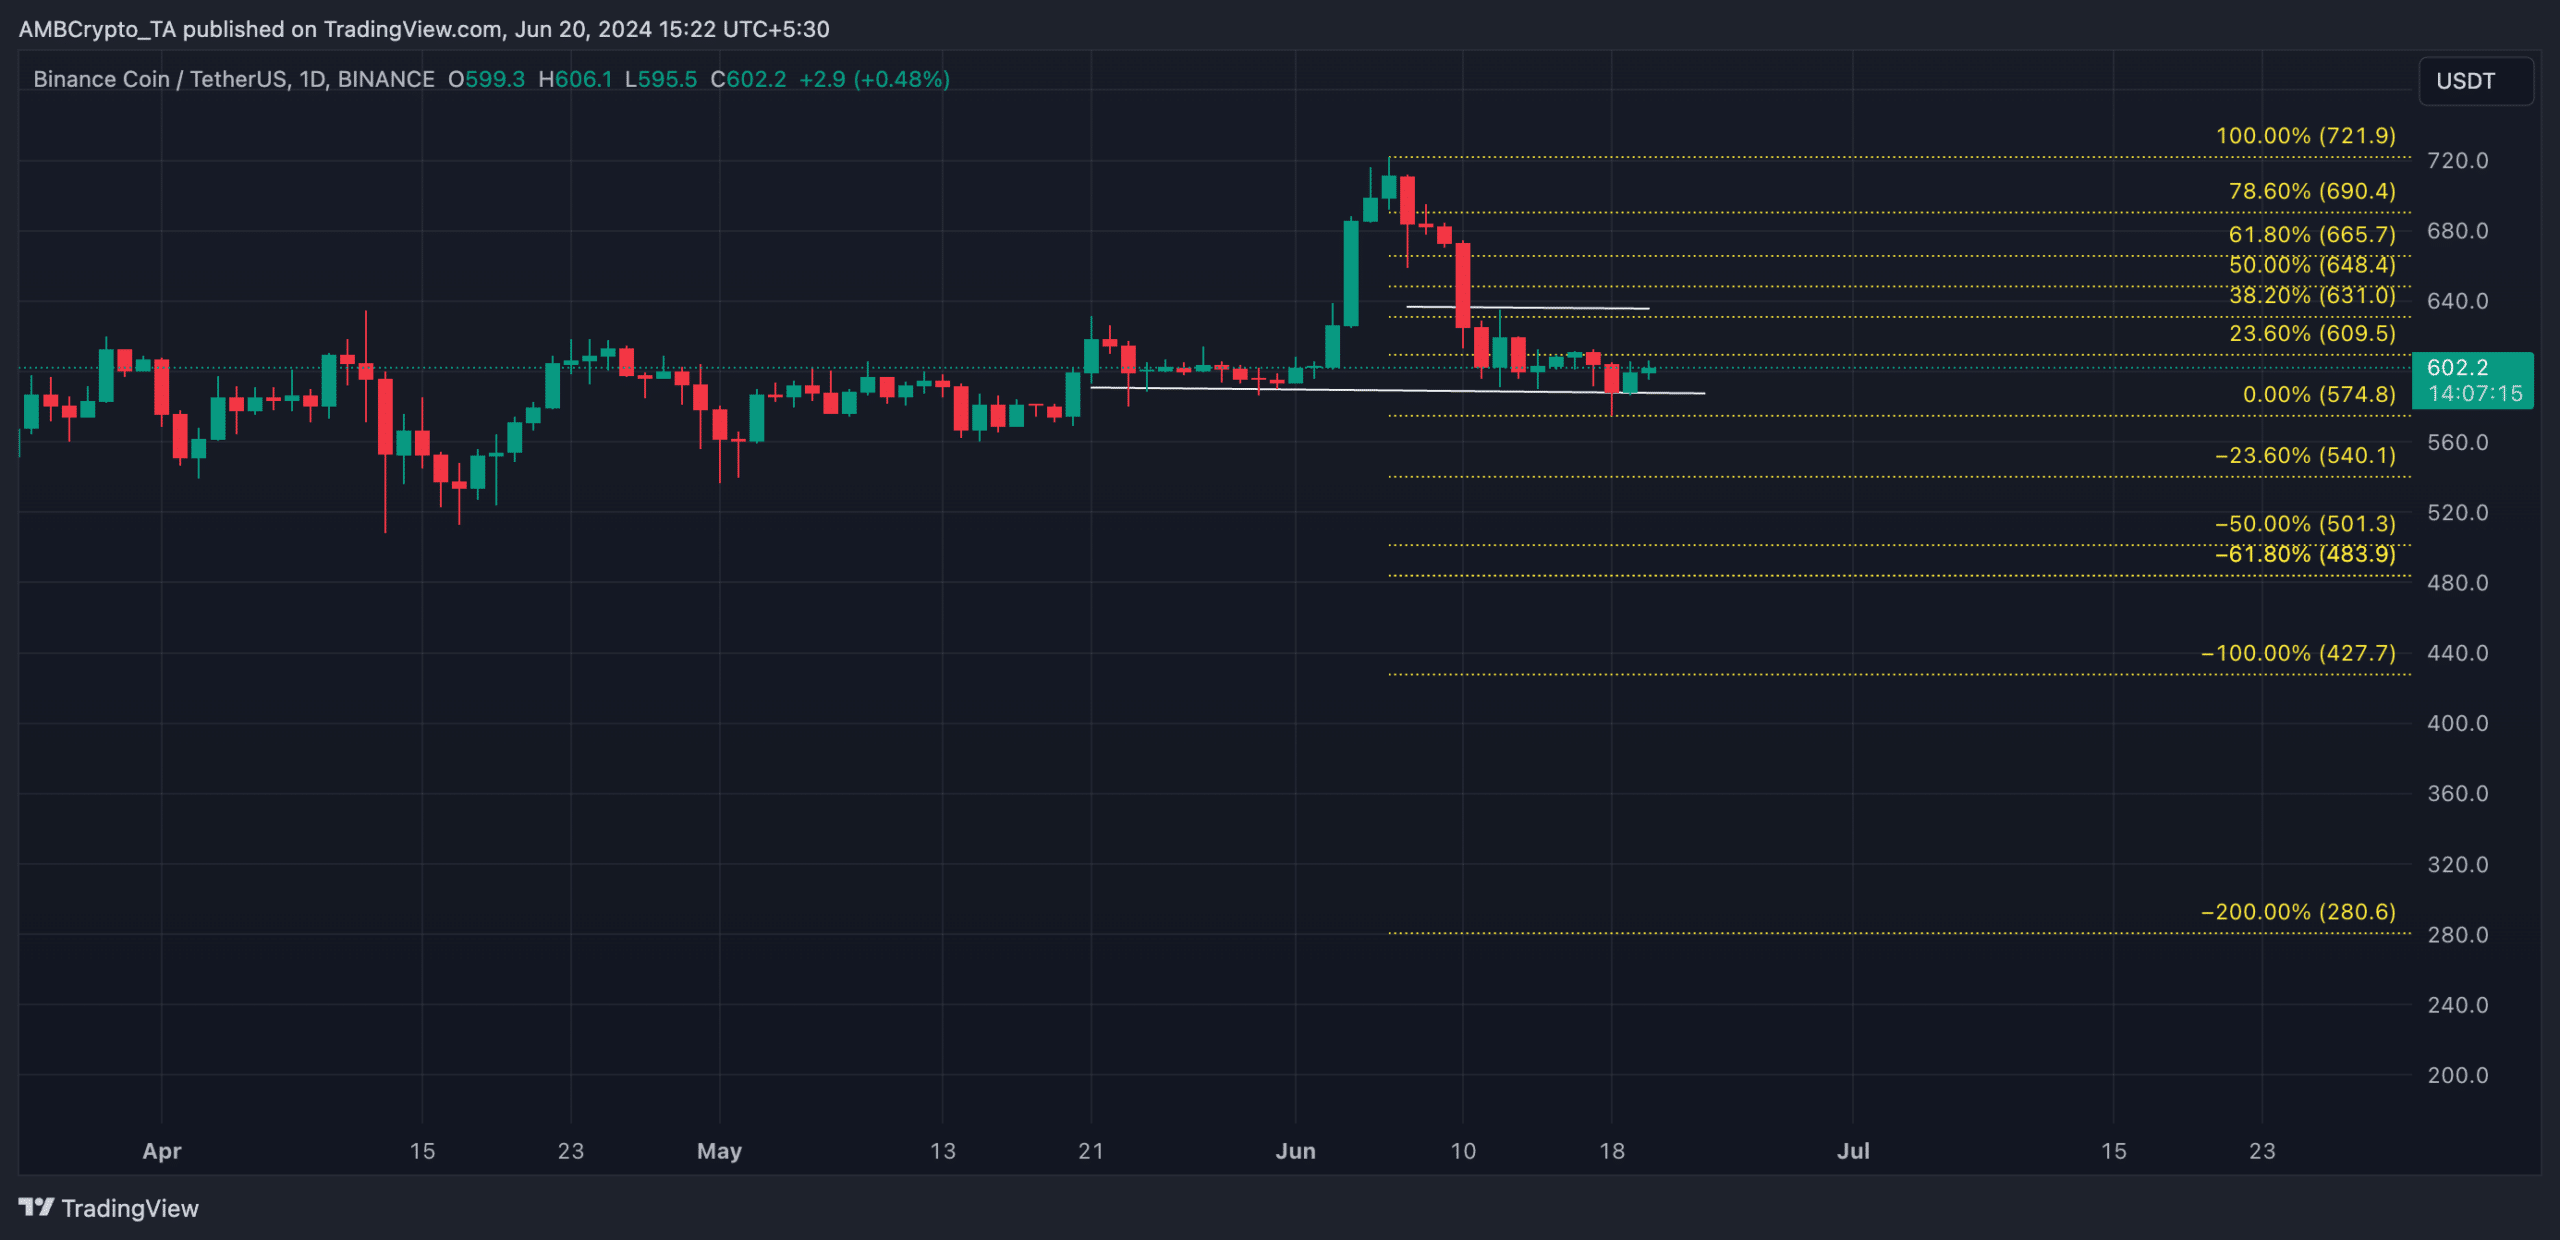
However, if the bulls reclaim market control, they may drive a rally and cause the altcoin to exchange hands at $609.


