Algorand, Cronos, Litecoin Price Analysis: 01 March

While the global crypto market poked above the $2 Trillion-mark, Algorand’s 20 EMA moved above its 50 EMA. But it faced a strong hurdle near the 23.6% Fibonacci level. Further, Cronos saw an ascending triangle breakout but struggled to topple its trendline resistance.
Interestingly, Litecoin formed a bullish pattern on its 4-hour chart while the bulls needed to defend the $111-mark to confirm its strength.
Algorand (ALGO)
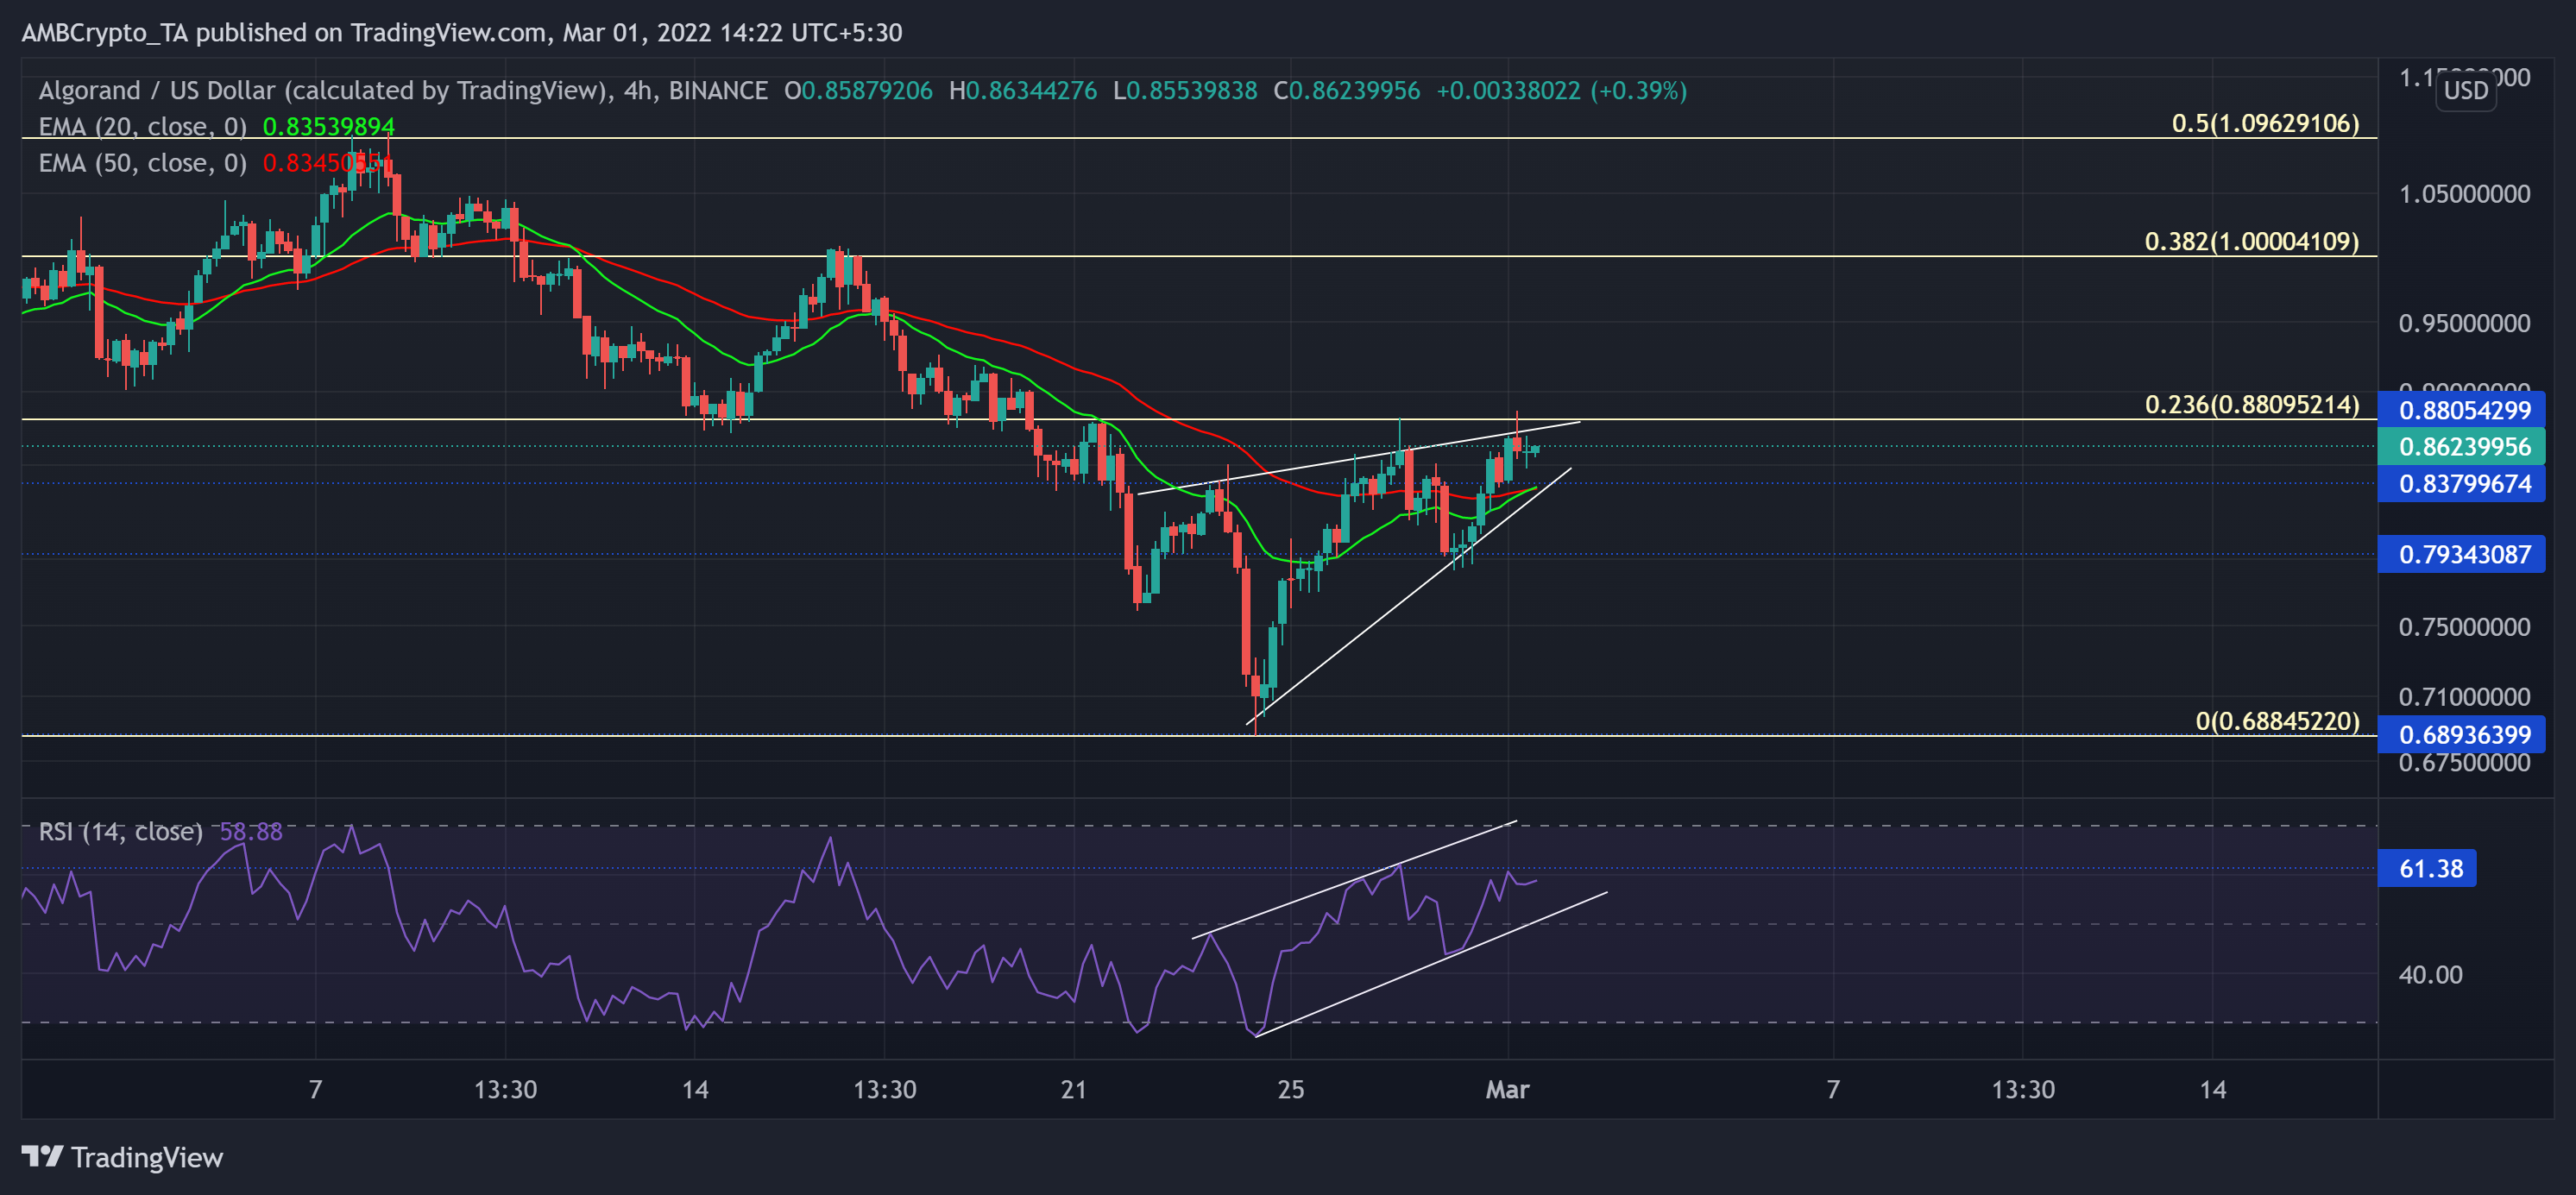
The January sell-off fueled the already existent bearish tendencies of ALGO. As a result, the alt lost nearly 61.5% of its value (from 5 January) and poked its seven-month low on 24 February.
As the $0.68-mark support stood strong, the alt saw a rising wedge (white) recovery. But it still faced a barrier at the 23.6% Fibonacci level to confirm a strong recovery. Now, with the 20 EMA (green) trying to find a sustained close above the 50 EMA (red), the bulls displayed their increasing influence.
At press time, ALGO was trading traded at $0.8624. The RSI stood at the 58-mark after assuming an up-channel trajectory. If the sellers fail to defend the 61-resistance, a further recovery toward the overbought region would be probable.
Cronos (CRO)

Since losing the $0.53-mark as support, CRO has managed to find a floor at $0.33 while ensuring the ceiling at the $0.53-level. In the downtrend phase, it lost nearly half its value and hit its two-month low on 22 January.
Over the past few days, after breaking out of the down-channel (white), the bulls started to exert pressure by marking higher troughs. As a result, CRO witnessed an ascending triangle breakout. But this breakout halted at the trendline resistance (yellow, dashed). Now, any retracements would find support testing grounds in the $0.42-range.
At press time, CRO traded at $0.4374. The RSI grew in an up-channel (yellow) while revealing a bullish edge. Any close below the 61-level could cause a further pullback.
Litecoin (LTC)

LTC’s previous rally from January lows halted near the $143-resistance. As a result, it reversed and lost over 37% of its value and plunged toward its 14-month low on 24 February.
As a result, the bears flipped the vital $105-mark from support to resistance. In the last few days, LTC saw an inverse head and shoulder pattern on its 4-hour chart. But its breakout was shunned by the $114-mark. The buyers needed to step in at the $111-level to prevent a further downfall.
At press time, LTC was trading at $111.9. The RSI still hovered above the half-line. The 57-mark would be crucial for the bulls to defend and confirm a further recovery.