Algorand: Despite mild strength, bears could force reversal at this level

Disclaimer: The findings of the following analysis are the sole opinions of the writer and should not be considered investment advice.
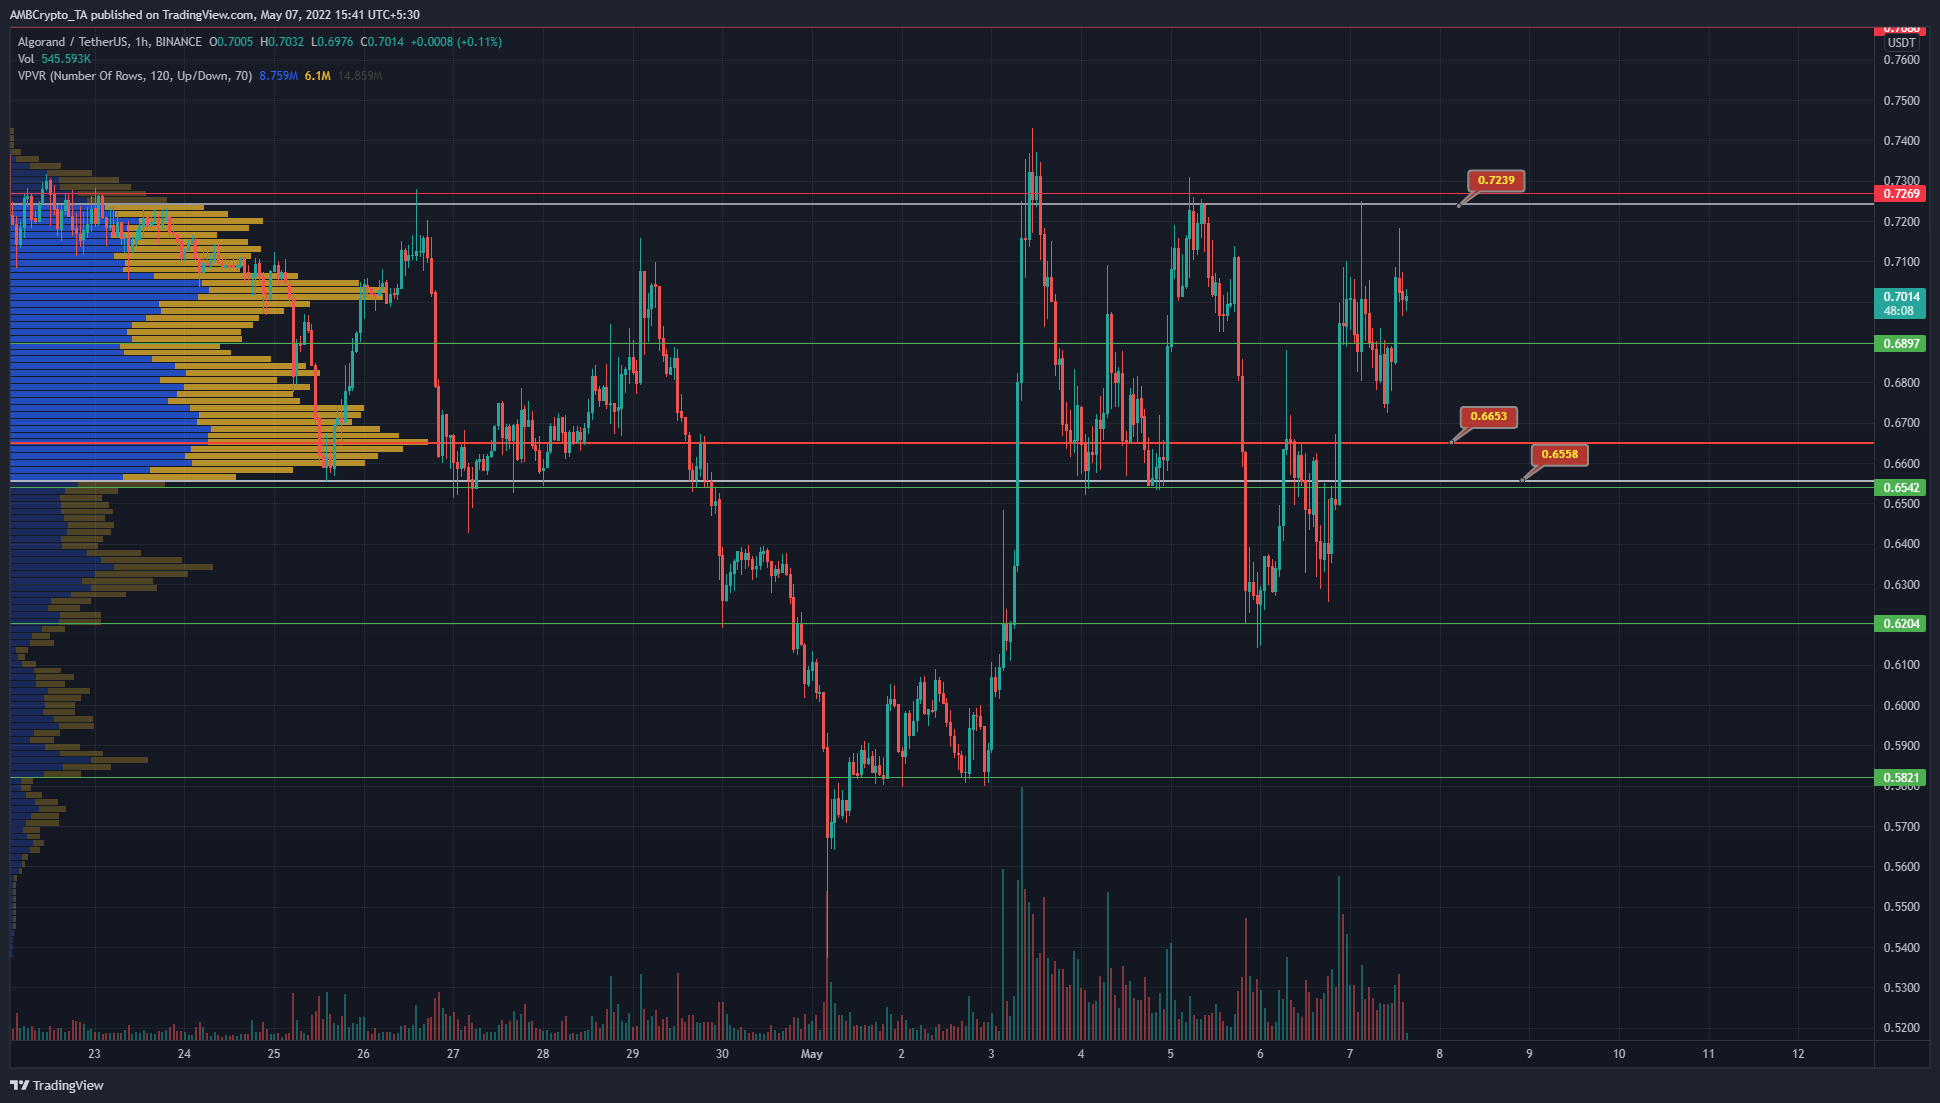
A few days ago, FIFA announced Algorand to be its official blockchain to empower “the global football community with cutting edge, sustainable technology”. This could boost its reputation in the mainstream and drive adoption. The announcement could have driven a rally on the price charts toward $0.73, but in the days to come, can ALGO climb higher?
ALGO- 1 Hour Chart
As April drew to a close, the trend of the coin was downward. In May, combined with the FIFA announcement and a bounce from the $0.58 support level, a rally to $0.73 was seen. So what is the market structure like?
In short, bearish, since ALGO was forced to dip back beneath the $0.65 support level. Since that surge, lower highs have been registered as well. The VPVR tool also highlights how most of the visible range’s trading volume occurred between the $0.655 to $0.724 levels, which are the Value Area Lows and Highs respectively. The Point of Control stands at $0.665, which was comfortably below where ALGO was trading at press time, and could act as support on a move downward.
Doesn’t the early May rally mean that buyers are in control? Yes, they were, for a short while, until they faced rejection at $0.73. Therefore, a retest of the Value Area Highs can be used to enter a short position.
Rationale
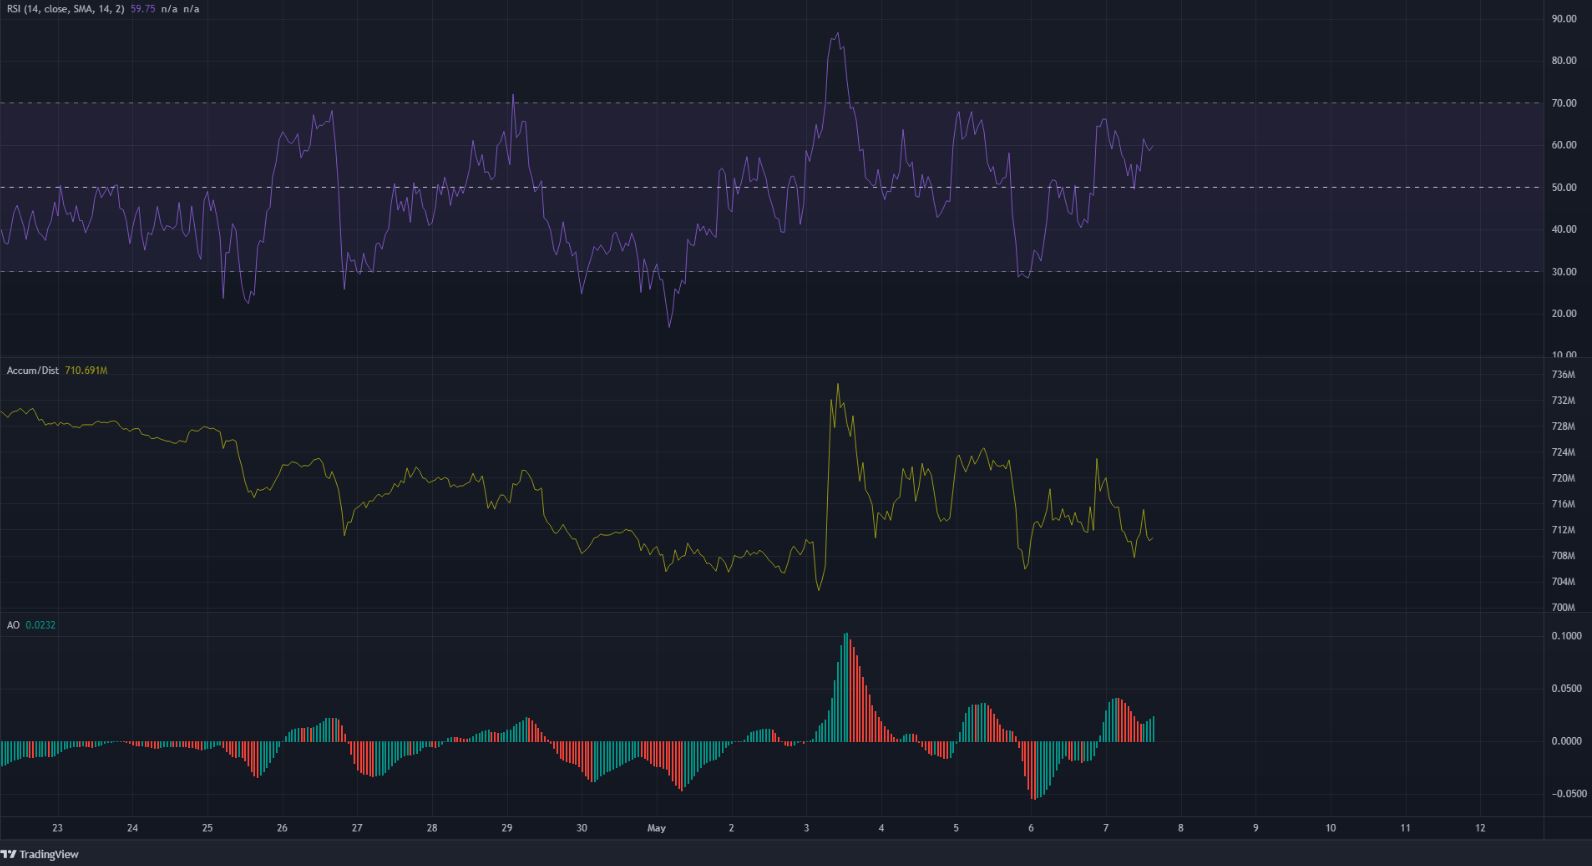
The RSI was above the neutral 50 line, but the movement of the RSI over the past week resembles a range rather than a trend. Considering the aforementioned VAH/VAL points, there is an indication that ALGO is not trending strongly in either direction despite the strong surge from $0.58.
To reinforce the notion of a range, the A/D has been moving sideways over the past few days without a real trend in either direction. The Awesome Oscillator, like the RSI, showed bullish momentum was prevalent in recent hours.
Conclusion
Algorand could surge past the $0.72-$0.74 area in the days to come. However, in the near term, fear is dominant in the market. Selling ALGO just above the Value Area Highs could be a less risky trade than attempting to buy at support. The indicators seemed to favor the idea of a range over the past few days as well.


