Binance
All about BNB’s record-breaking week – Is $900 on the horizon?
After touching an all-time high, BNB might turn bearish as few metrics hint at a price correction.


- BNB’s precise dropped by more than 1% in the last 24 hours.
- In the event of a price correction, the coin might drop to $687.
BNB showcased a spectacular performance last week as the coin’s price reached an all-time high. If the latest data is to be believed, then this might just be the beginning, as BNB might continue its uptrend.
However, bears stepped up in the last 24 hours. Will this impact the coin’s bull rally?
BNB to touch $900
AMBCrypto reported earlier how BNB gained bullish momentum and touched an ATH. This new price range has attracted more traders, leading to a surge in open interest to its highest level in months.
Thanks to the rise in price, the token’s social volume spiked sharply, reflecting a rise in its popularity.
Its weighted sentiment increased substantially on the 5th of June, which meant that bullish sentiment around the coin was dominant in the market.
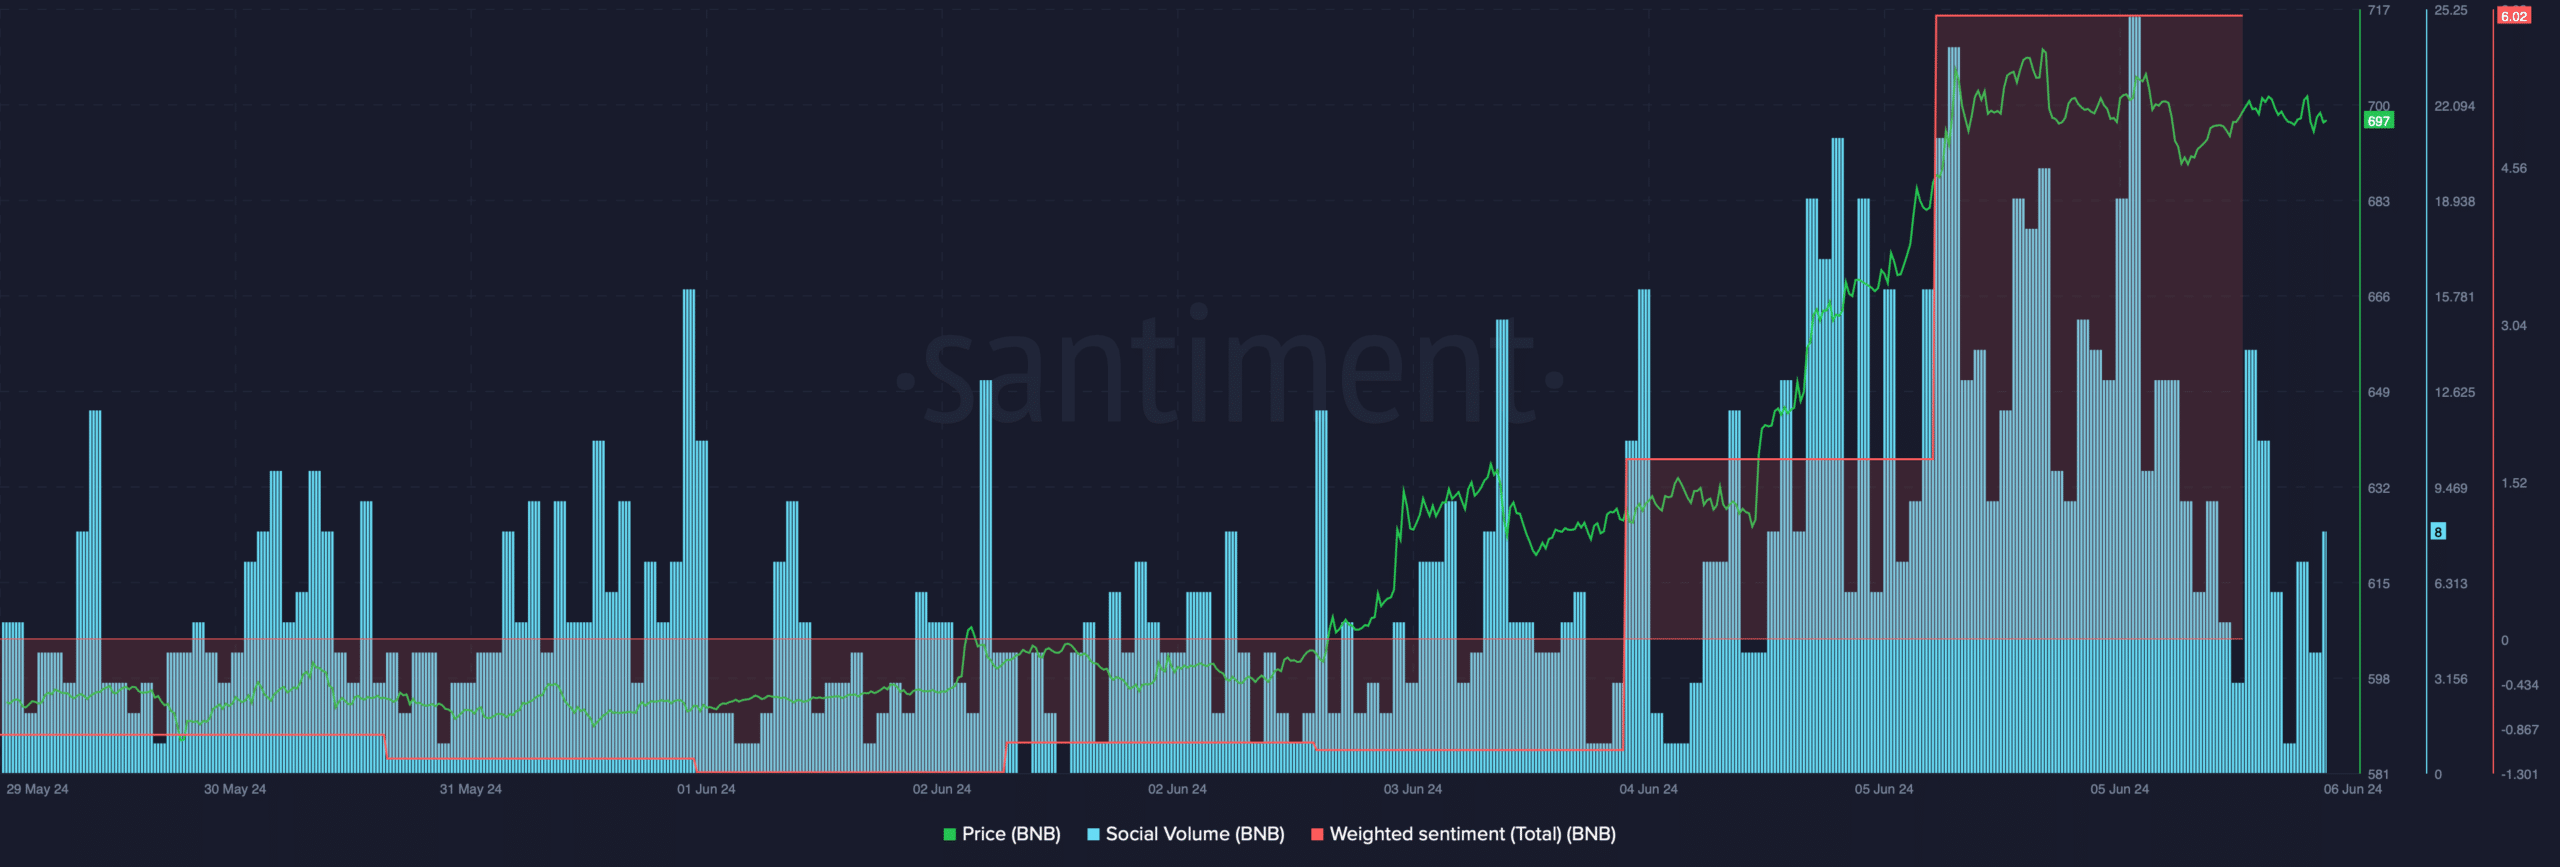
Source: Santiment
World Of Charts, a popular crypto analyst, recently posted a tweet highlighting an interesting development.
As per the analysis, BNB might just be in the middle of a bull rally as it has the potential to grow by 49%. If that surge happens, then investors might witness the coin cross $900 in the coming weeks or months.
Is BNB’s bull rally ending?
Though the aforementioned data looked optimistic, bears took control over the last 24 hours as the coin’s value dropped.
According to CoinMarketCap, the coin’s price declined by over 1% over the last day. At the time of writing, the coin was trading at $699.13 with a market capitalization of more than $103 billion.
AMBCrypto’s look at Santiment’s data revealed that the coin’s funding rate increased sharply.
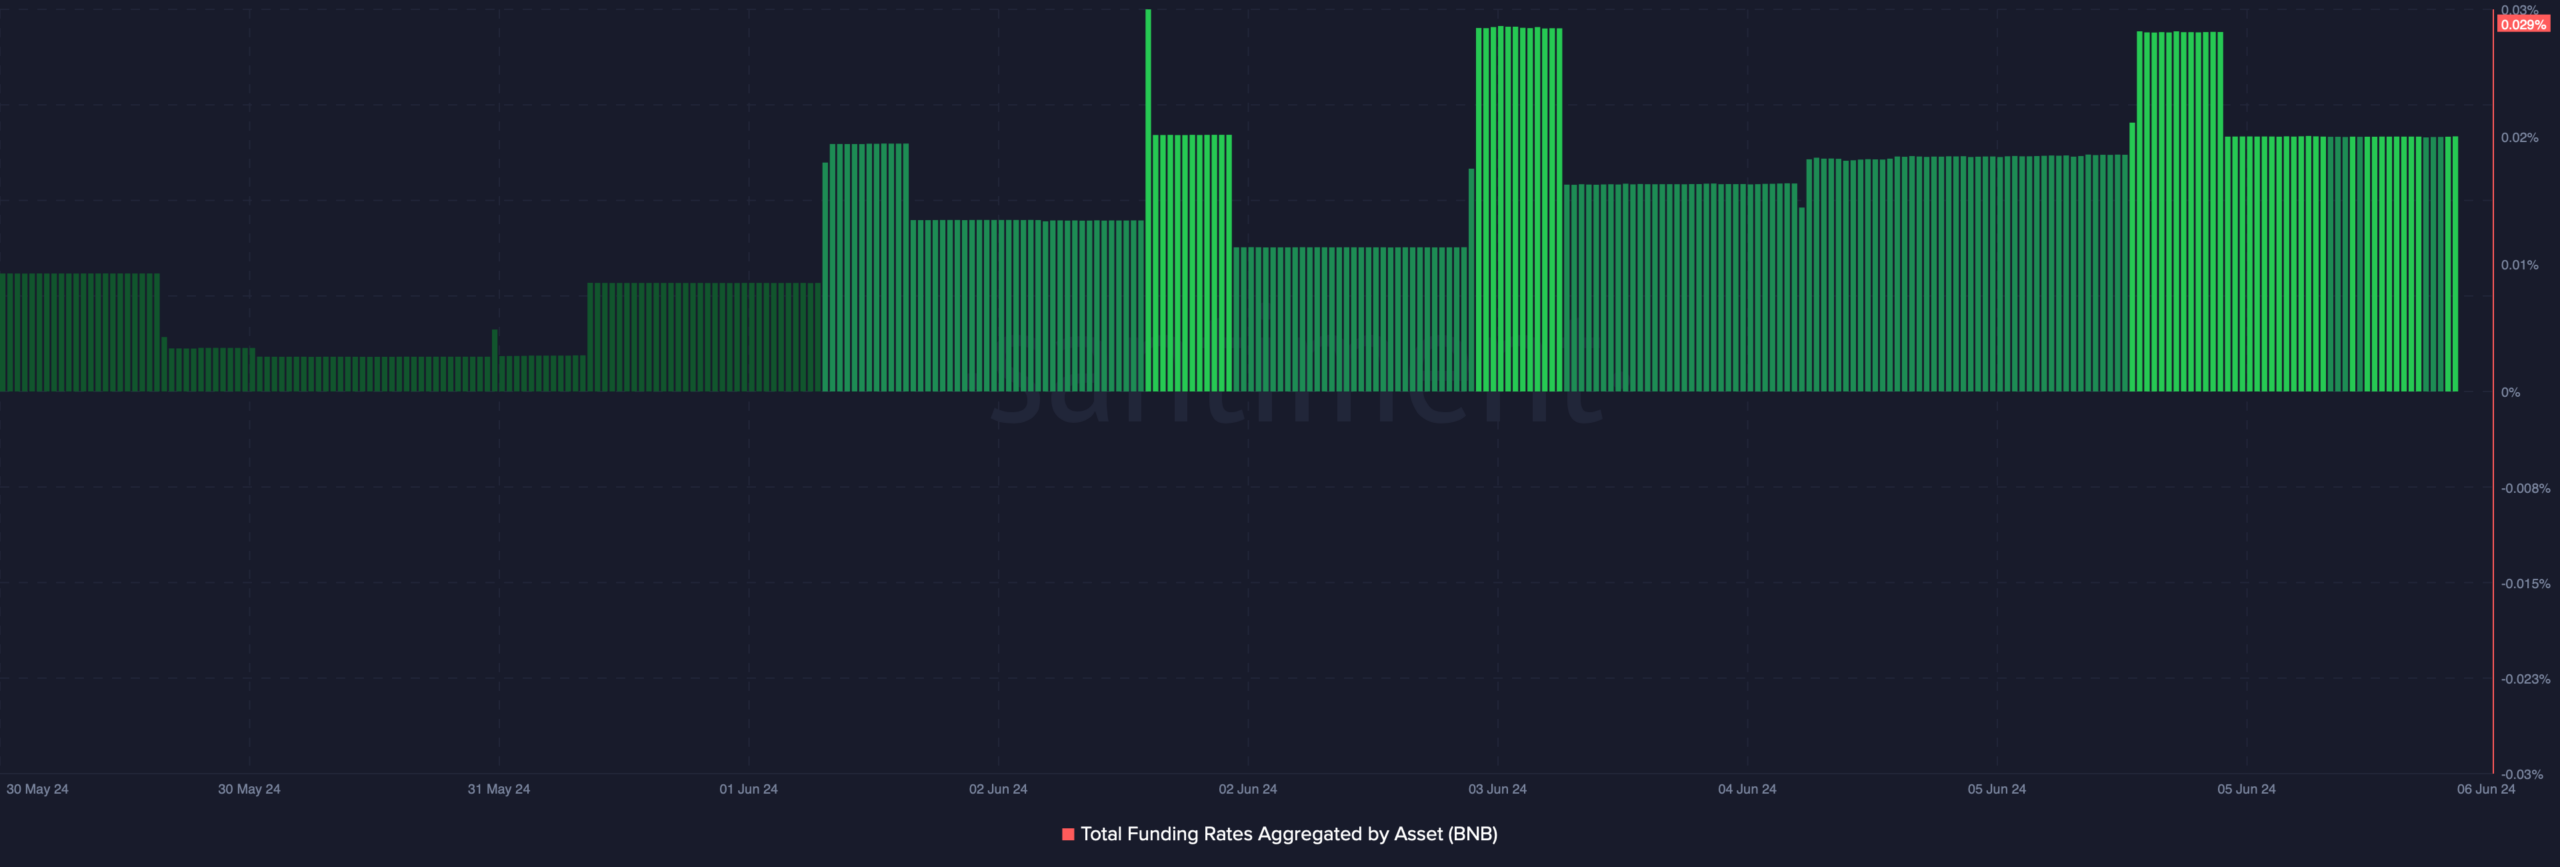
Source: Santiment
This looked bearish, as generally, prices tend to move the other way than the funding rate.
On top of that, BNB’s fear and greed index had a value of 87% at press time, meaning that the market was in an “extreme greed” phase.
Whenever the metric hits that level, it indicates that the chances of a price correction are substantially high. AMBCrypto then checked BNB’s daily chart to see whether its bull rally was ending.
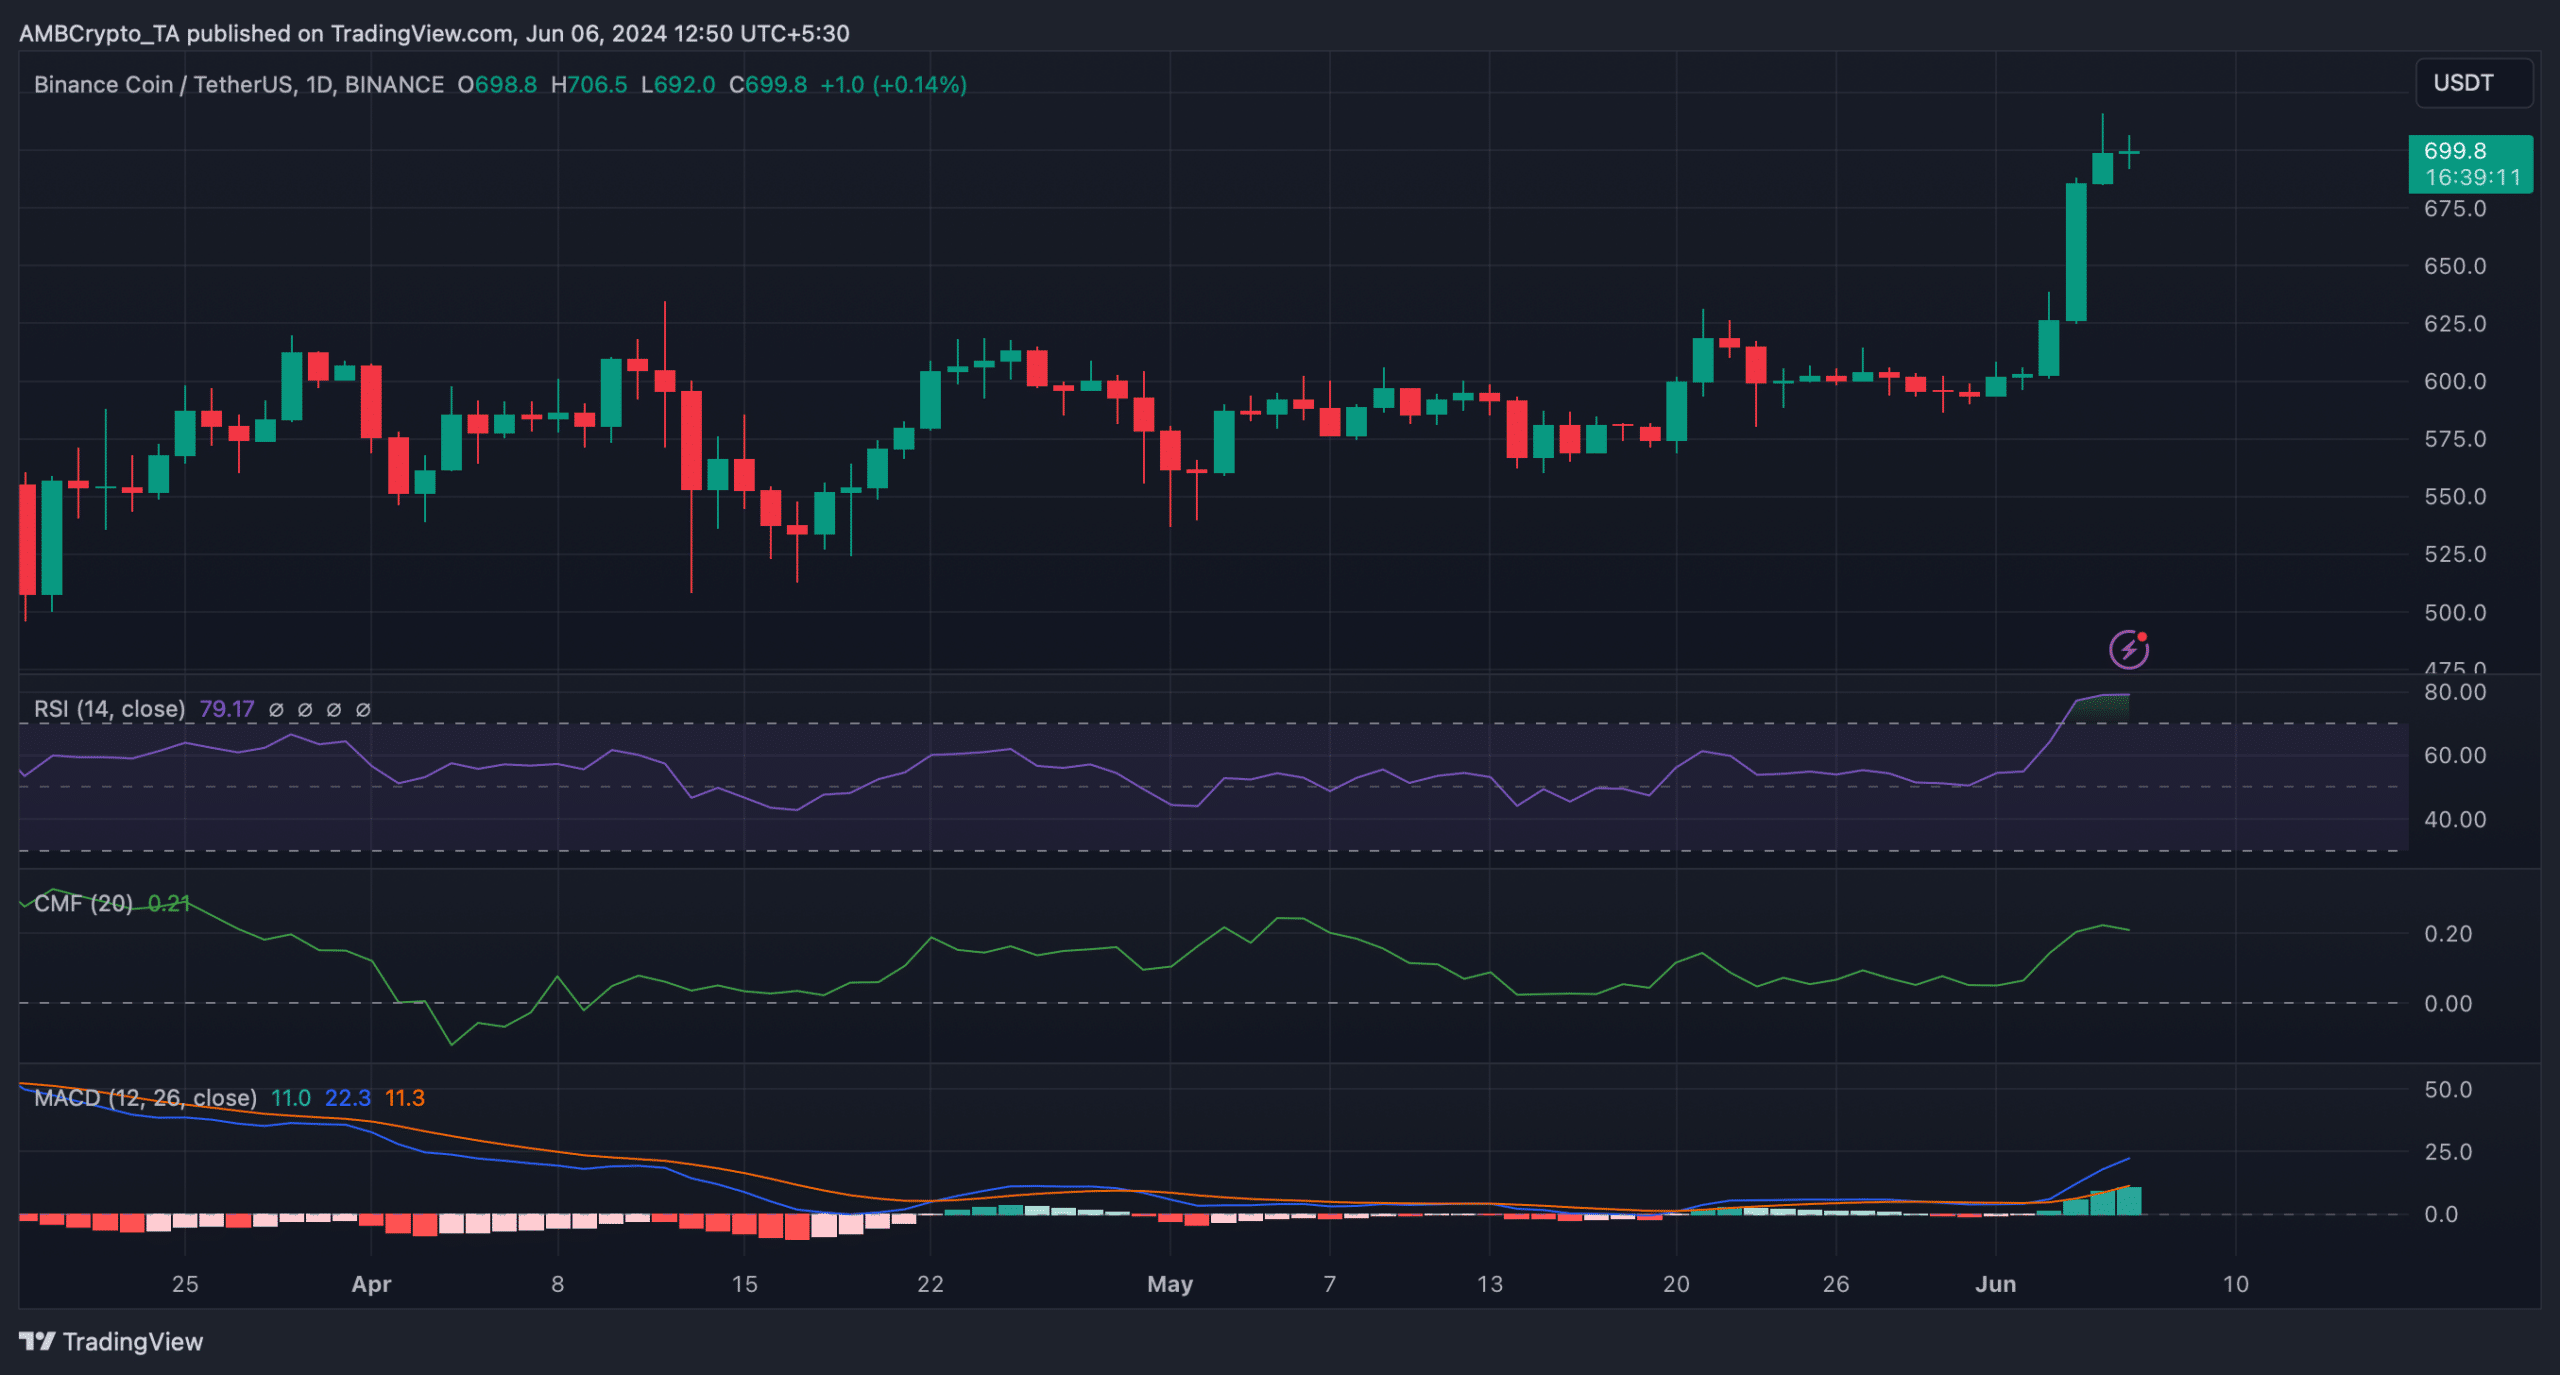
Source: TradingView
As per our analysis, BNB’s Relative Strength Index (RSI) was in the overbought zone. This might increase selling pressure and, in turn, push the coin’s price down.
The Chaikin Money Flow (CMF) also turned bearish as it registered a downtick.
Read Binance (BNB) Price Prediction 2024-25
Nonetheless, the MACD displayed a bullish advantage in the market.
If BNB turns bearish, then investors might witness the coin’s price drop to $687, as liquidation would rise sharply at that level.
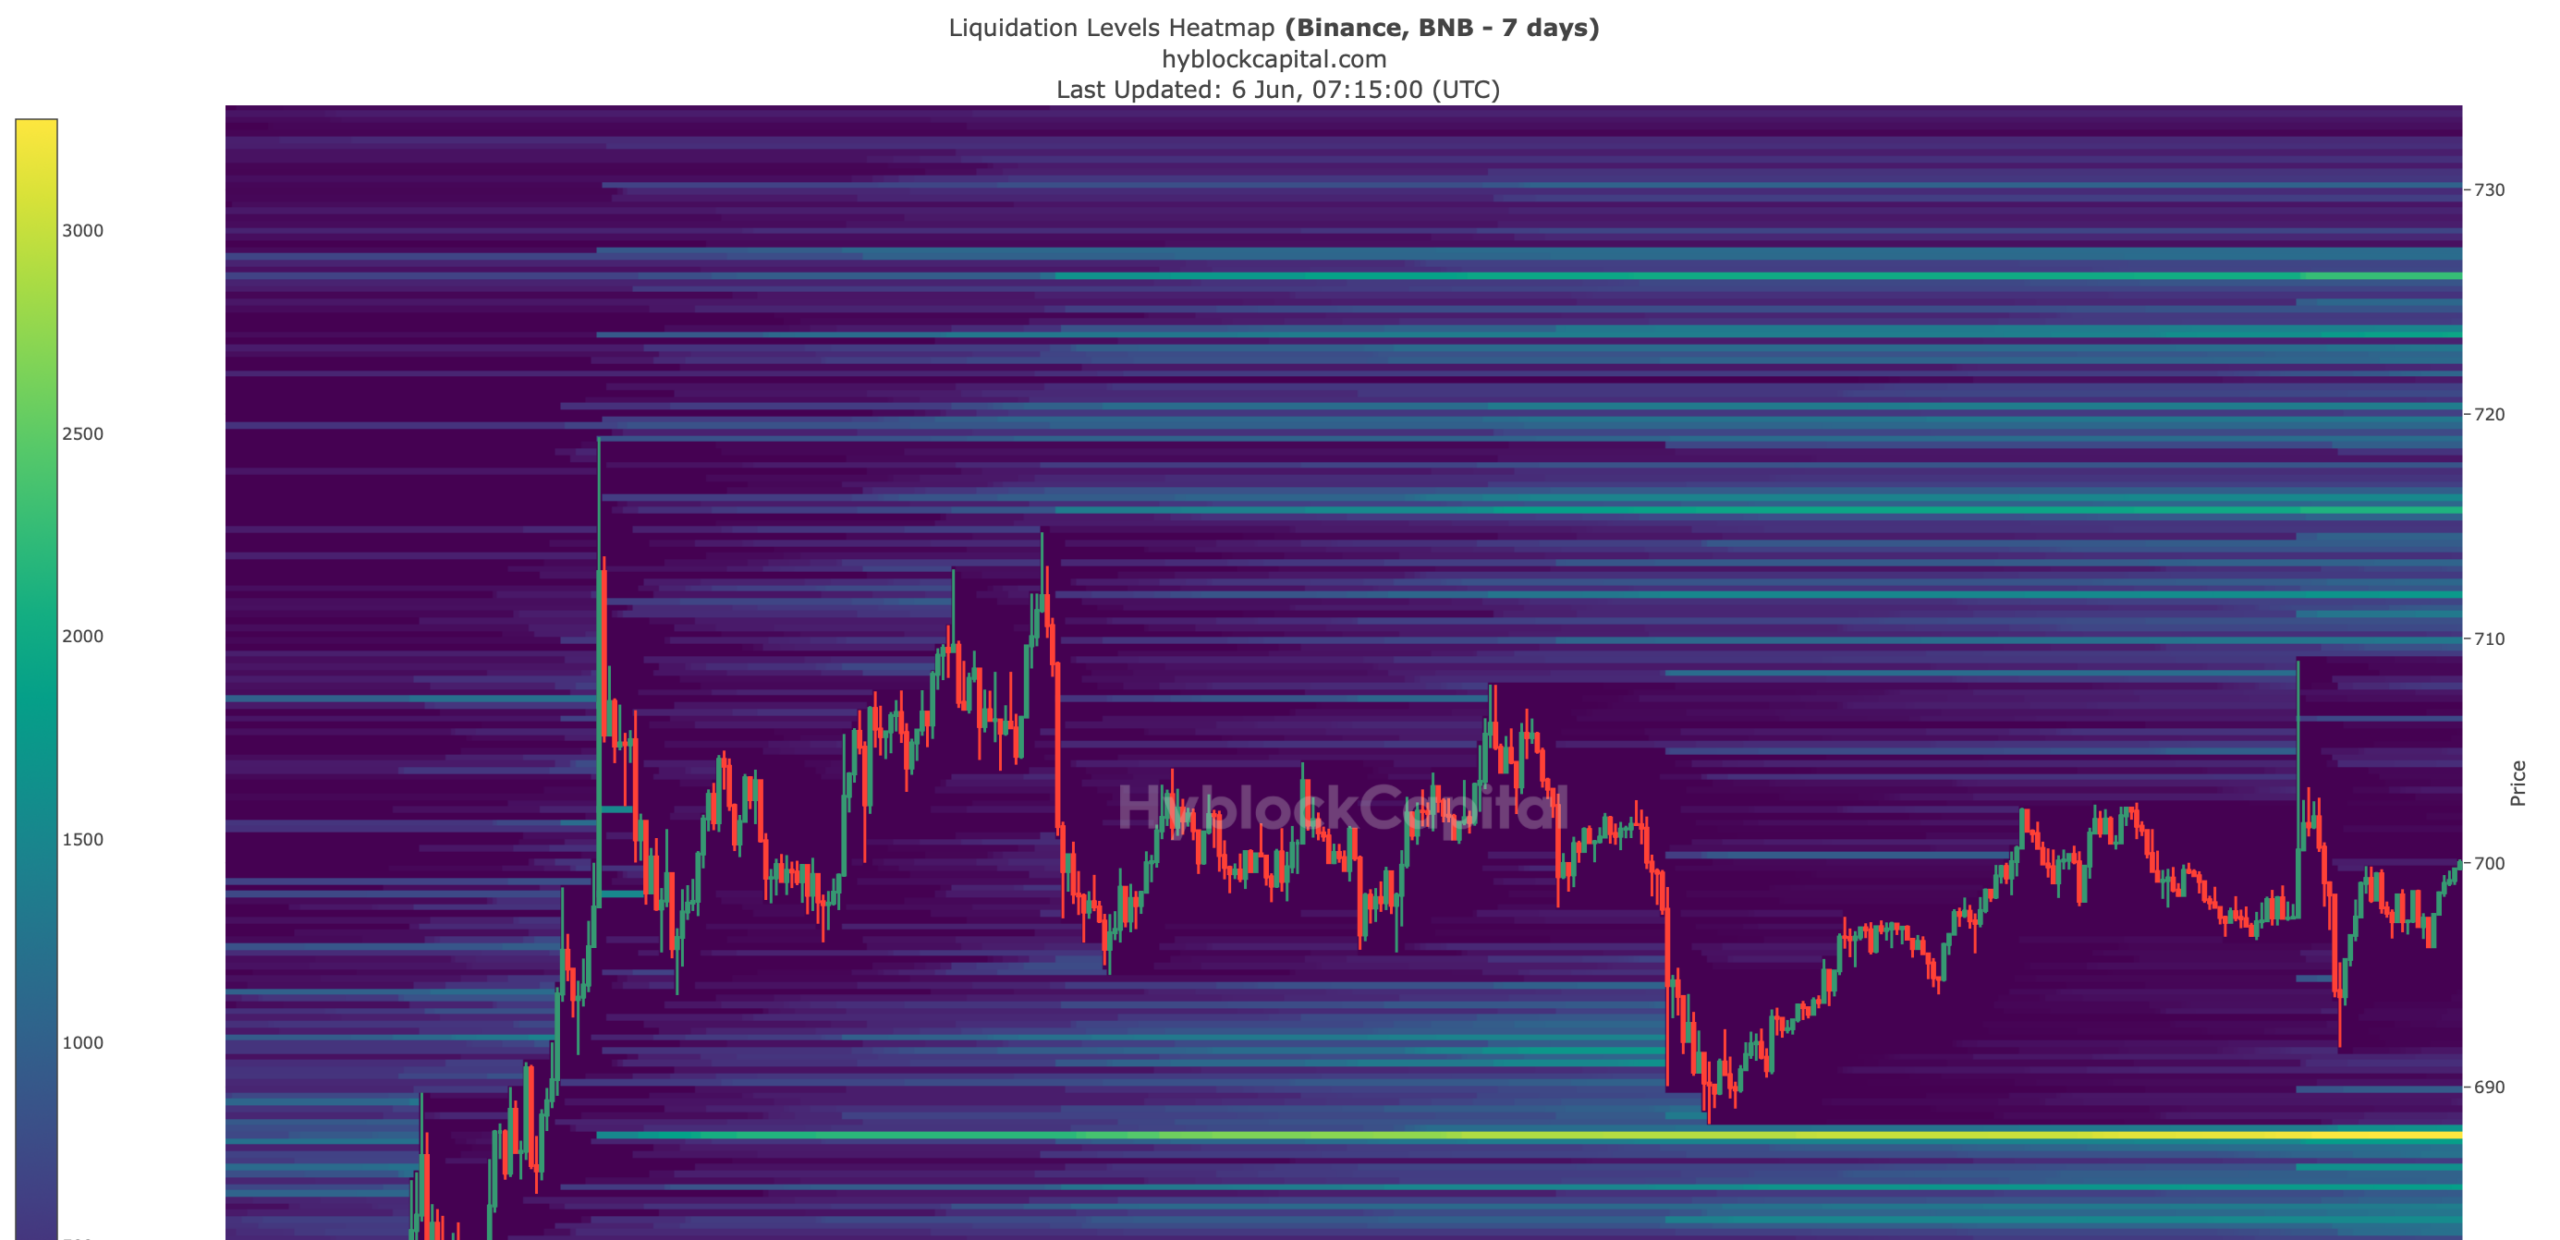
Source: Hyblock Capital