All about the state of Ethereum after Bitcoin’s halving

- Ethereum sees more outflow but fewer new stakes.
- ETH continued its recovery post-BTC halving.
As the Bitcoin [BTC] halving approached, altcoins experienced a price decline. Analysis indicated that Ethereum was among the assets that witnessed substantial recovery following the halving.
However, the recovery of ETH staking remained elusive.
Ethereum daily staking drops
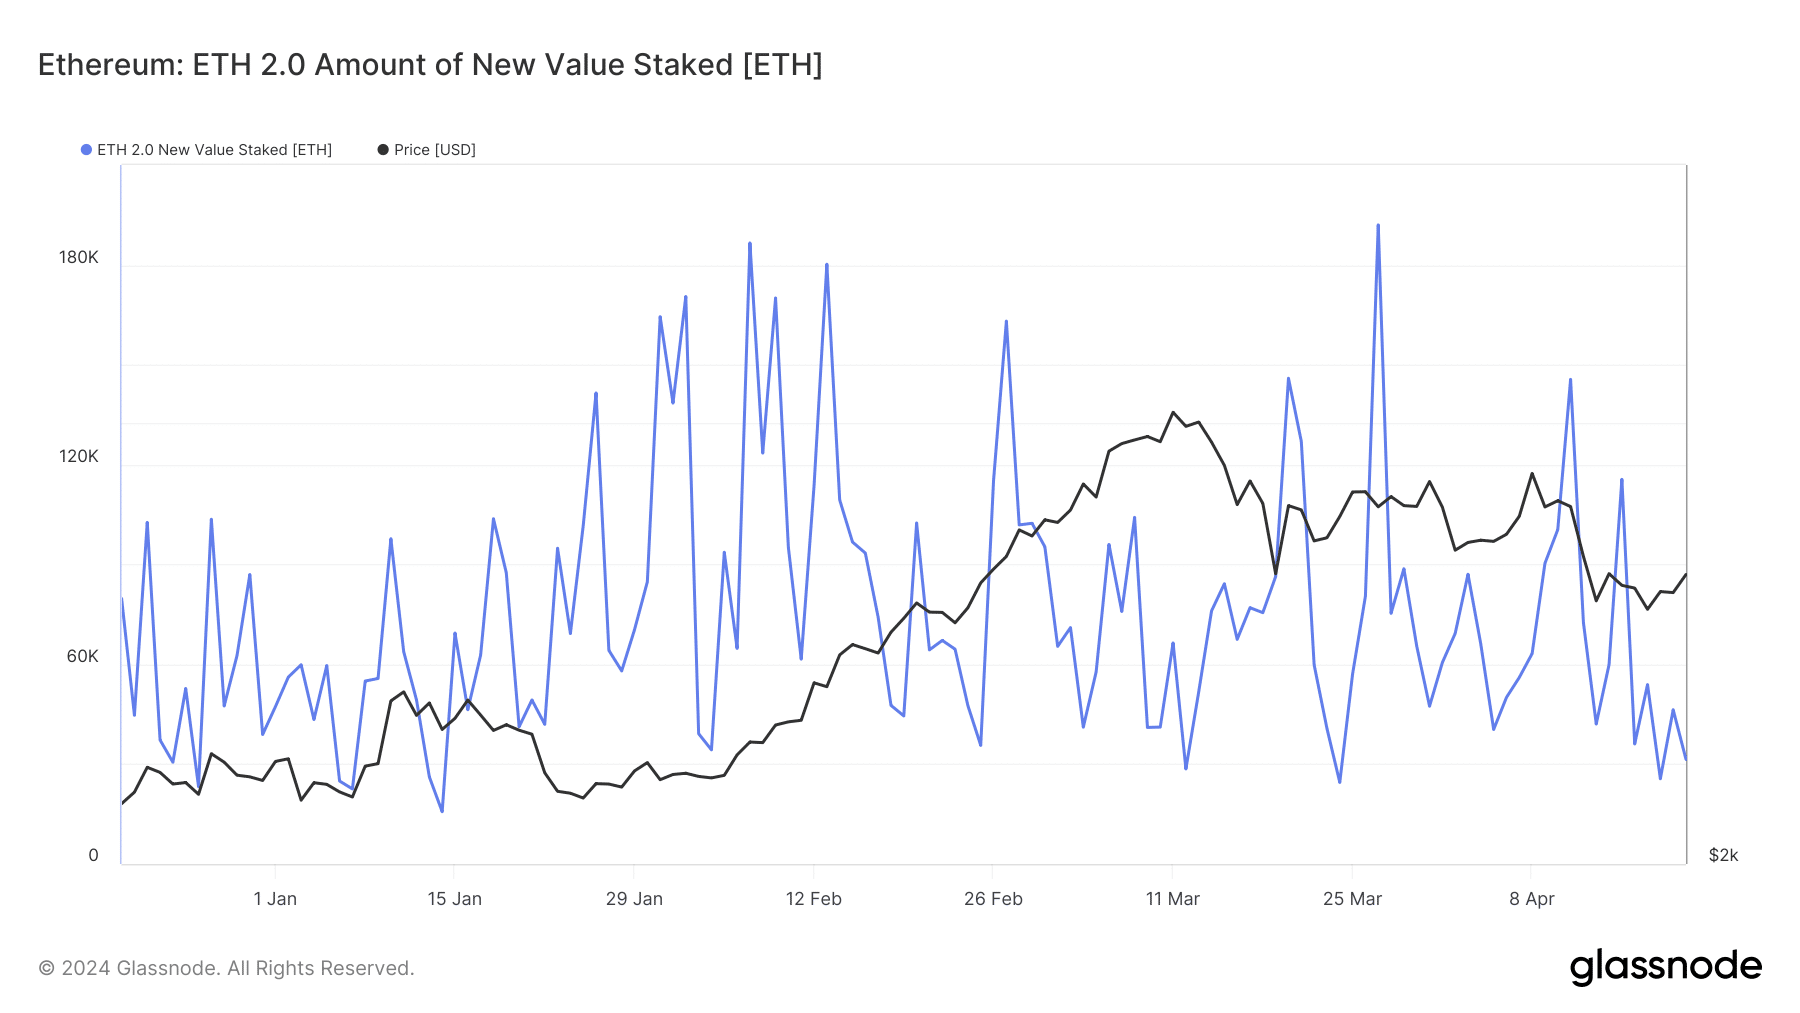
AMBCrypto’s examination of Ethereum’s staking chart showed a significant downturn in the volume of new stakes over the past few days.
The chart indicated that at the beginning of the previous week, there was an uptick in the volume of staked ETH, peaking at over 115,000 by the 15th of April. However, this volume began to decline.
At the time of this writing, the volume of new stakes was 31,441, marking a decline of over 80,000.
Though not the lowest daily figure recorded for ETH, if this decline persists, it could set a new record low. Additionally, the total ETH staked surpassed 43.9 million at press time.
Despite an overall increase, a detailed analysis of the chart suggests that the progression has been nearly stagnant, indicating a lack of significant influx in recent times.
Outflows dominate the Ethereum flow trend
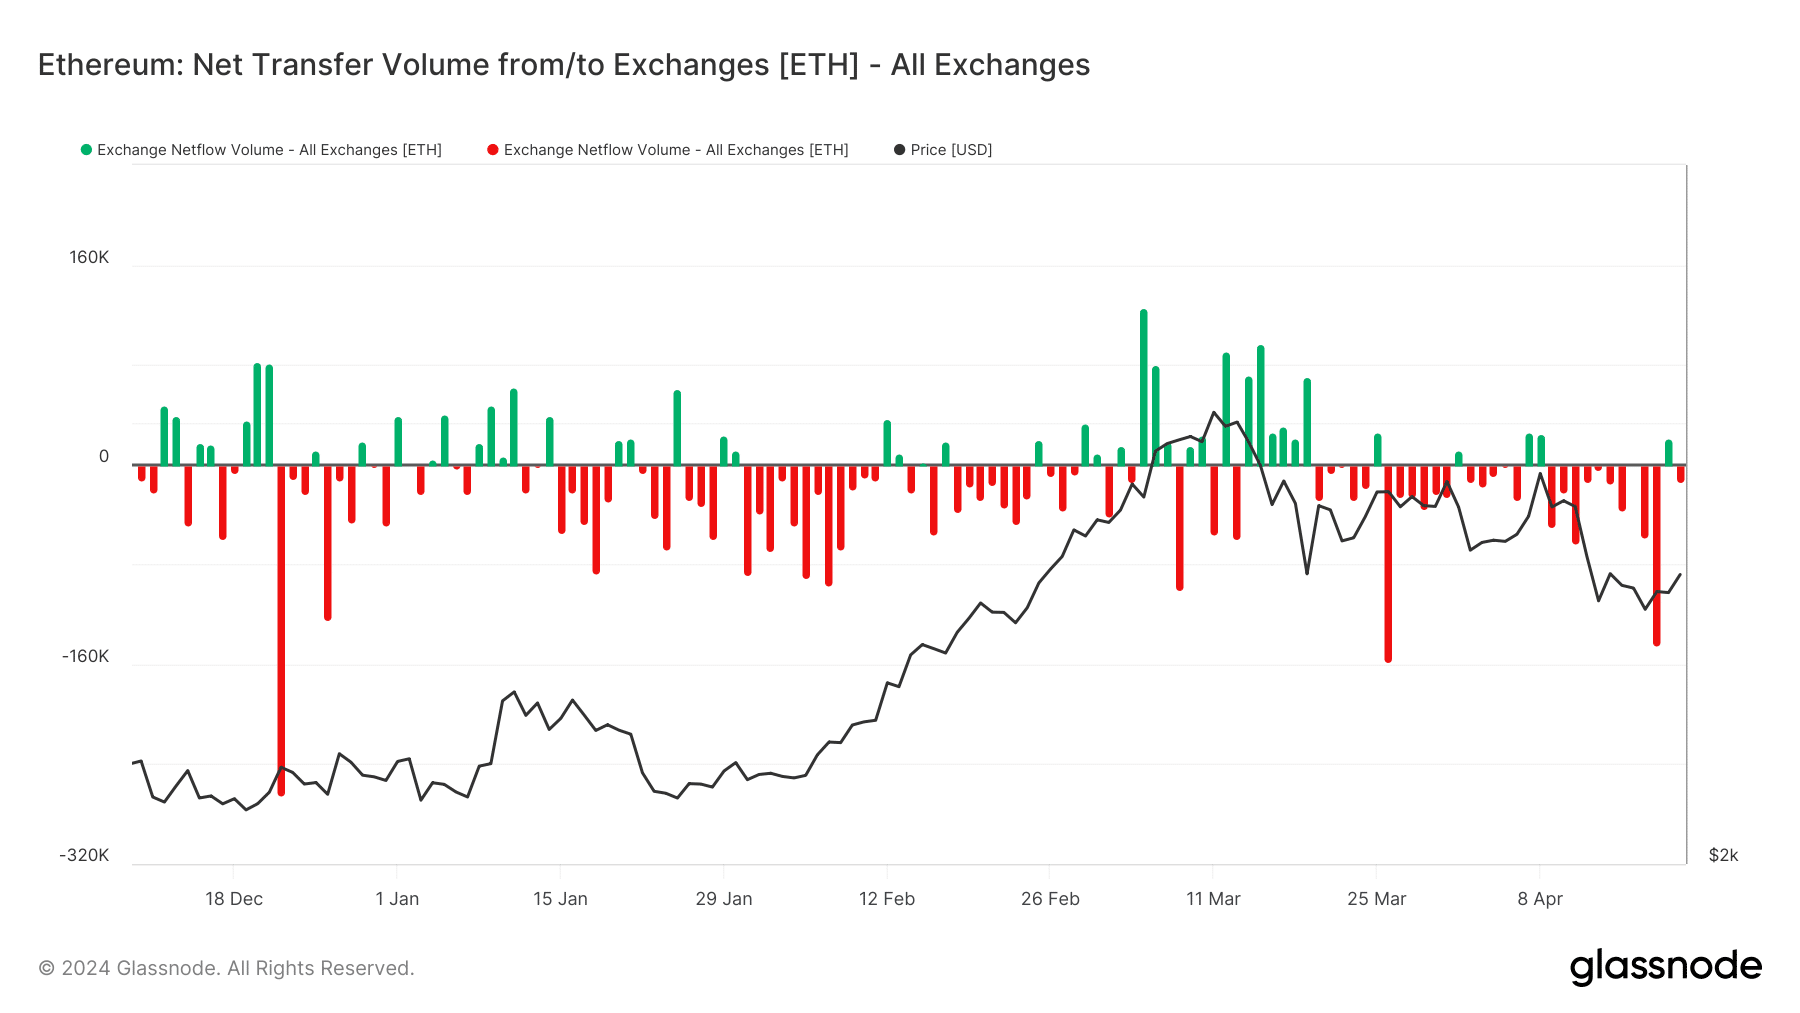
Except for the 20th of April, Ethereum has witnessed more outflows than inflows in recent days.
AMBCrypto’s analysis of the Netflow chart on Glassnode revealed that by the end of the date, ETH experienced an inflow of over 20,000, significantly lower than the volume of outflow.
On the 18th of April, ETH encountered an outflow exceeding 144,800, marking one of the largest outflows recently.
At the time of writing, over 14,000 outflows had been recorded, indicating a trend where more ETH is leaving exchanges.
Based on the trajectory of the staking chart, it’s evident that most of the withdrawn ETH is not being staked. This presented a positive indicator for the asset, suggesting that holders anticipated a price increase.
This sentiment was particularly strong given the recent Bitcoin halving, fostering beliefs that a rally may commence.
ETH remains in bear trend
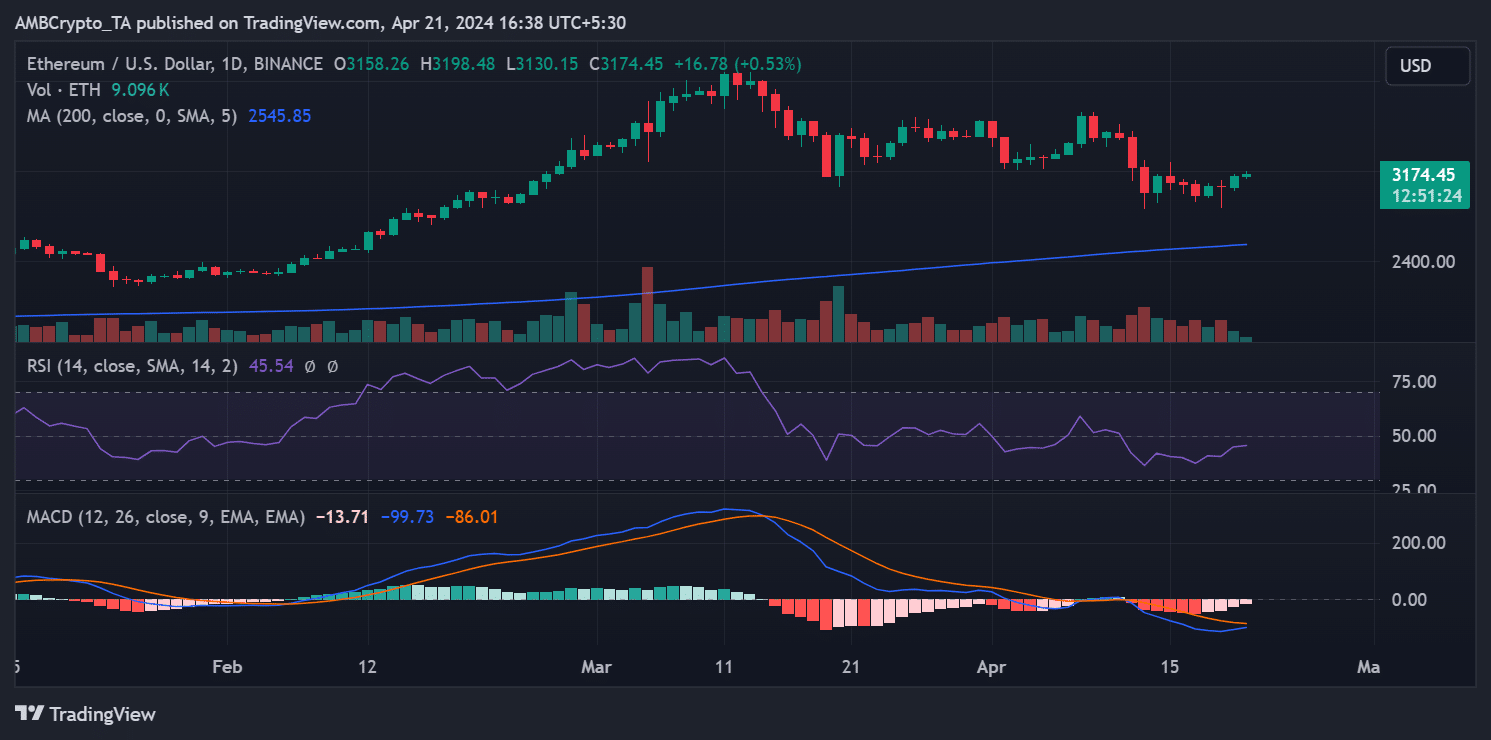
AMBCrypto’s look at Ethereum on the daily timeframe revealed a positive conclusion to the week. ETH experienced a more than 3% increase, reaching approximately $3,157 by week’s end.
Read Ethereum’s [ETH] Price Prediction 2024-25
It commenced the week near $3,158 but faced several days of declines after that. At the time of this writing, it was trading at around $3,177, with a rise of less than 1%.
Its Relative Strength Index (RSI) indicated that it dipped below the neutral line on the 11th of April. At the time of this writing, it remained below this line, though there was a noticeable improvement.


