- Solana dominated Ethereum on the network speed front
- SOL’s price appreciated by over 3% in the last 24 hours
Solana [SOL] has been popular for many years now because of its robust network activity. The blockchain is in the news again today after one of its key metrics hit a milestone, clearly highlighting the dependability and efficiency of the blockchain.
And, while that happened, the altcoin’s price action also turned bullish on the charts.
Solana gets faster than the rest
SolanaFloor, a popular X handle that shares updates related to the blockchain’s ecosystem, recently posted a tweet highlighting this new development. According to the same, Solana’s true transactions per second exceeded 1k as it hit 1005.
This clearly reflected the effectiveness of the blockchain and how fast it is. To put it into perspective, AMBCrypto took a look at SOL and Ethereum’s [ETH] stats. On the one hand, SOL’s maximum recorded TPS exceeded 7k, while ETH’s number stood at 62 tx/s. Similarly, SOL also heavily dominated ETH in terms of real-time TPS.

Source: Chainspect
AMBCrypto then took a look at Artemis’ data to better understand the blockchain’s network activity. As per our analysis, Solana’s daily transactions gained some momentum last month.
At press time, the figure stood at 47.3 million. However, despite the rise in transactions, the blockchain’s daily active addresses didn’t grow much last month. On the captured value front too, not everything looked good. This was the case, as both its fees and revenue dropped over the last few weeks.

Source: Artemis
A bullish turn on the charts
In the meantime, Solana’s bulls stepped up their game as they managed to paint SOL’s daily and weekly charts green.
According to CoinMarketCap, SOL hiked by over 3% in just 24 hours. At the time of writing, Solana was trading at $139.89 with a market capitalization of over $64 billion, making it the fifth largest crypto.
We then checked SOL’s on-chain data to find out whether this newly gained bullish momentum would last. We found that SOL’s trading volume dropped over the past week while its price rose. This is generally perceived as a bearish signal. Its open interest also moved sideways, indicating a few slow-moving days.
Additionally, it was surprising to see a drop in SOL’s weighted sentiment, as it pointed to the dominance of bearish sentiment across the crypto’s market.
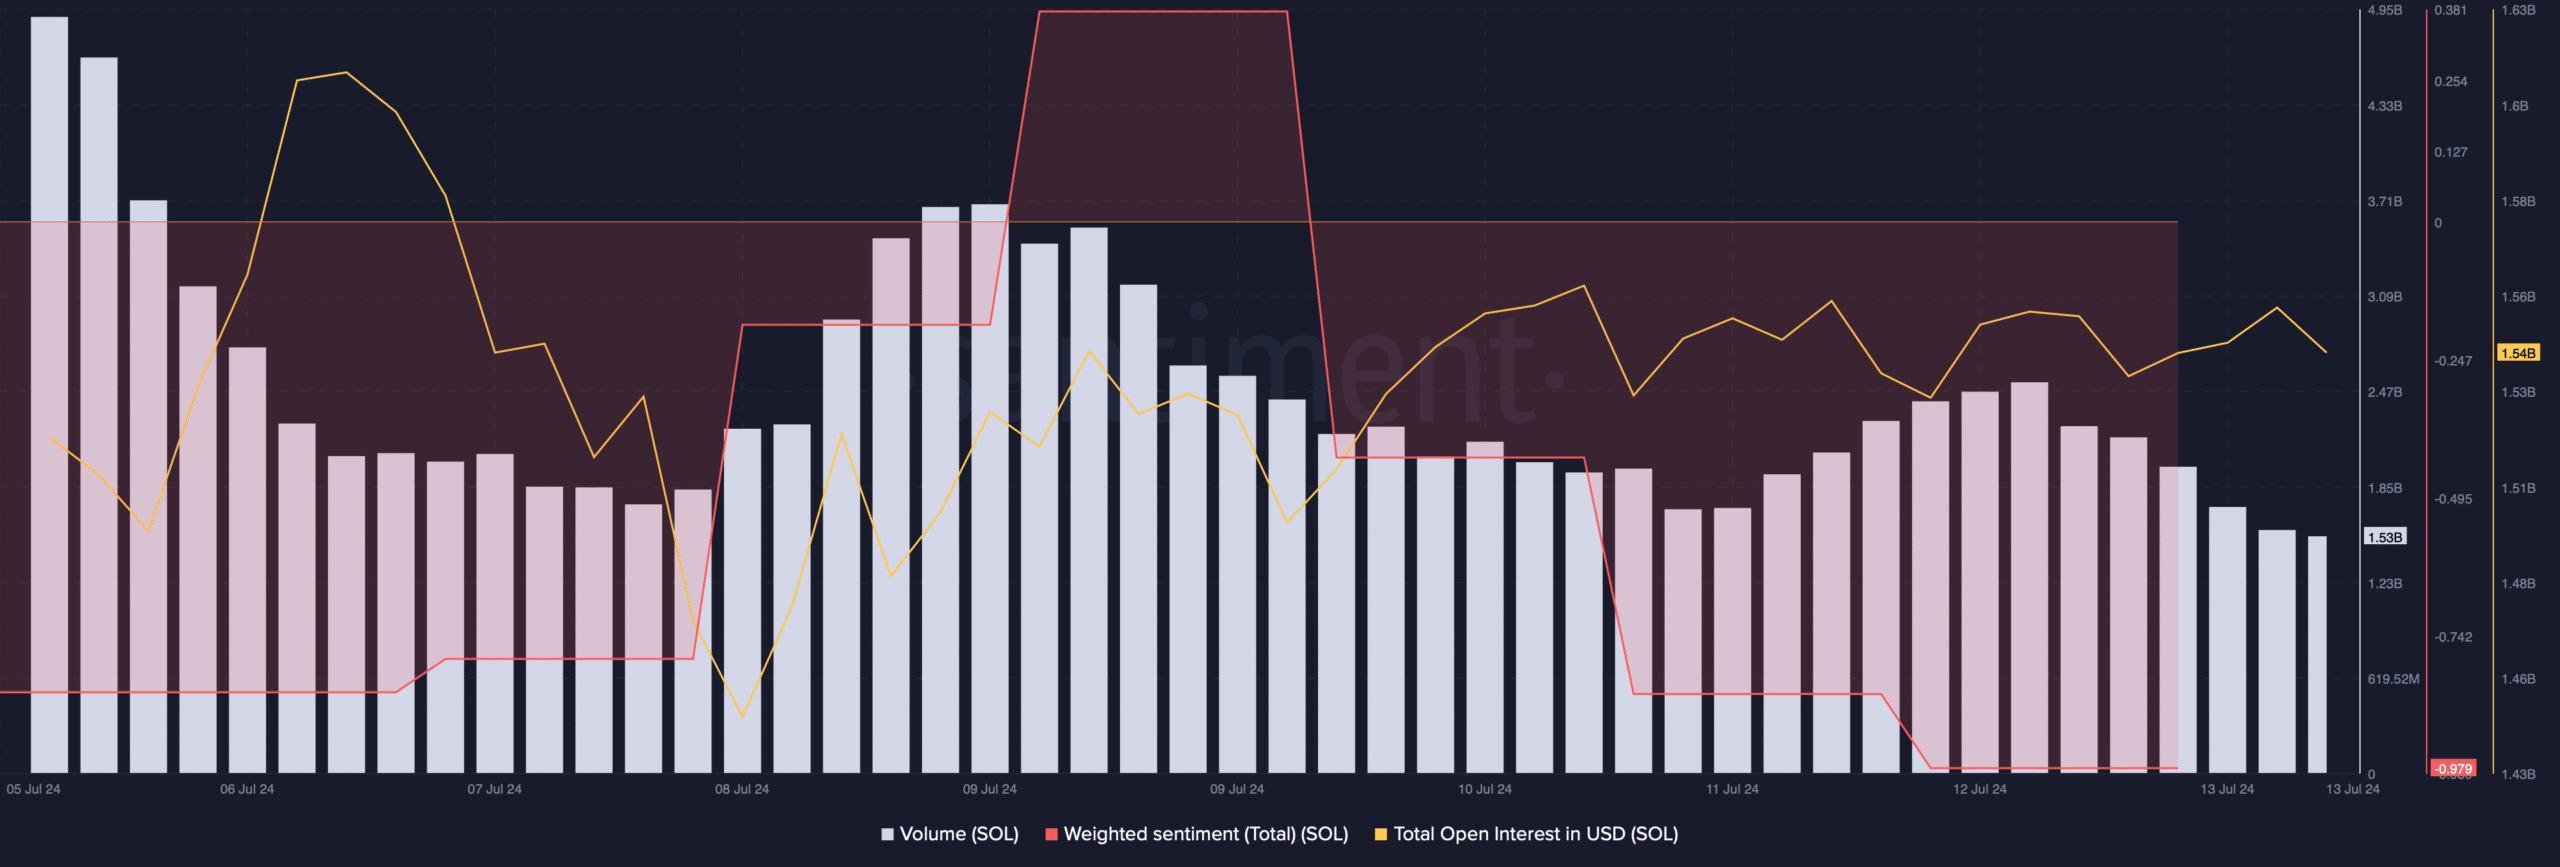
Source: Santiment
Nonetheless, most technical indicators remained bullish on the charts.
For instance, both the Relative Strength Index (RSI) and Chaikin Money Flow (CMF) registered upticks. The MACD flashed a clear bullish advantage in the market, underlining the high chances of SOL gaining again.
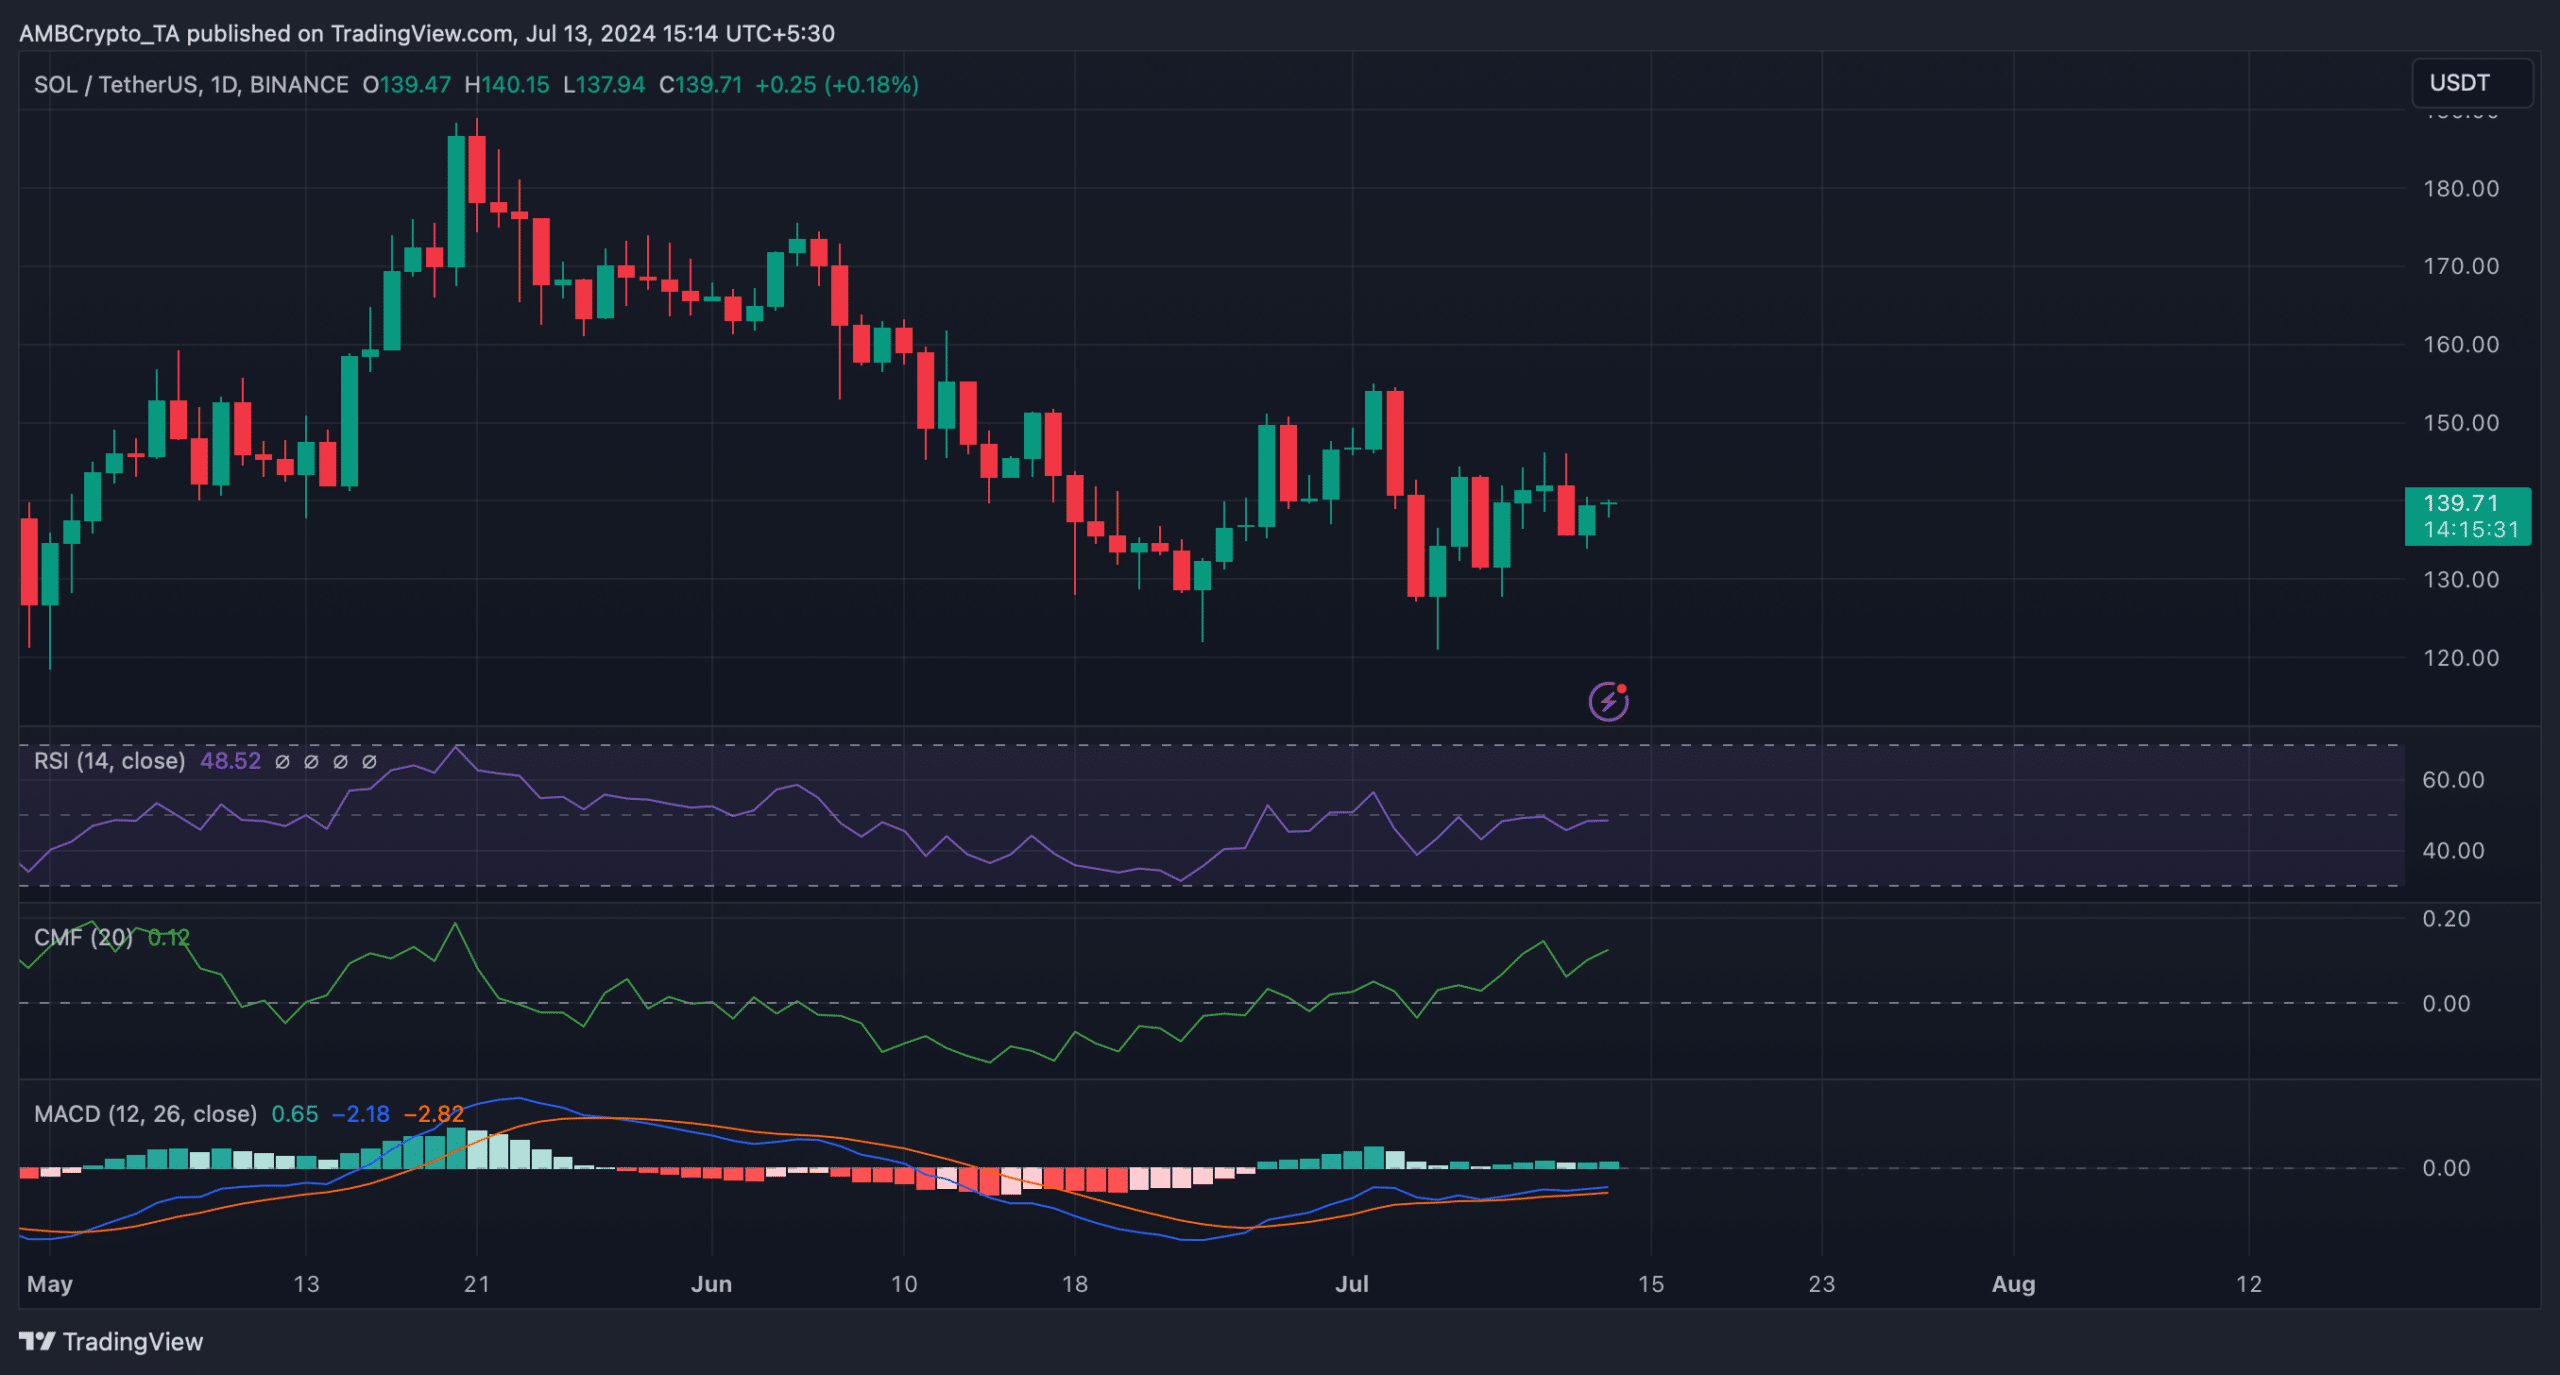
Source: TradingView
Is your portfolio green? Check out the SOL Profit Calculator
If the bull rally continues, investors might soon seen SOL touch $147.4 in a few days as liquidations would rise at that level.
However, if a bearish takeover happens, then SOL might fall to $133 in the coming days.

Source: Hyblock Capital