Altcoin season indicator: Do the signs point to an altcoin wave?
A strong downtrend in the Bitcoin Dominance chart is necessary for a true altcoin season to commence.

- The strong Bitcoin ETF inflows could spark the next upward price move.
- Altcoins could follow BTC gains, but might struggle to outperform the king anytime soon.
Bitcoin [BTC] could break free of its torpor soon. At the beginning of this week, the price was at $67.7k, and the lack of trading volume and speculative interest suggested that BTC was not ready for a strong uptrend.
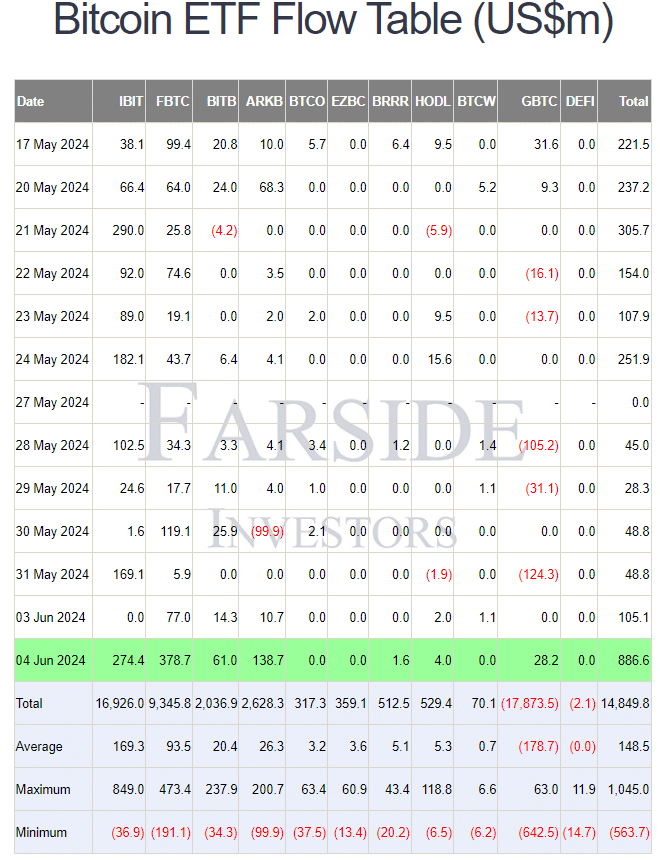
This has begun to shift over the past 24 hours. Data from Farside Investors showed that the Bitcoin exchange-traded funds saw a $886 million inflow on Tuesday, the 4th of June.
This level of buying could spark a change and stir speculators and investors into action.
Will the increased attention to Bitcoin see altcoin prices explode? Or will the altcoin season have to wait? Here are the findings from the altcoin season indicator.
How close are we to the altcoin season?
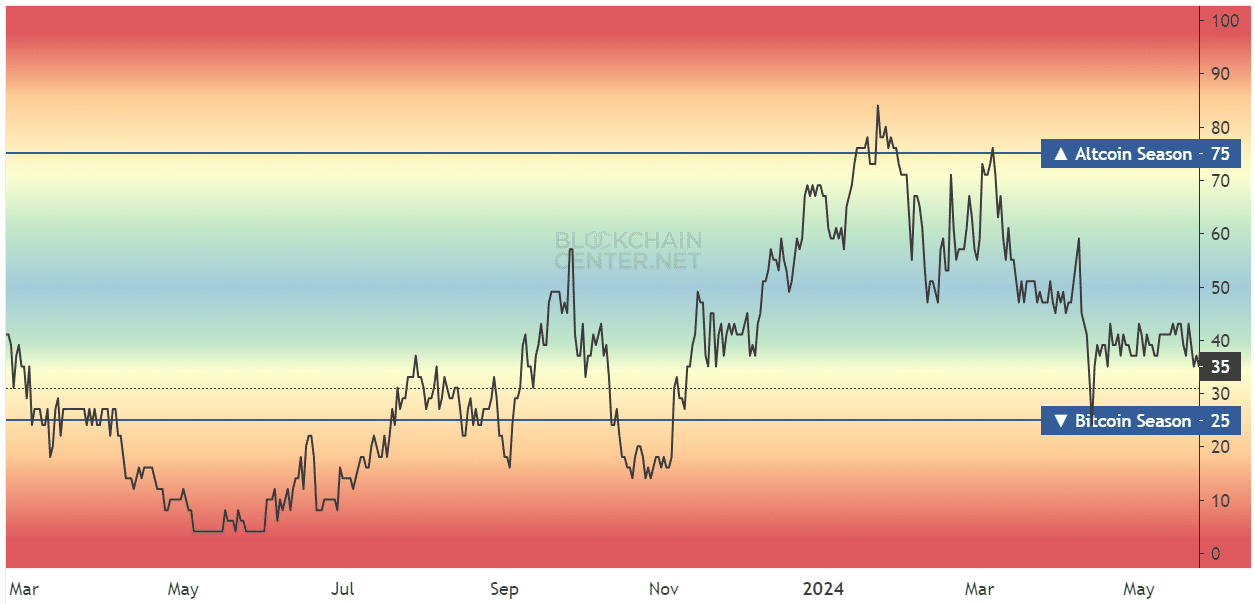
The altcoin season index showed a reading of 31, according to data from BlockchainCentre. The index has trended downward from 80 to 31 over the past six months.
A year ago, the index showed strong BTC season.
However that was during the depths of the bear market, when Bitcoin was trading at $25k and alts were in a long-term downtrend or consolidation phase.
At press time, even though alts might perform well due to the Bitcoin bullish fervor, only a few select alts might outperform Bitcoin.
If the altcoin season indicator can climb above 75, it’d be a sign of wild bullishness across the altcoin ecosystem.
Given that there are far more alts right now compared the previous cycles, the gains during an altseason might still be concentrated within a chunk of the alts rather than market-wide rallies.
The range-bound Bitcoin Dominance and parallels from the past
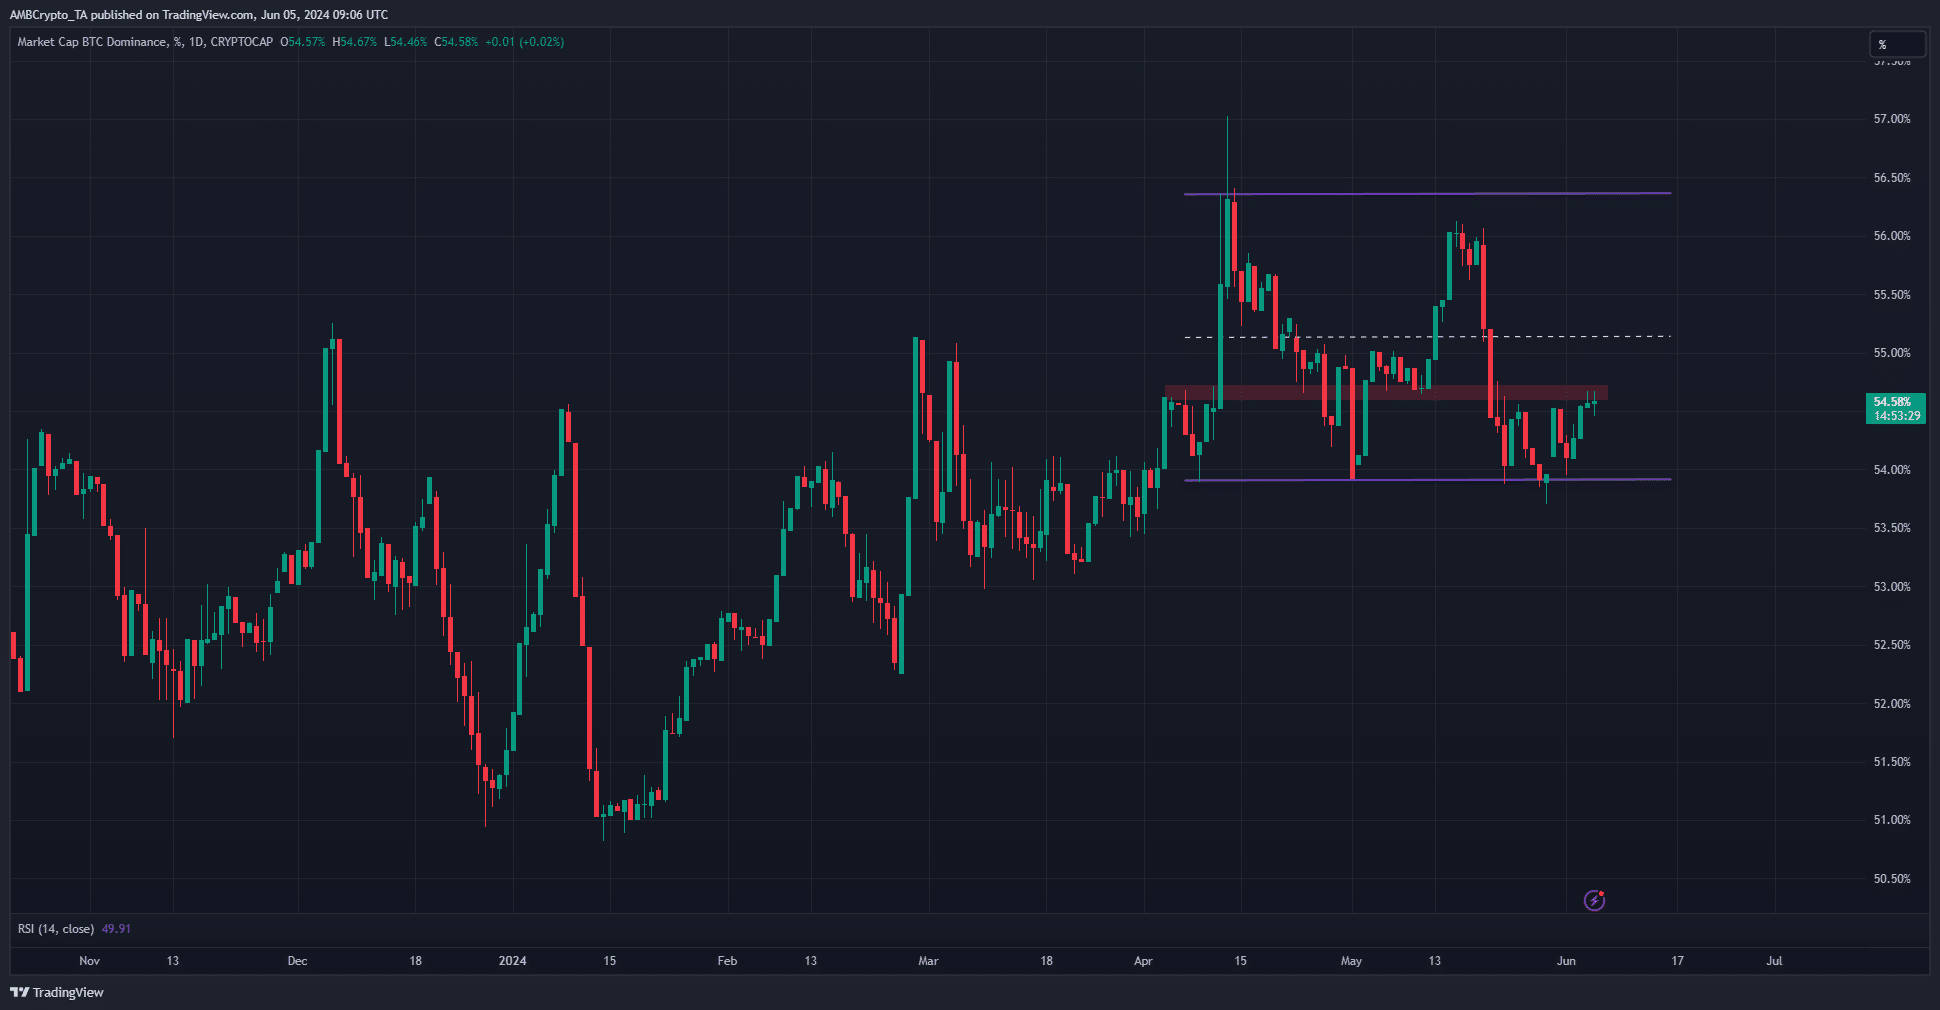
The Bitcoin Dominance chart represents the market capitalization of BTC as a percentage of the total crypto market cap. The metric formed a range between 53.9% and 56.3% since April.
At press time, it was rebounding from the range lows. An increase in the BTC.D means BTC is growing faster than the rest of the market, Ethereum [ETH] included.
Is your portfolio green? Check the Bitcoin Profit Calculator
In 2021, from January to June, the BTC dominance fell from 72% to 40.4%. In this window, the altcoin market capitalization (excluding ETH) expanded from $122 billion to $934 billion.
Therefore, a strong downtrend in the BTC.D chart is necessary for a true altcoin season to commence.