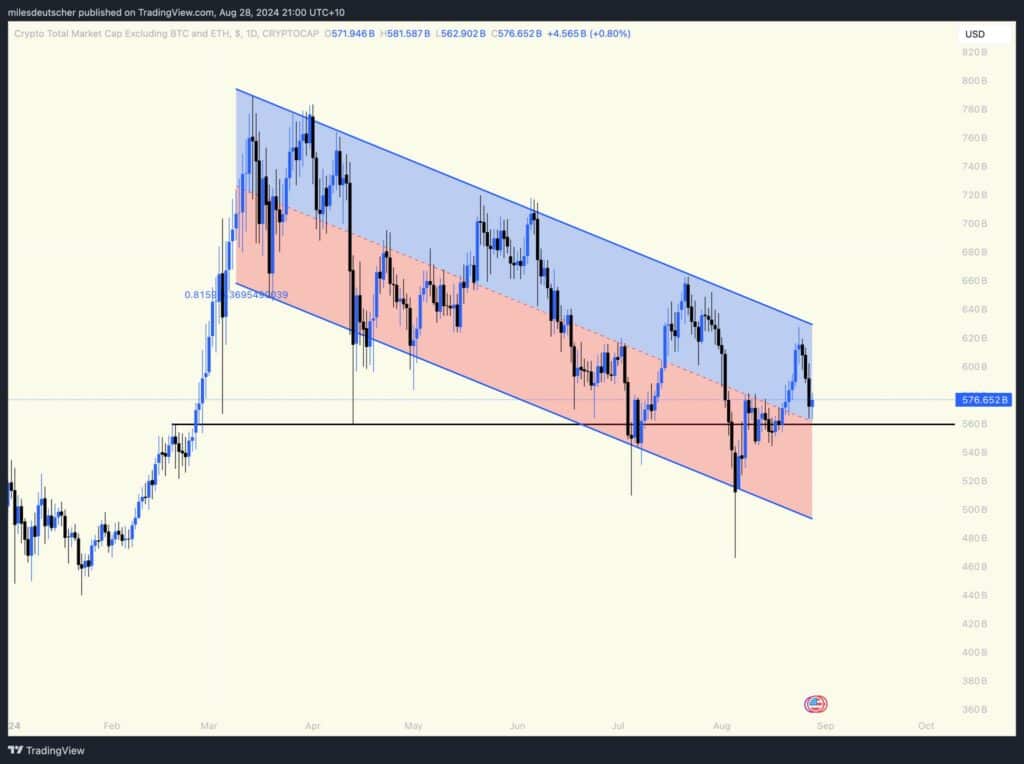
Altcoins set to breakout? Why this is the perfect time to buy

- The TOTAL3 (altcoin index) chart was navigating a regression channel, often a precursor to a significant rally.
- Market analysts have identified two prime scenarios for purchasing these alternative cryptocurrencies, based on this pattern.
As of press time, the crypto ecosystem’s total market capitalization stood at $2.2 trillion, marking a 1.02% increase in the last 24 hours. Despite this growth, trading volume experienced a decline, falling by 6.53% to $82.56 billion.
Altcoins have played a big role in these developments, calling attention to their importance for investors. This influence, captured in the TOTAL3 chart, pointed to the best times to enter the market.
Strategic buying times for altcoins
Using the TOTAL3 chart—a tool that represents the market capitalization of all cryptocurrencies excluding Bitcoin [BTC]—crypto analyst Miles Deutscher identified that the altcoin index was in a downtrend regression channel.
A downtrend regression channel is a technical analysis tool used to delineate a downward price trend.
It features a central regression line that indicates the average trend, flanked by parallel resistance (above) and support (below) lines, which establish the price boundaries.
Historically, such patterns often precede a breakout above the upper resistance line, potentially signaling a new price high.
However, Deutscher advised caution, stating,
“No reason to get excited until we clear the top of the channel (fresh higher high to break structure).”
Solana to establish dominance
Solana has been one of the altcoins that have shown impressive resilience in the market. Trading at $144.79 at press time, it has surged by 614.36% over the past year, even outside a traditional crypto bull market.
Despite a recent dip in buying momentum—down by 24.51% over the last month—AMBCrypto found that SOL was charting an ascending channel. This pattern often signals an upcoming rally.
Read Solana’s [SOL] Price Prediction 2024–2025
An ascending channel suggests gradual but steady growth, marked by higher lows and higher highs.
Should SOL break above this channel or respond positively from its lower boundary, it could ignite a bull market, potentially surpassing its all-time high and cementing its market dominance.


