Analyst: Bitcoin to dip below $60,000 if THIS trend persists
BTC prices dipped over the past week after experiencing a sustained uptrend on monthly charts.

- BTC fell by 6.31% over the past week.
- An analyst noted further downside, citing the Pi Cycle MA.
While October is usually associated with an uptrend, Bitcoin’s [BTC] recent price action has failed to reflect it. As such, BTC has experienced a sharp decline over the past week. In fact, at press time, Bitcoin was trading at $61,436.
This marked a 6.31% decline in weekly charts.
However, the past 24 hours saw a slight recovery on BTC price charts, rising by 0.92%. Also, on monthly charts, Bitcoin has been in an uptrend, hiking by 8.18%.
Therefore, the lack of clear direction with price movement has left the crypto community talking. One of them is the popular crypto analyst Rekt Capital, who suggested that BTC is set for a further downtrend.
A look at the market sentiment
In his analysis, Rekt Capital posited that BTC is continually facing rejection from the PI Cycle MA.
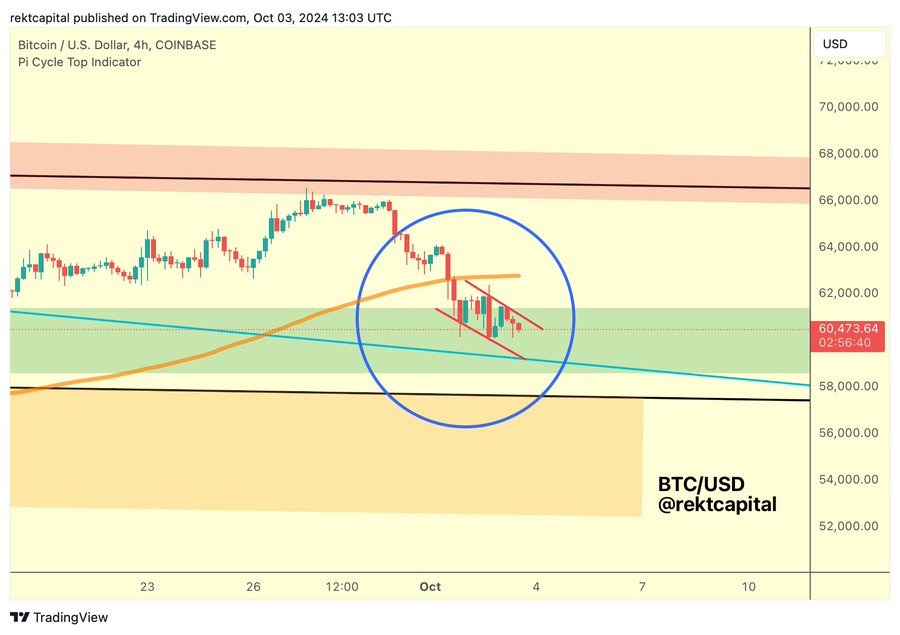
According to this analysis, as long as PI Cycle MA is acting as the resistance, BTC will continue to form a downtrend. Thus, BTC will confirm the downtrend if it tags the light blue downtrend, especially if the current trend persists.
However, the analyst also noted that buyers are starting to accumulate even as the price continues to decline. This was demonstrated by the fact that BTC is starting to form a 4-hour bullish divergence.
In context, repeated rejections from this level indicate that buyers are struggling to push the prices above the resistance.
Therefore, every rejection adds to bearish pressure, highlighting that Bitcoin is currently facing a supply barrier, thus halting its momentum.
Thus, based on this example, BTC is set to experience further decline on its price charts if the current market sentiment persists.
What do BTC charts suggest?
Notably, the analysis above provides a detailed bearish outlook for Bitcoin. However, it’s essential to determine what other market indicators say.
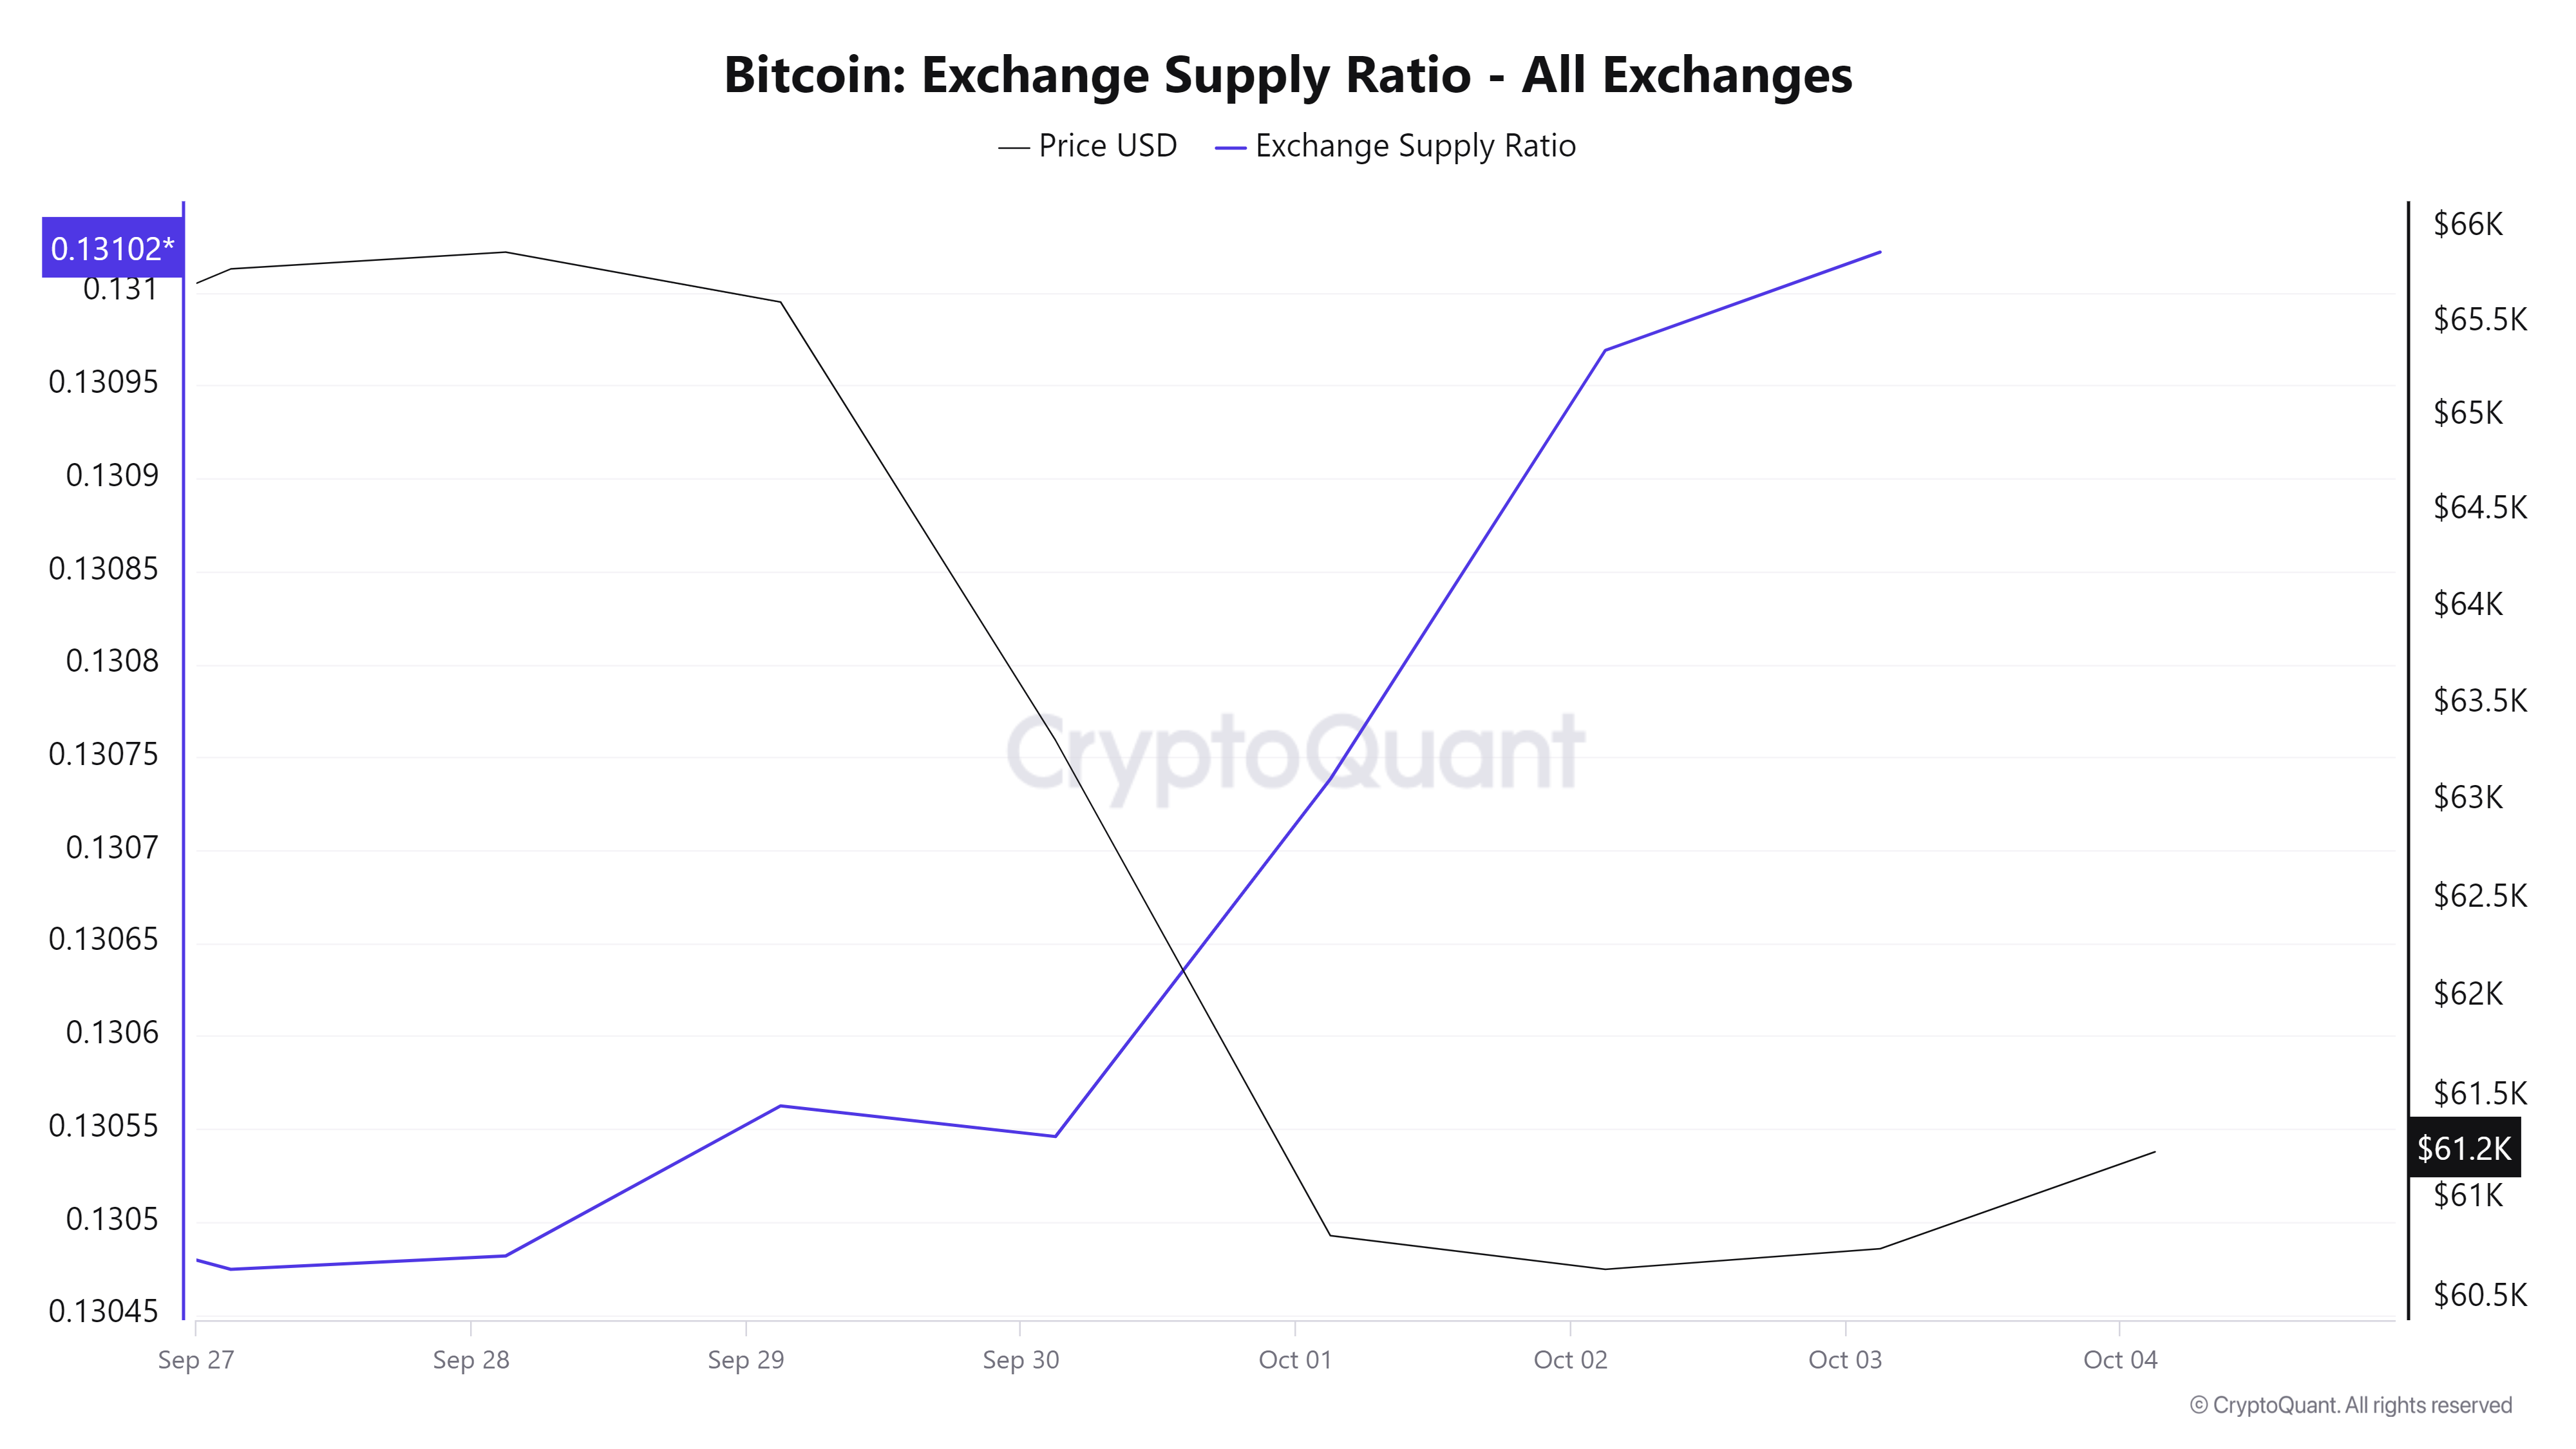
Firstly, Bitcoin’s exchange supply ratio has spiked over the past couple of days, hiking from 0.1304 to 0.131.
The spike in exchange supply implies that investors are depositing their assets into exchanges to sell. Such market behavior causes downward price pressure, especially if selling activities intensify.
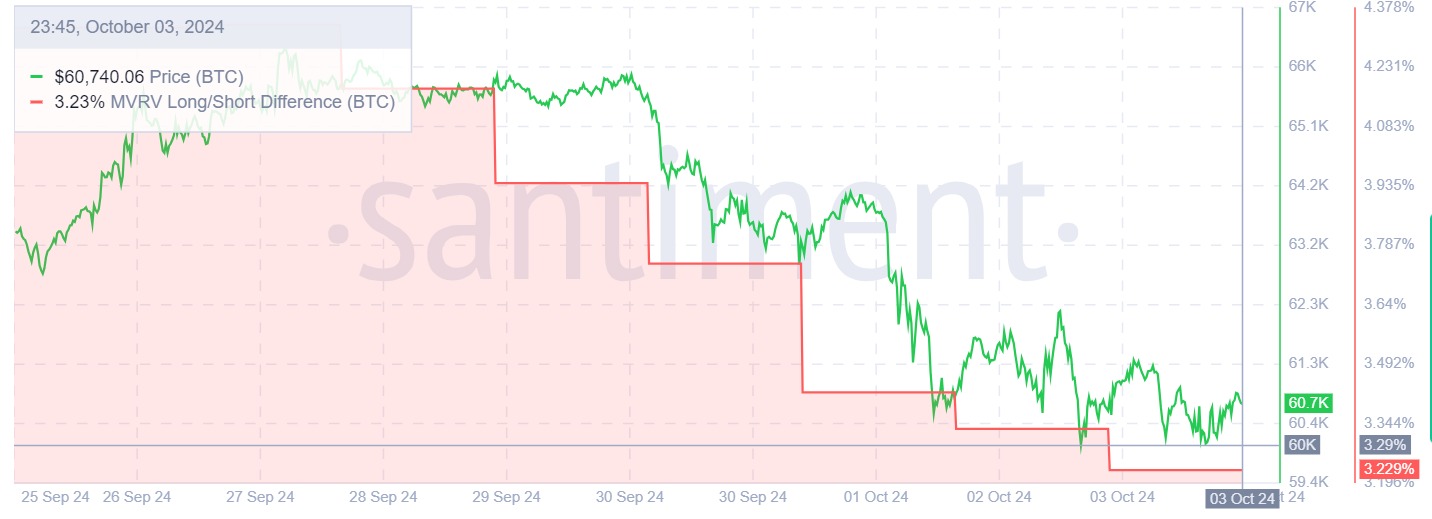
Additionally, Bitcoin’s MVRV Long/Short difference has been declining over the past 7 days, dropping from a high of 4.3% to 3.2%.
This decline signals weaker confidence among long-term holders as their profitability margins decline. The shift suggests bearish sentiment as long-term holders are less incentivized to hold their positions.
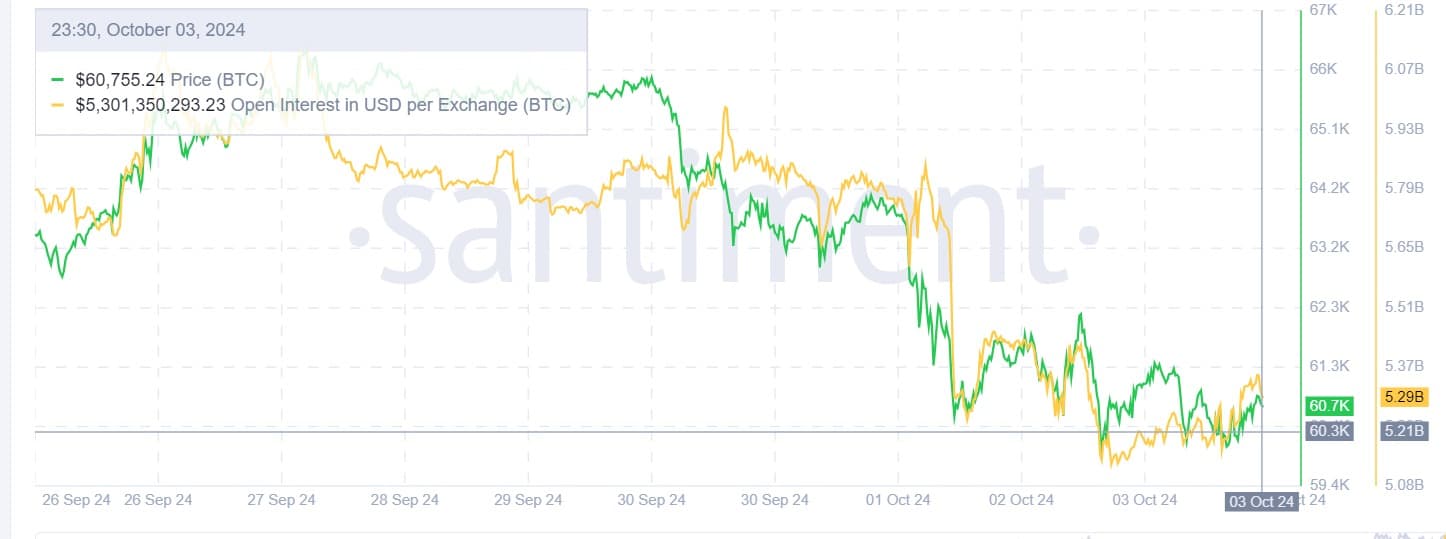
Further, this lack of confidence among investors is illustrated by a declining Open Interest(OI) per exchange. OI has dipped from $6.1 billion to $5.2 billion. Such a decline suggests that investors are closing their positions without opening new ones.
Read Bitcoin’s [BTC] Price Prediction 2024–2025
Simply put, the current market sentiment is bearish.
Therefore, if these conditions hold, Bitcoin will find the next support around the $58272 resistance level. Subsequently, a trend reversal will see BTC reclaim $62700.


