Analyzing Bitcoin’s latest price correction – How, why, and what next!
A recent correction has many worried, but should you be?

- Amid the ongoing price correction, whales and institutions have moved Bitcoin worth hundreds of millions
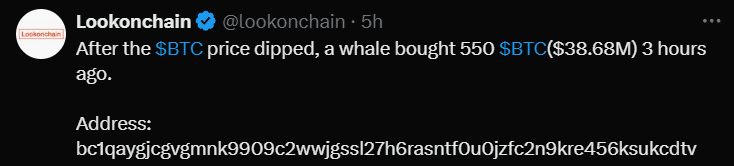
- A crypto whale bought the dip, adding 550 BTC worth $38.68 million
After a notable rally, Bitcoin (BTC), the world’s largest cryptocurrency by market cap, registered a major price correction on the charts. Between 26 – 29 October, the cryptocurrency attracted significant attention owing to its 11% price rally. However, this wasn’t to last.
Will Bitcoin’s price correction continue?
Right now, investors and traders should understand that a price correction after a notable rally is a positive sign for the long term. Especially since it can support a potential price surge in the long term.
Hence, such a price correction may have been expected by some too. In the backdrop of the aforementioned correction, some whales and institutions have also moved assets worth hundreds of millions.
Whales’ and institutions’ recent action
According to the blockchain-based transaction tracker Lookonchain, during the morning hours of the Asian trading session, Mt. Gox’s wallet, which holds nearly 45,000 BTC worth $3.11 billion, transferred 500 BTC worth approximately $35.04 million.

Additionally, another whale bought the dip, adding 550 BTC worth $38.68 million as the price declined to its crucial support level.
Bitcoin technical analysis and key level
According to AMBCrypto’s technical analysis, BTC, at press time, appeared to be retesting its breakout level of $69,235 of the decline channel price action pattern.
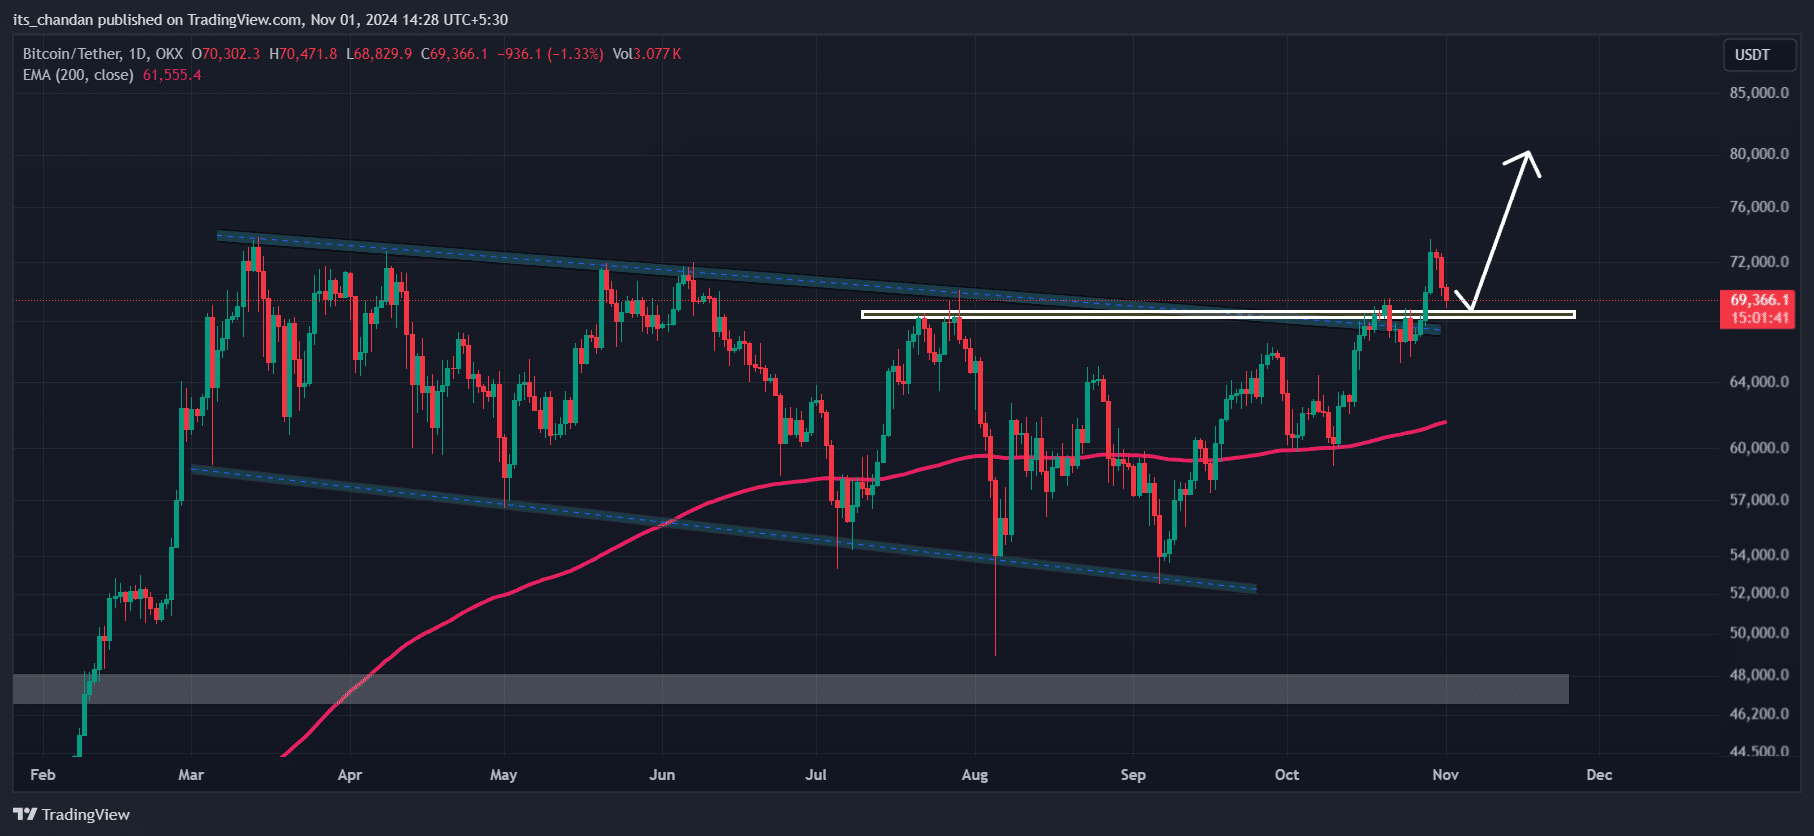
Based on its recent price action and historical momentum, if BTC holds this level, there is a strong possibility it could rally significantly in the coming days. Otherwise, this breakout will be considered a fakeout.
At the time of writing, BTC was trading above the 200 Exponential Moving Average (EMA) on the daily timeframe, indicating an asset trend that is on an uptrend. Meanwhile, its Relative Strength Index (RSI) suggested a potential upside rally, as it remained in the neutral area (neither oversold nor over-bought).
Bullish on-chain metrics
Bitcoin’s positive outlook was further supported by its on-chain metrics. According to the on-chain analytics firm Coinglass, BTC’s Long/Short ratio had a press time value of 1.09, indicating strong bullish sentiment among traders.
Additionally, Open Interest surged by 17% – A sign of growing interest in the asset among traders.


