Analyzing Bitcoin’s price charts – Long-term confidence vs. short-term selling pressure
Short-term whales' P/L metric revealed that recent, large BTC buyers were deep underwater.

- Short-term and medium to long-term metrics revealed differing signals for Bitcoin
- Immediate lack of strength from bulls could push the price below $80k again
Bitcoin [BTC], at the time of writing, was on a downtrend after losing the $92,000-support level in the final week of February. Technical indicators such as the OBV showed that selling pressure has been dominant, meaning more losses may be likely ahead.

In a post on CryptoQuant, analyst Darkfost pointed out that apparent demand has been falling since December. The apparent Bitcoin demand chart compares the new supply to the supply that has been inactive for a year. This chart identifies whether the new BTC is being absorbed into the market due to demand or if there is a lack of buying pressure.
The apparent demand ratio fell below zero towards the end of February, coinciding with the loss of the $92k support. And, it has remained negative since. Hence, AMBCrypto analyzed other metrics to understand holder behavior better.
Bitcoin faces intense short-term bearishness, but HODLers have some hope
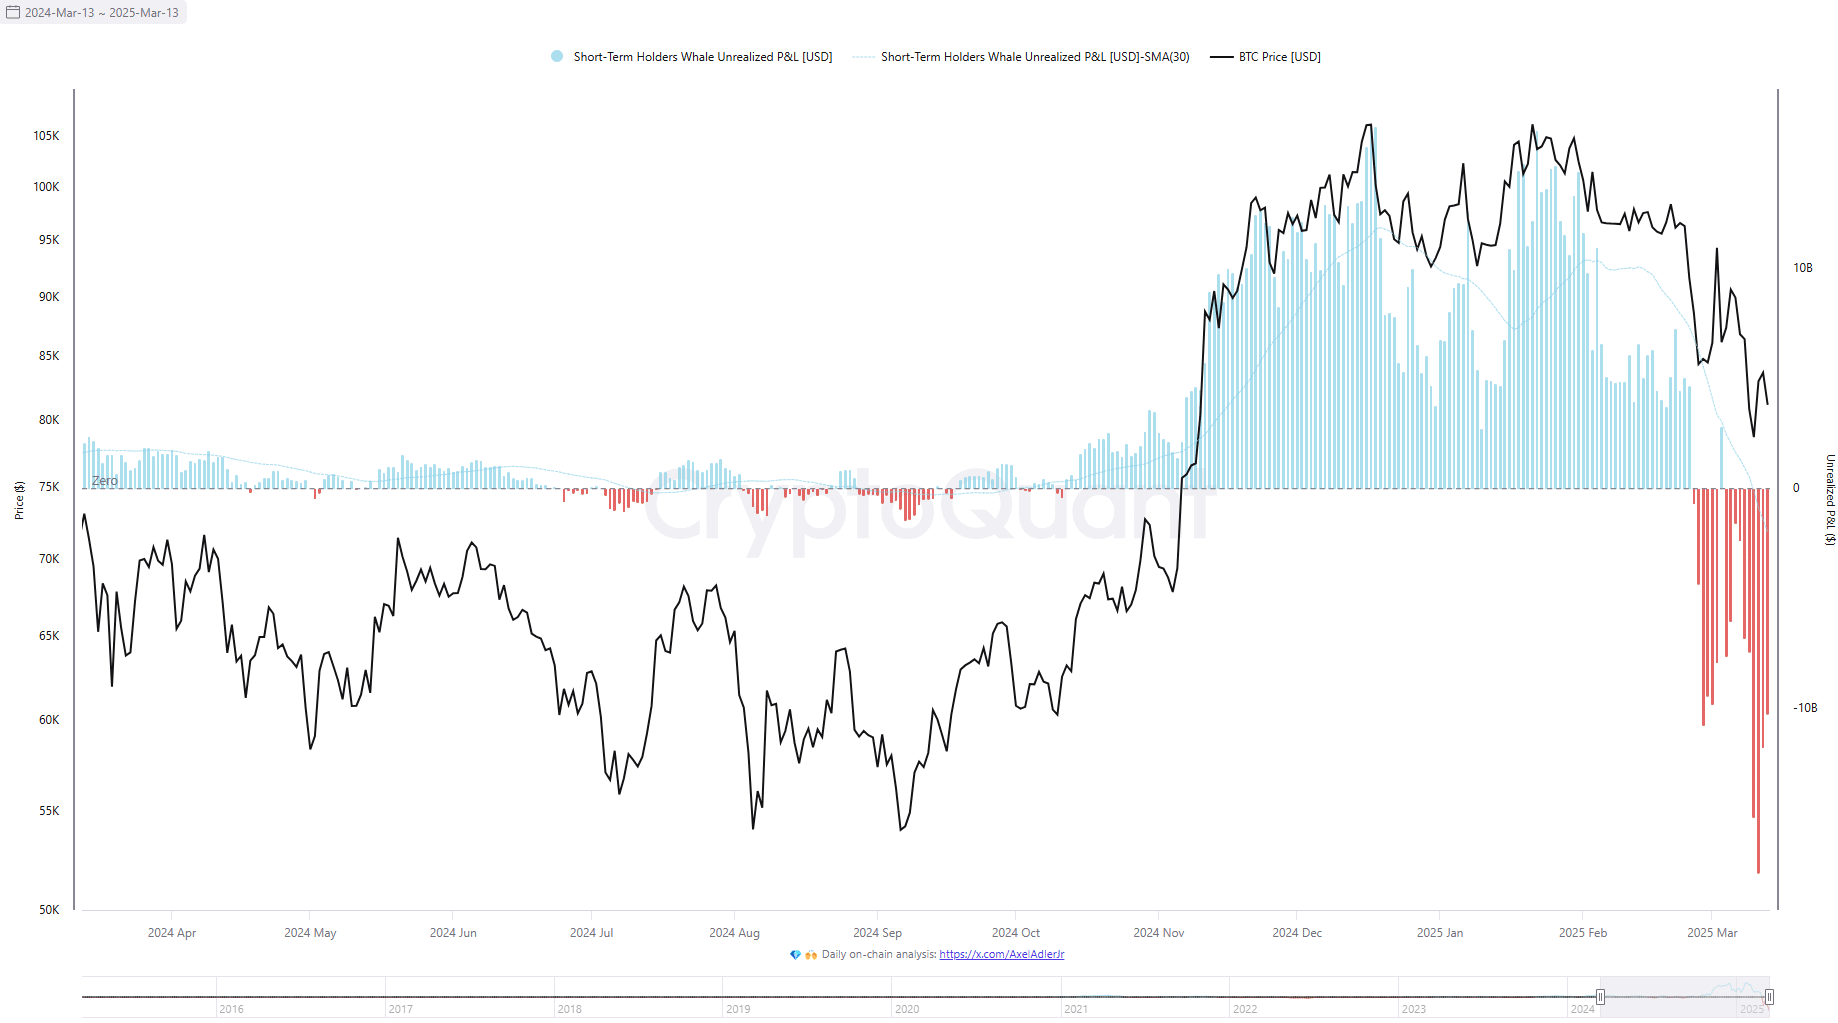
Whale holders with a holding period of under 155 days are classed as short-term holders (STHs). These STH whales saw unrealized losses in the final week of February as the price maintained its downtrend.
The STH whales’ unrealized losses reached their highest point ever on 11 March, with the value being a whopping $17.52 billion. It receded slightly lately, but showcased the possibility of further selling to protect against greater losses. In fact, it also created and maintained fearful sentiment across the market.
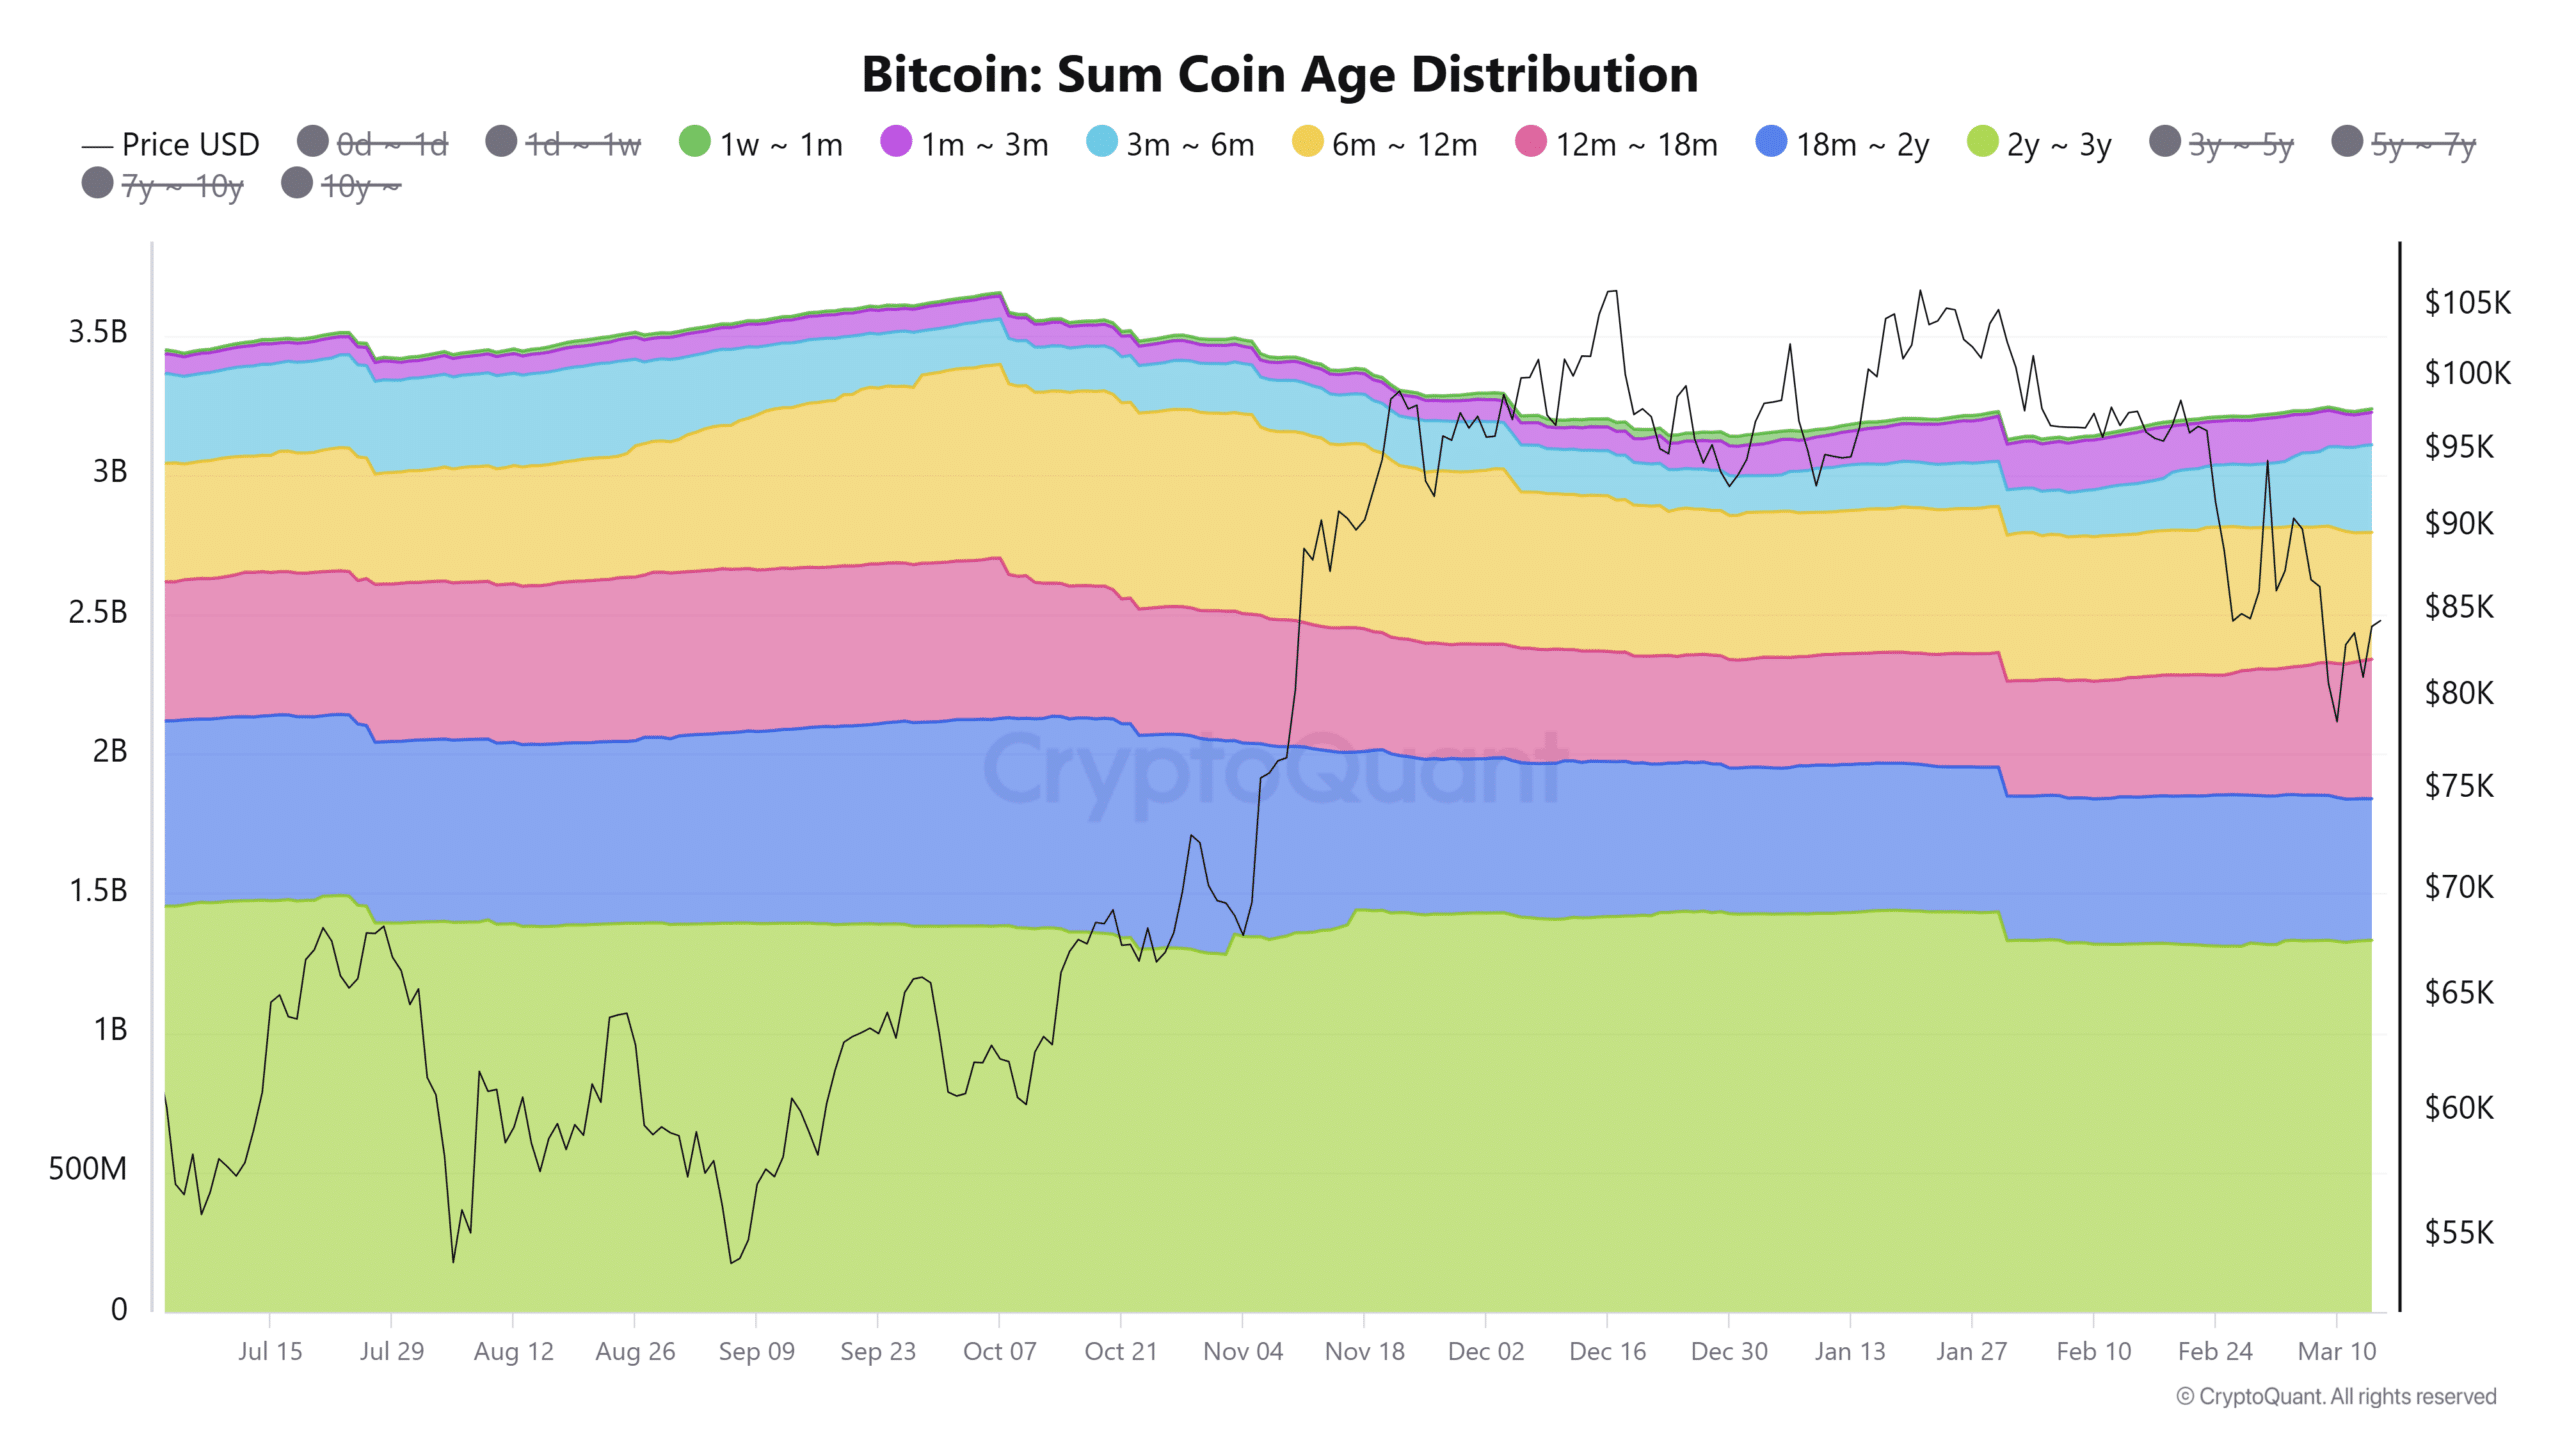
Finally, the sum coin age distribution analyzes the age of Bitcoin’s unspent transaction output [UTXO]. The metric gives more weight to the older coins. The age bands are formed based on the age of the UTXOs.
Rising values of the SCA within these age bands indicate HODL behavior or accumulation while falling values indicate distribution and hike in sell pressure.
Since late January, the 1 month-18-month age bands have generally seen increased holding and accumulation behavior. The 6-12 month age band has trended down noticeably over the past week. This hike in holding sentiment across different age bands is a positive sign.
The STH whales metric showed that recent, large BTC buyers were deep underwater. The weak apparent demand showed that there was a lack of immediate buying pressure to absorb the supply. However, medium to long-term holders appeared to retain some confidence, based on the SCA distribution.
Until the short-term pressure eases, Bitcoin could see another price drop below $80k.