
- Market sentiment around BNB has improved over the last few days.
- Most indicators looked bullish on the coin.
After a week-long decline, BNB finally came back on track as the coin’s daily chart turned green. Notably, while that happened, the coin’s price was consolidating inside a bull pattern, which might allow the coin to reach new highs in the coming days.
A bull pattern on BNB’s chart
According to CoinmarketCap, bears dominated the previous week as the coin’s price dropped to $587 on the 30th of May.
However, bulls stepped up in the last 24 hours and pushed the coin’s price up by over 1.4%. At the time of writing, the coin was trading at $613.41 with a market capitalization of over $90 billion, making it the fourth largest crypto.
Thanks to the recent price uptick, the coin’s weighted sentiment has improved. This clearly shows that bullish sentiment around the coin has increased over the last few days.
Its social volume also remained relatively high last week, reflecting BNB’s popularity in the crypto space.
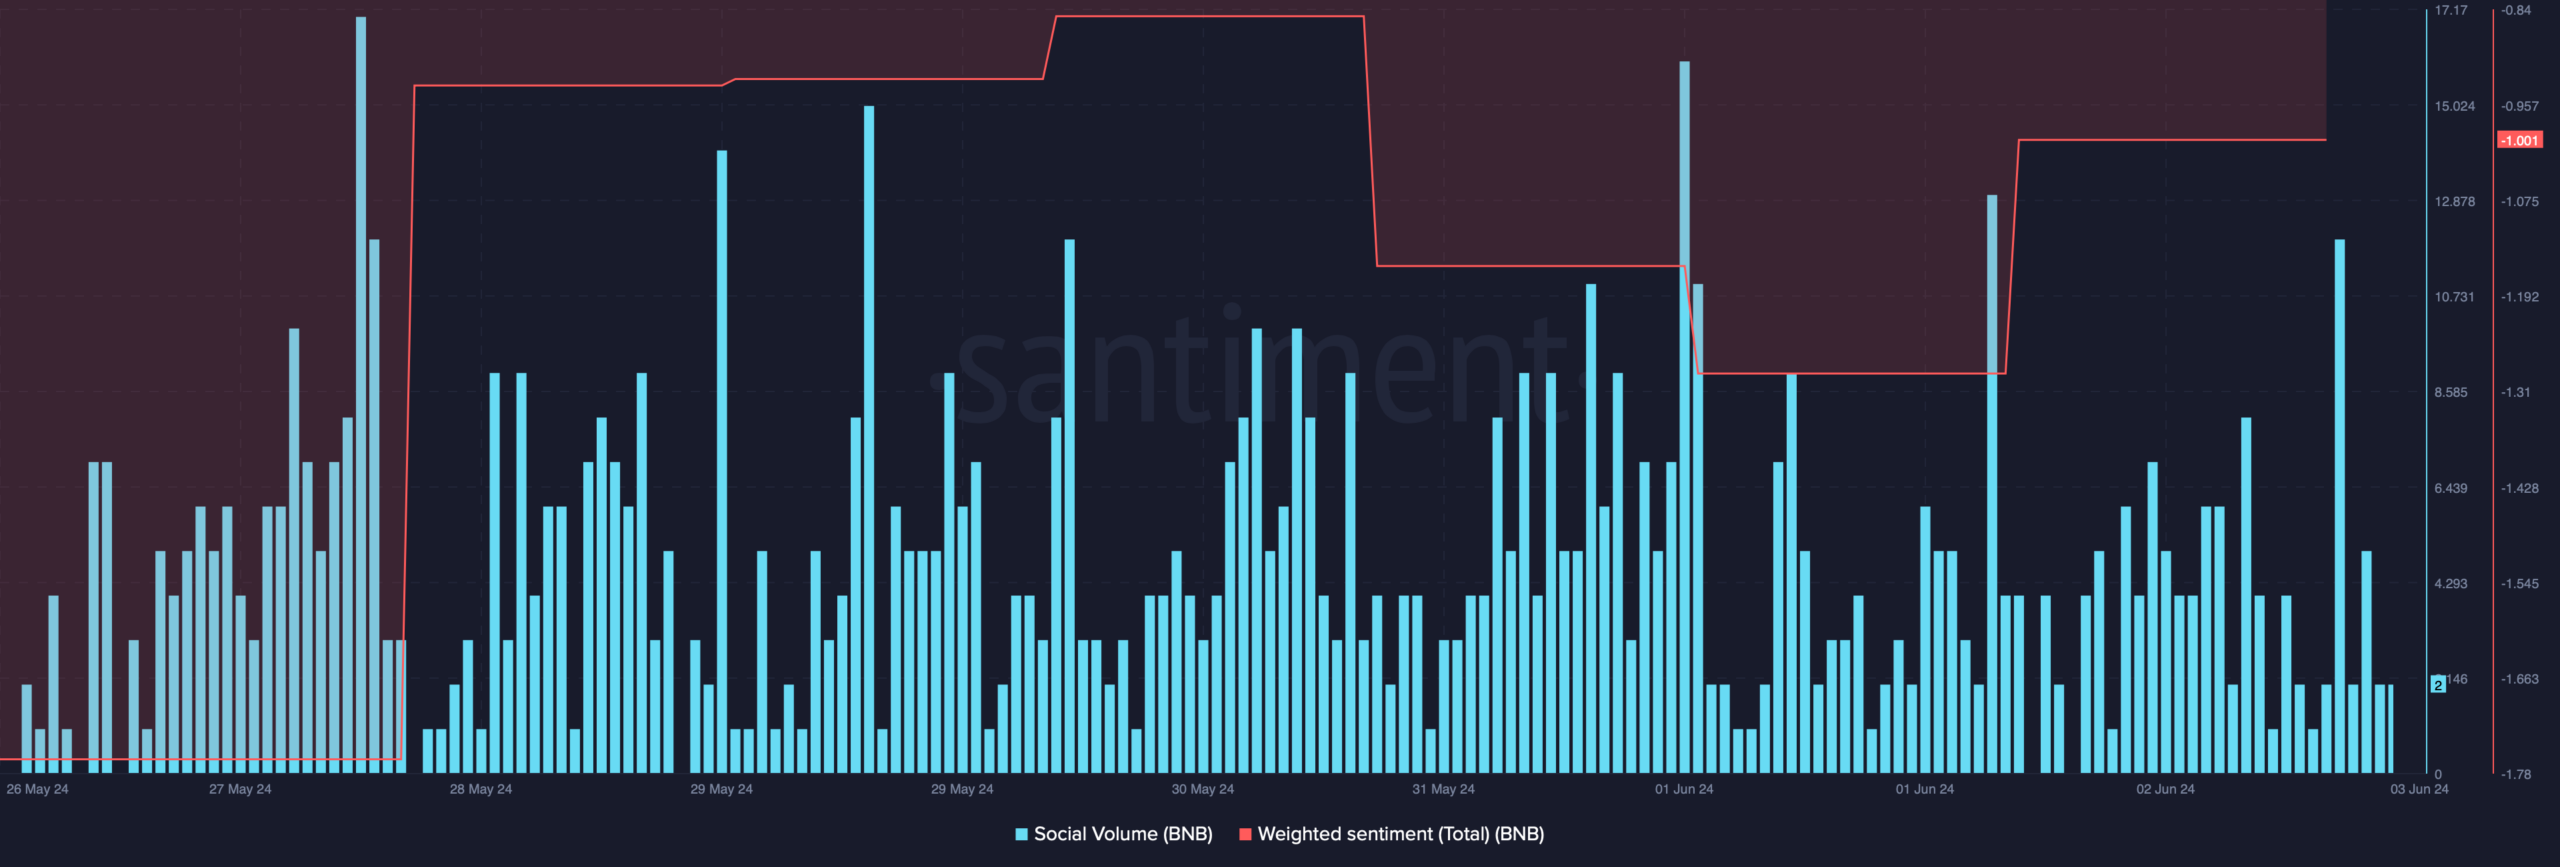
Source: Santiment
While all this happened, a bullish pennant pattern formed on the coin’s daily chart. The coin’s price entered the pattern in March and since then has been consolidating inside it.
At press time, it was close to testing the upper limit of the pattern. A successful breakout could allow BNB to go above its March high over the coming weeks.
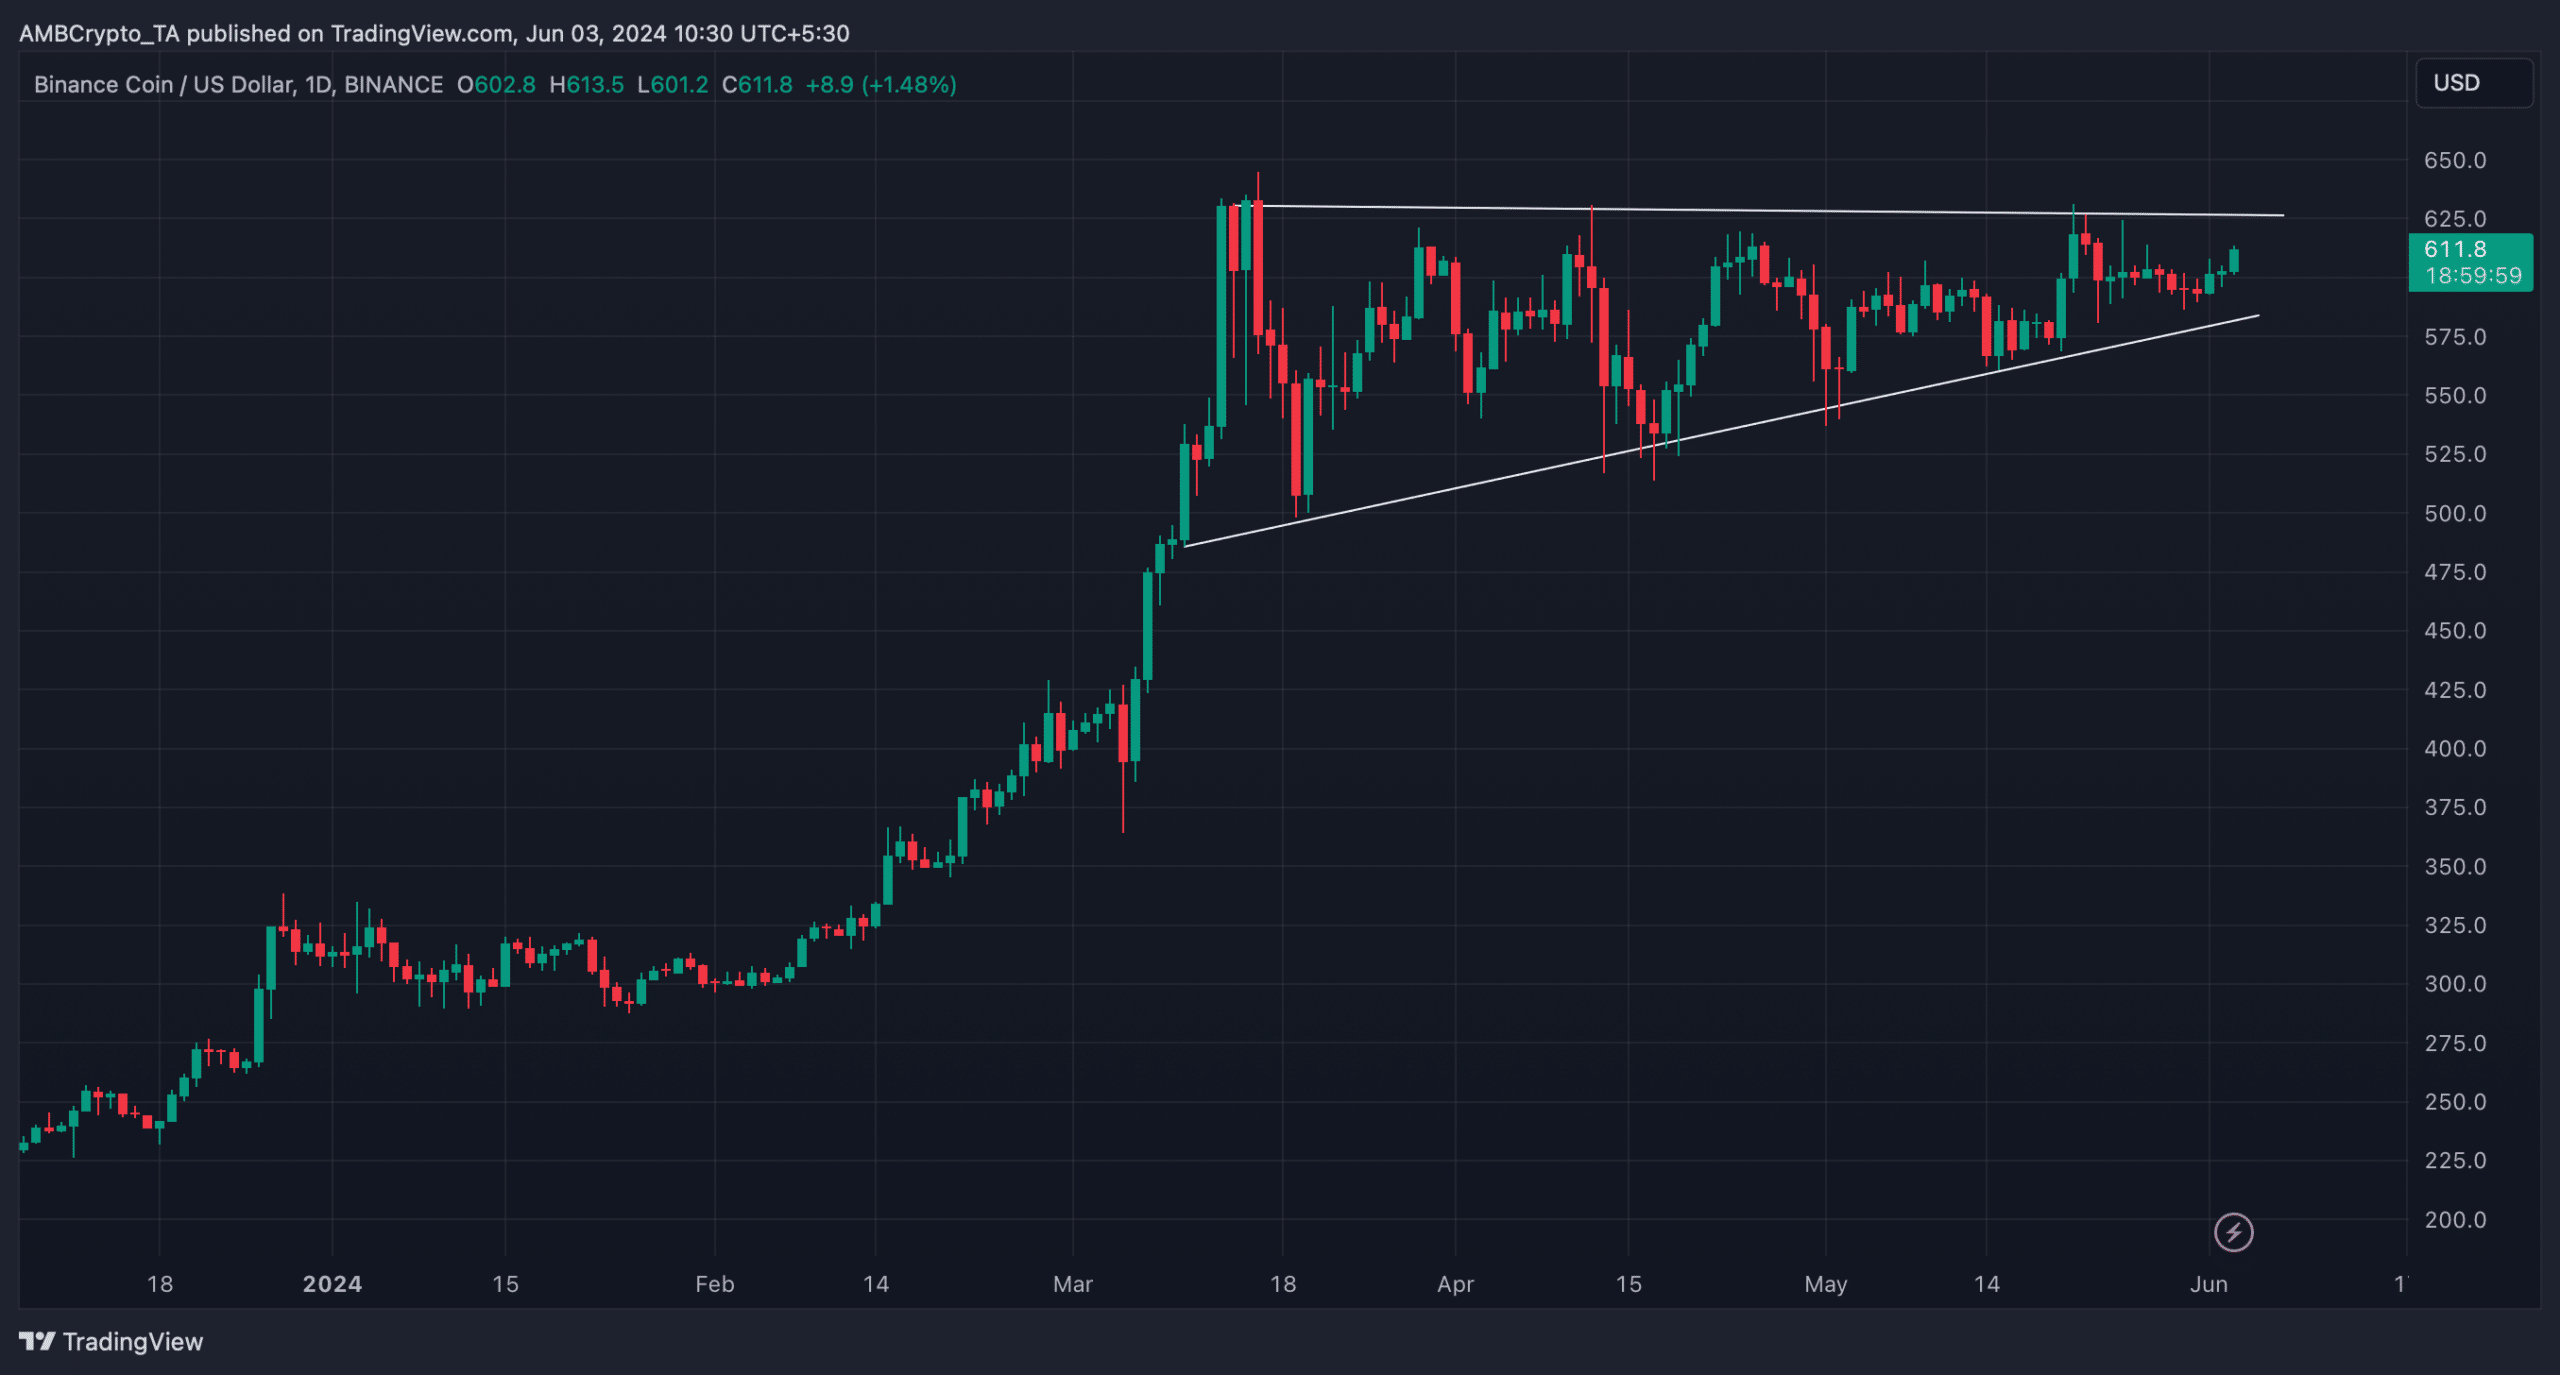
Source: TradingView
Is a rally possible?
AMBCrypto then analyzed the coin’s on-chain metrics to check the odds of BNB successfully breaking above the bullish pennant pattern.
As per our analysis of Santiment’s data, BNB’s open interest increased along with its price. Generally, a rise in the metric suggests that the chances of the on-going price trend continuing further are high.
Nonetheless, BNB’s funding rate increased. As prices tend to move the other way than the funding rate, there is a possibility of BNB turning bearish soon.
On top of that, BNB’s fear and greed index had a value of 61, meaning that the market was in a “greed” phase. Whenever the metric hits that level, it indicates a possible price correction.
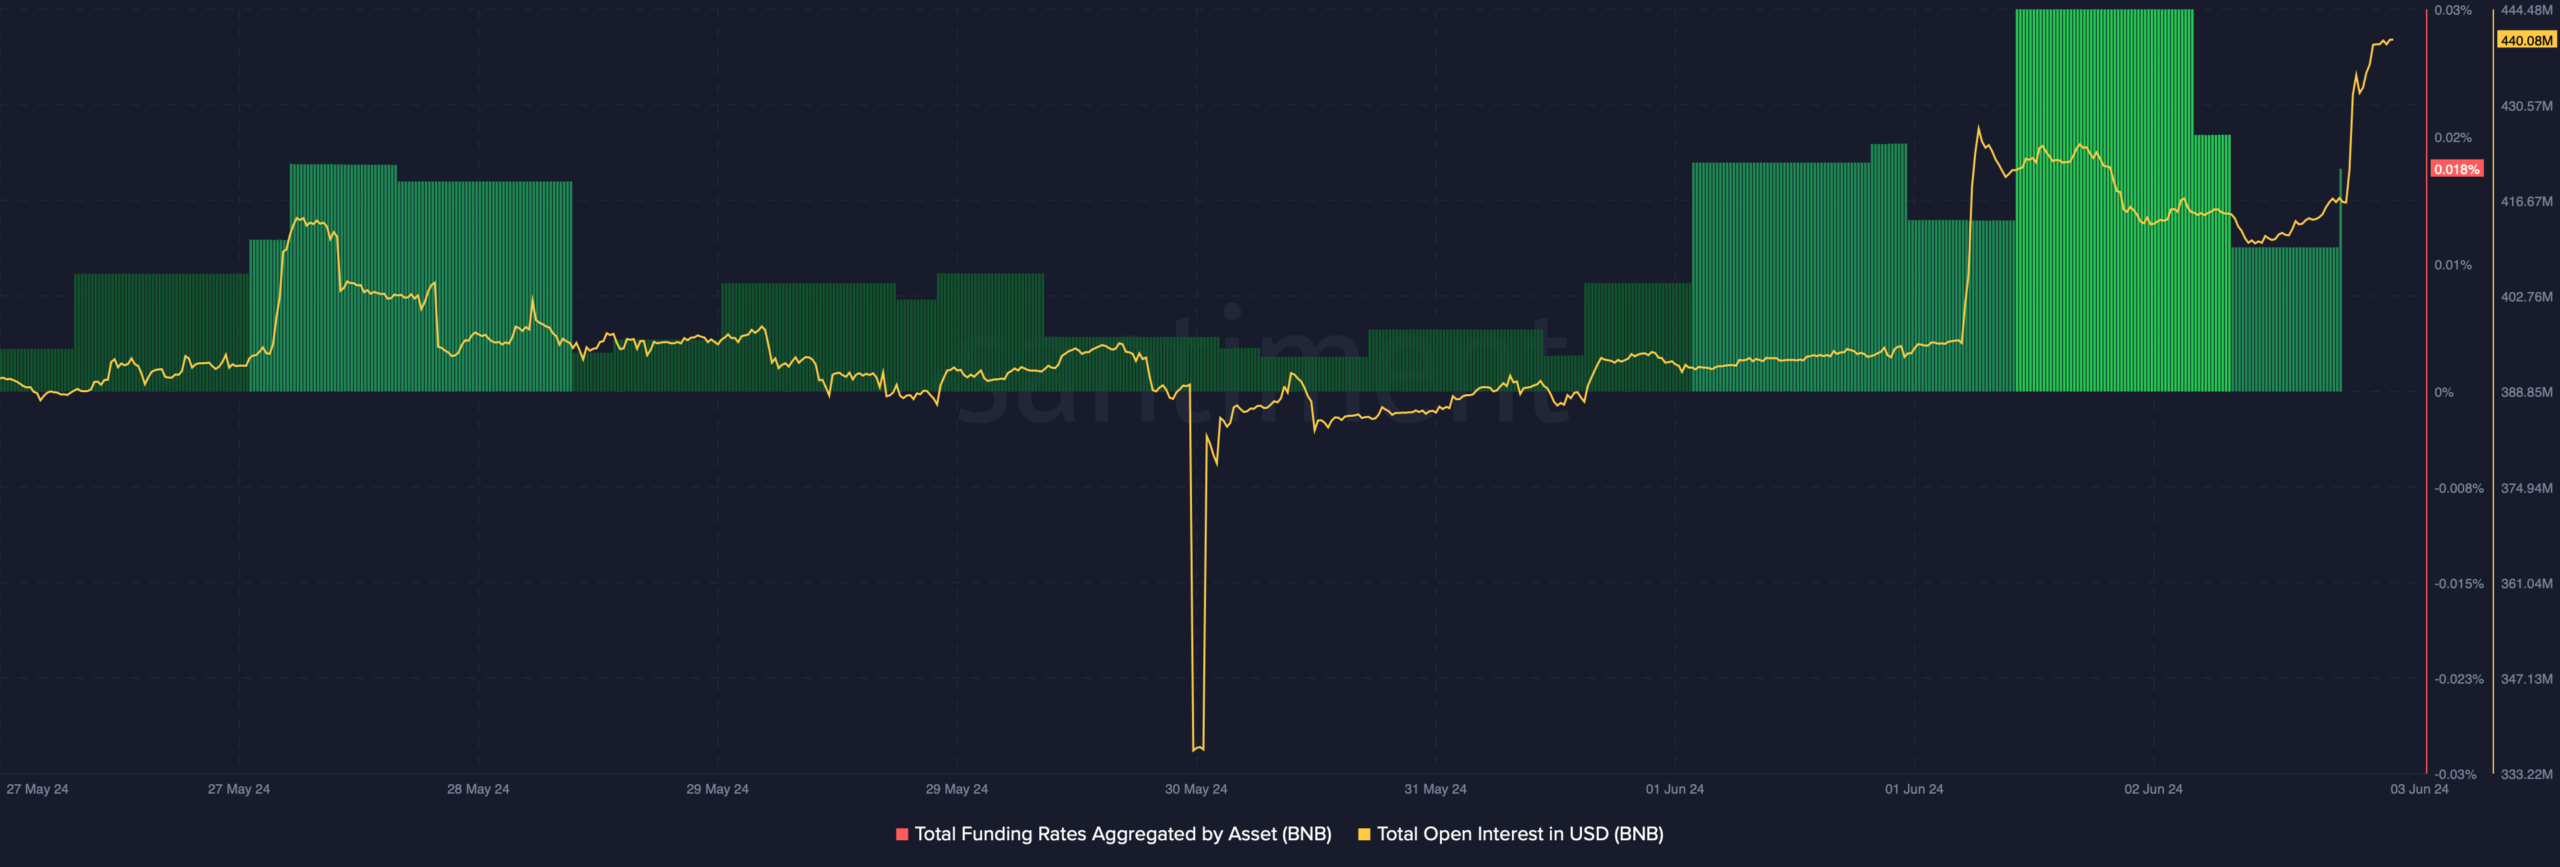
Source: Santiment
Realistic or not, here’s BNB’s market cap in BTC terms
We then took a look at the coin’s daily chart to better understand whether a bullish breakout was possible. According to our analysis, technical indicators looked pretty bullish on the coin.
For example, its Relative Strength Index (RSI) registered an uptick from the neutral mark. The Chaikin Money Flow (CMF) also followed a similar trend, hinting at a continued price increase.
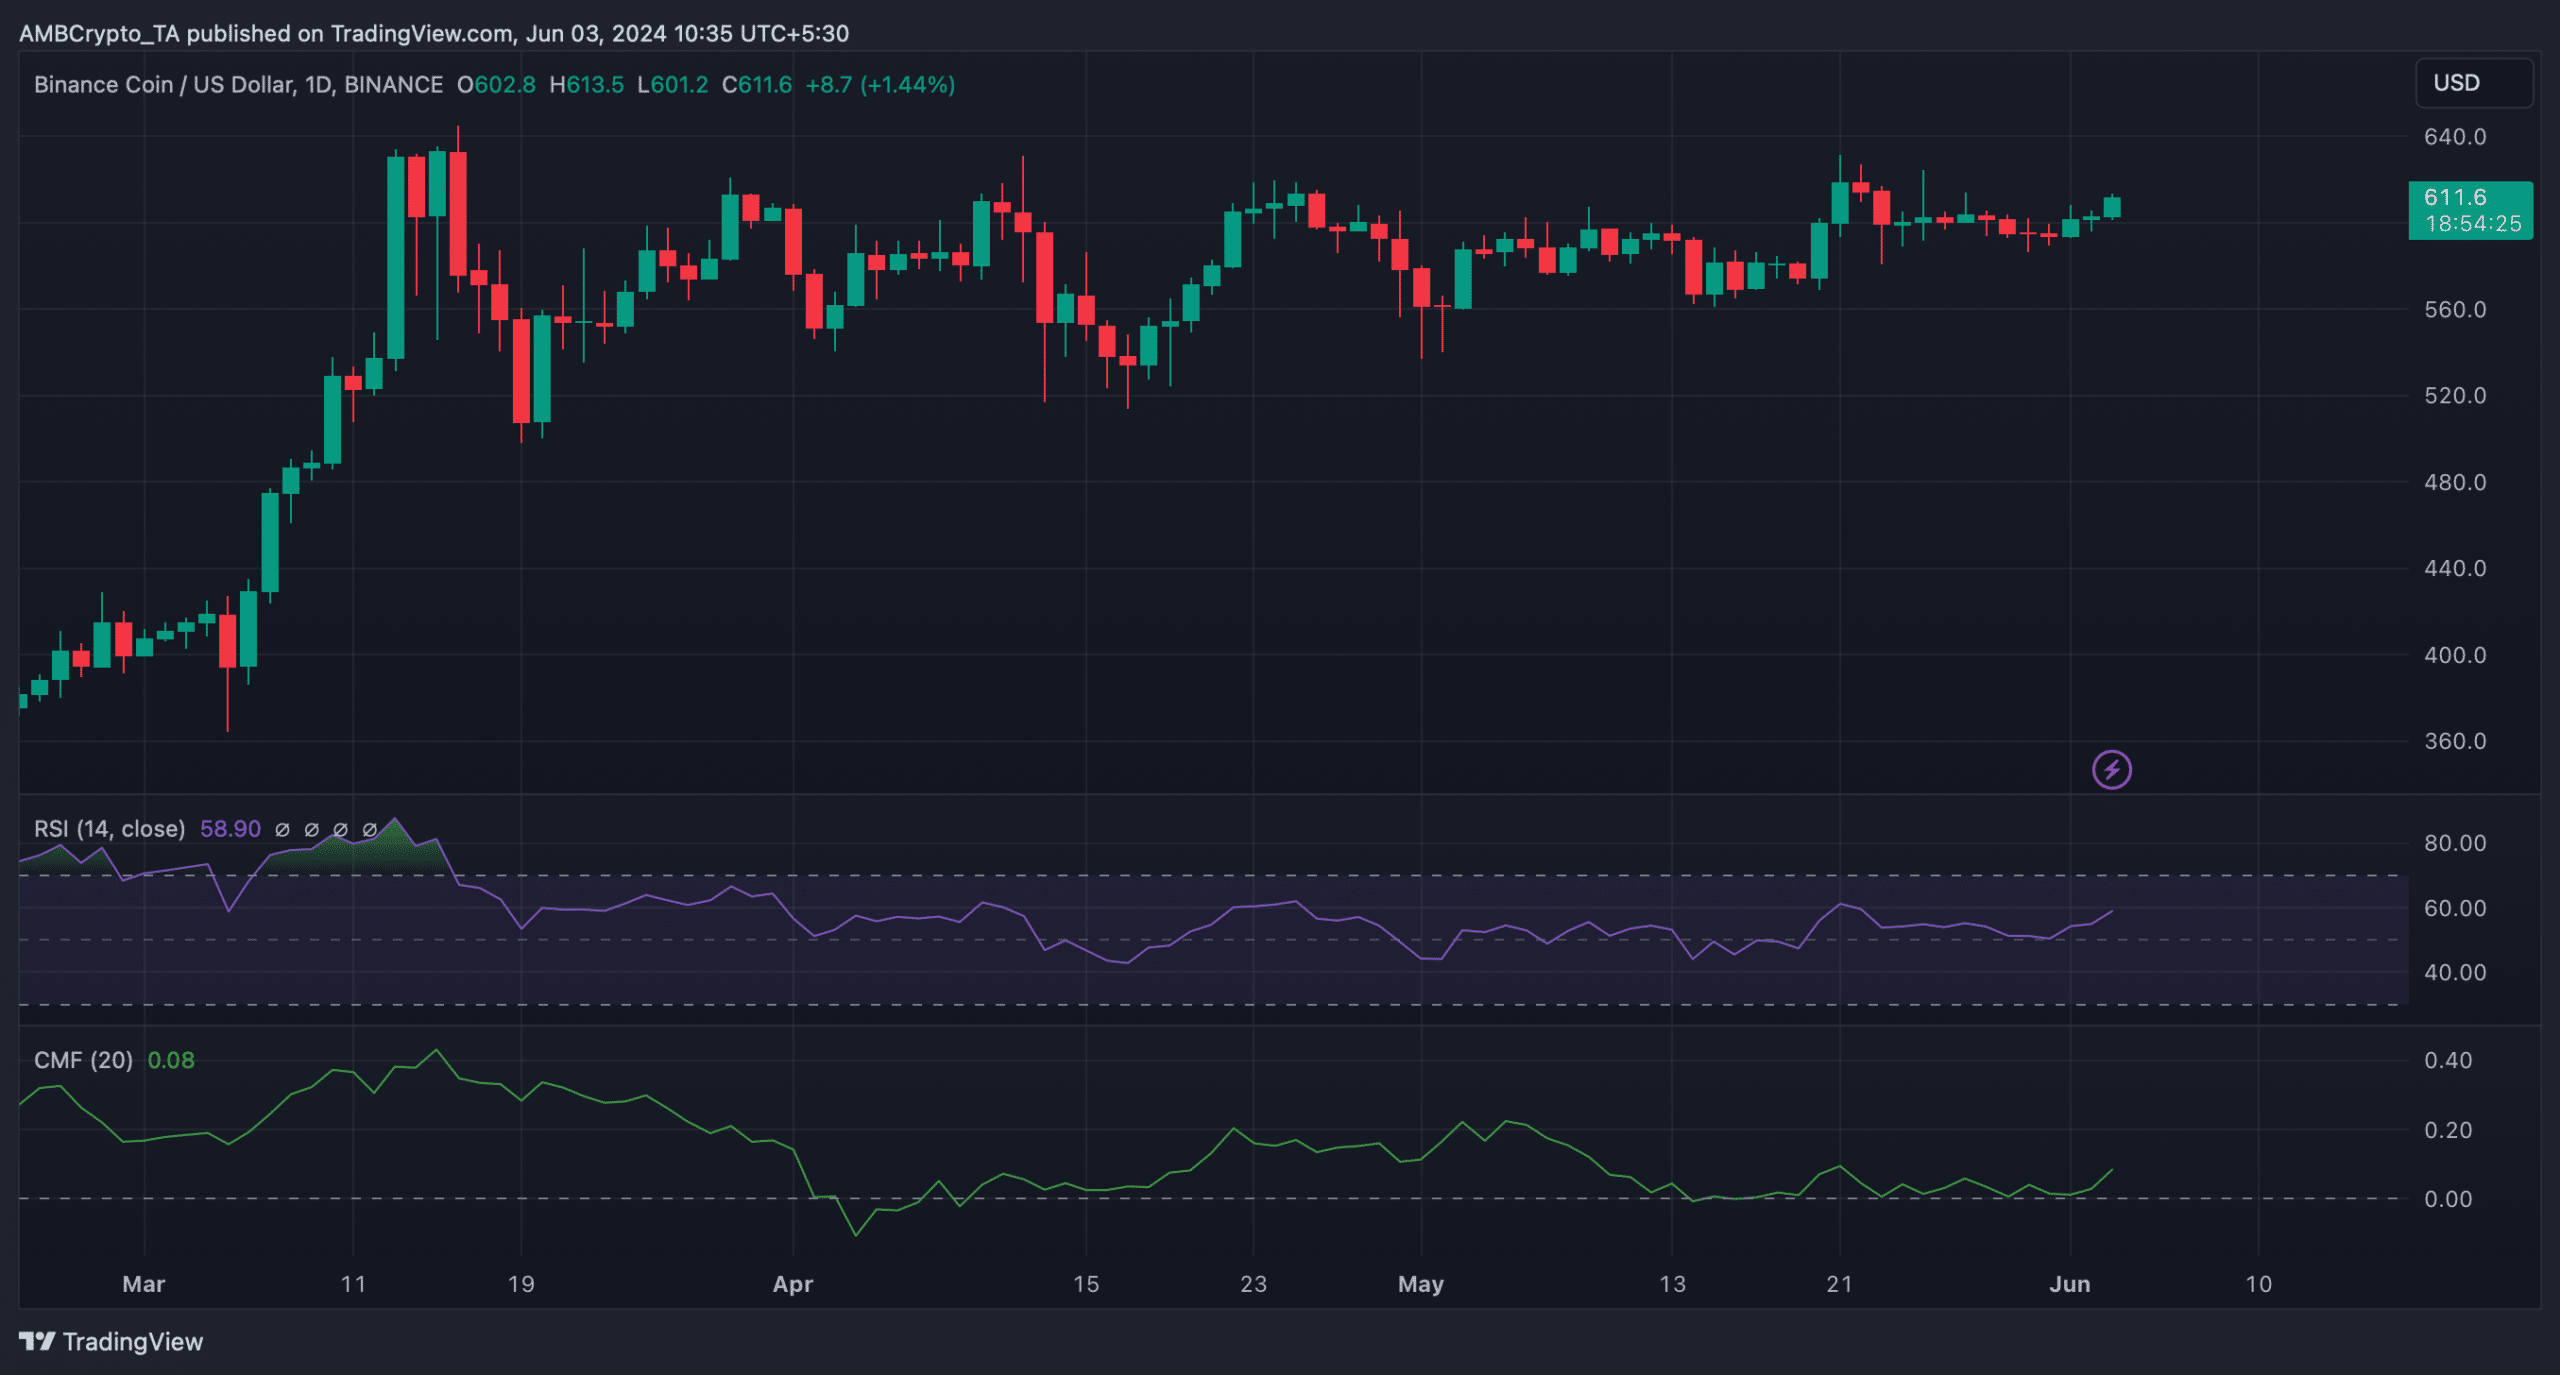
Source: TradingView