Analyzing if Uniswap [UNI] bulls can induce a rally before this pullback

Disclaimer: The findings of the following analysis are the sole opinions of the writer and should not be considered investment advice.
- UNI found rebounding grounds as it strived to prevent an extended bearish pennant breakout loss.
- The crypto’s Open Interest revealed mixed signals over the past day.
Uniswap’s [UNI] latest reversal entailed a bearish pull below the trendline resistance (white, dashed). Consequently, the sellers induced a streak of red candles as the altcoin formed a continuation pattern.
Read Uniswap’s [UNI] Price Prediction 2023-24
While exhibiting rebounding tendencies at the time of writing, UNI reclaimed the $5.6-support. Should the buyers insist on guarding the immediate support, UNI could see a compression phase in the coming sessions.
At press time, UNI was trading at $5.5, down by 3.94% in the last 24 hours.
When can buyers reverse UNI’s patterned breakdown rally?
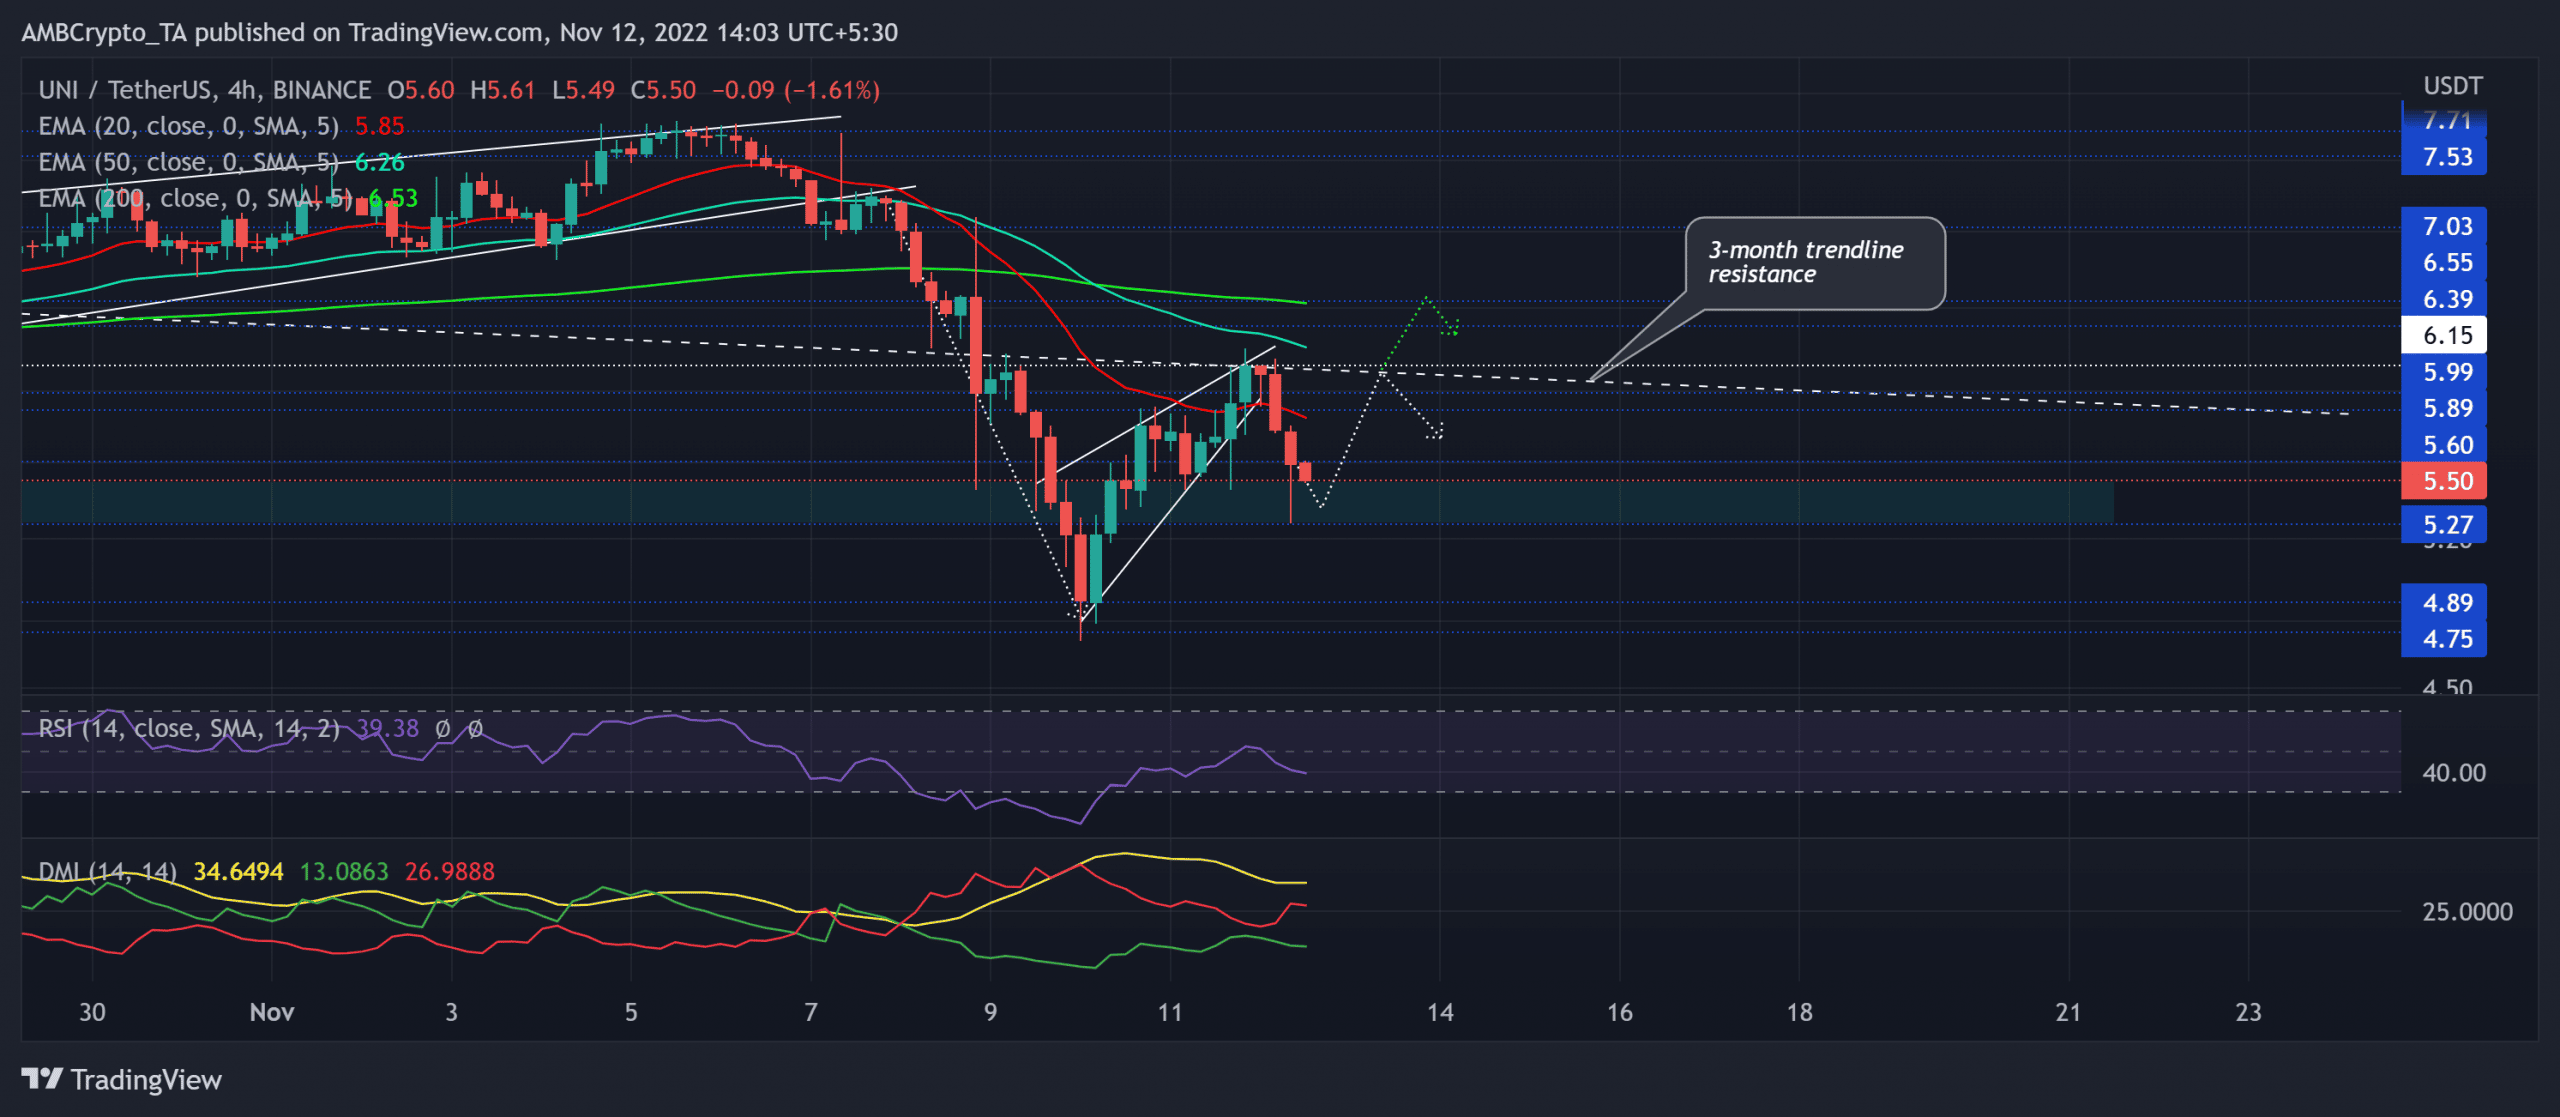
UNI’s long-term trendline resistance inflicted convincing bearish pulls over the last three months. Despite the recent rising wedge rally above this barrier, the sellers quickly pulled UNI below the resistance to depict their heightened edge.
In consequence, the decline chalked out a classic bearish pennant in the four-hour timeframe. The resulting breakdown marked an over 10% retracement while the bulls strived to reject lower prices near its relatively high liquidity zone in the $5.2-$5.5 range.
Should the buyers double down on their intentions to stop the bleeding by breaking the streak of red candles, UNI could aim to provoke a rally toward its trendline resistance from its high liquidity range.
Any close above the $6.15-mark can aid the buyers to extend their rally toward the 50/200 EMA. But a reversal from the trendline resistance could continue fueling UNI’s bearish inclinations in the coming times.
The Relative Strength Index (RSI) continued its sway in the bearish zone after failing to break above the equilibrium in its recent rally. Moreover, the -DI (red) maintained its position above the +DI (green) alongside a relatively strong directional trend (ADX).
Open Interest analysis
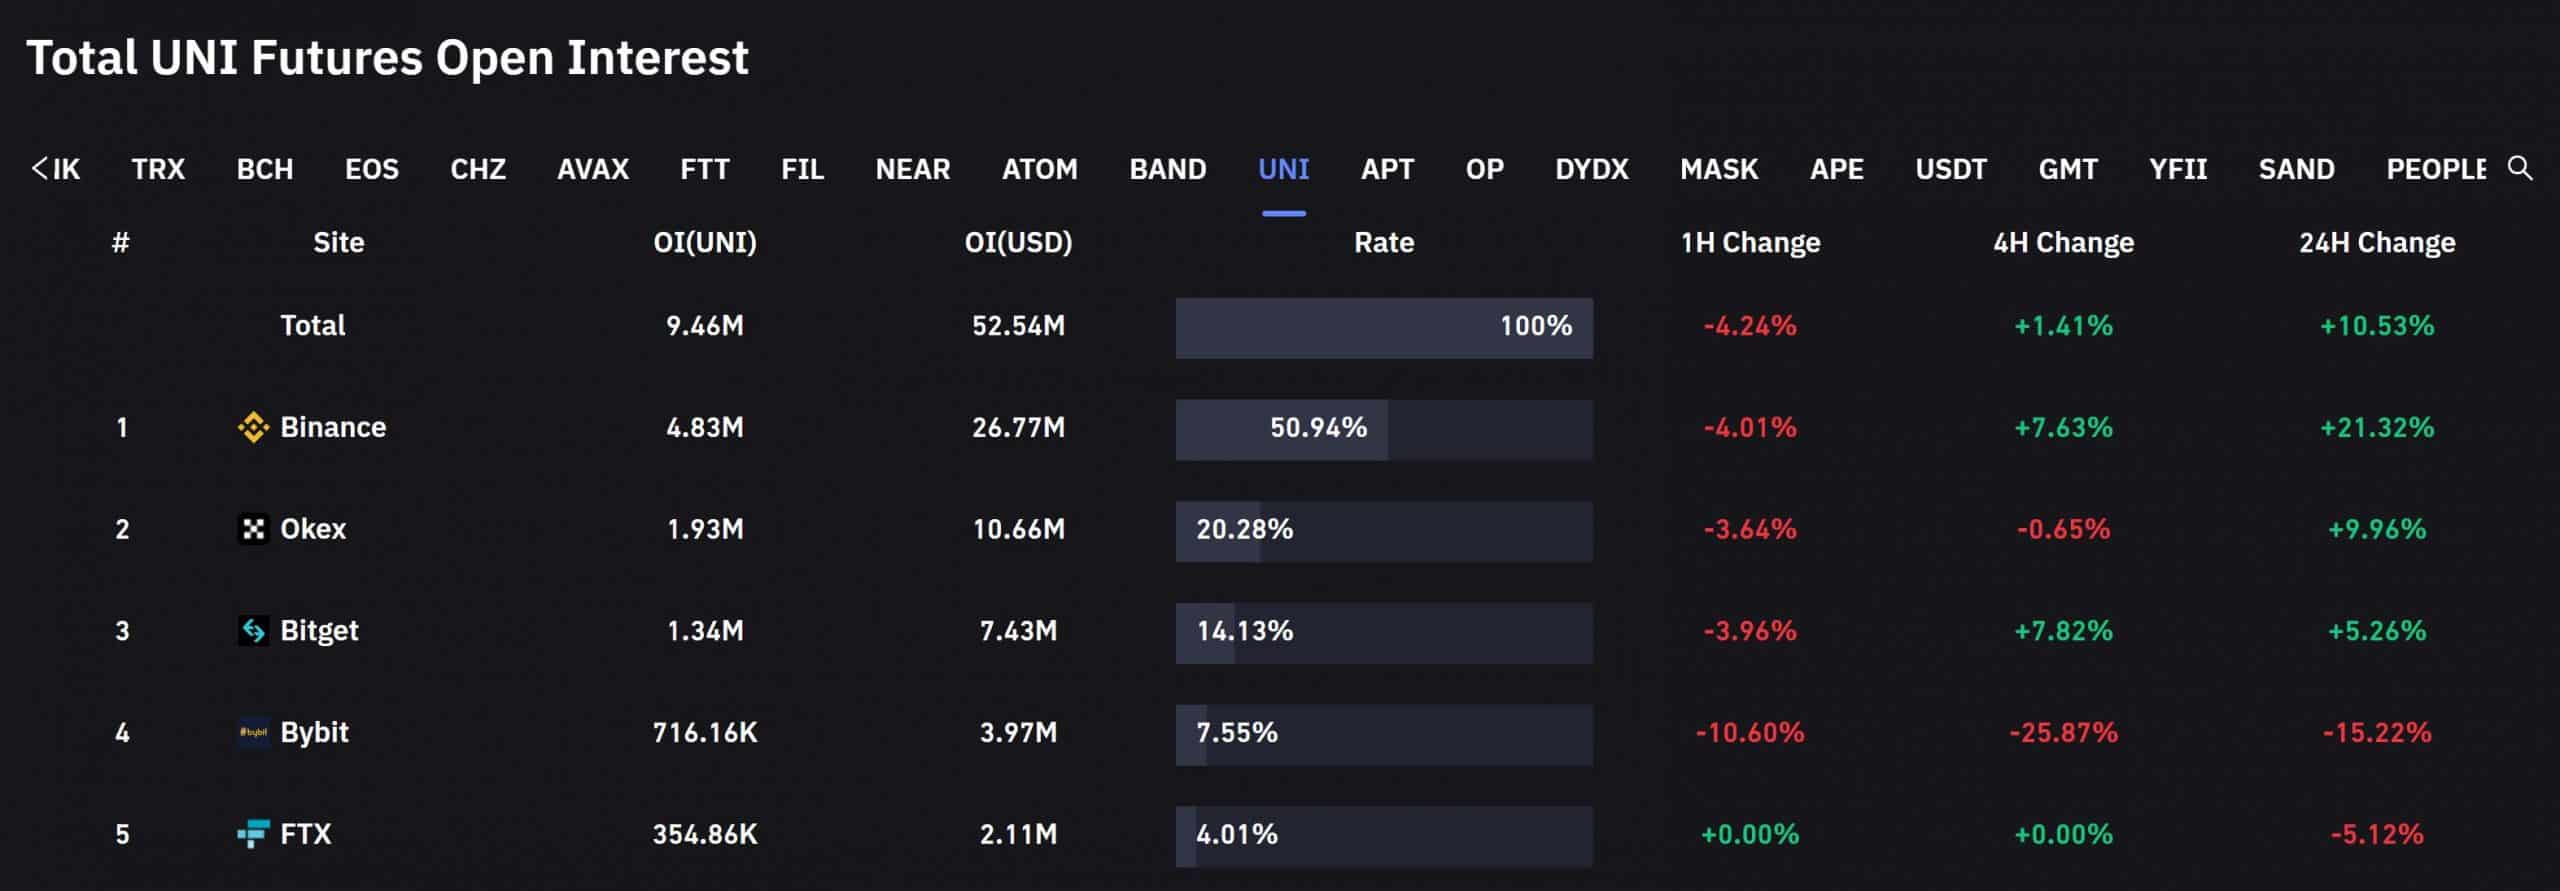
According to data from Coinglass, UNI registered an over 10% rise in its total Futures Open Interest across all exchanges. This incline accompanied a declining 24-hour price.
More often than not, such a combination indicates that new short positions are being opened. Once these shorts begin to cover, this could also hint at a bullish reversal.
Finally, overall market sentiment and on-chain analysis would be vital for making a profitable bet. Also, the buyers should keep a close watch on Bitcoin’s movement as UNI shared an 85% 30-day correlation with the king coin.